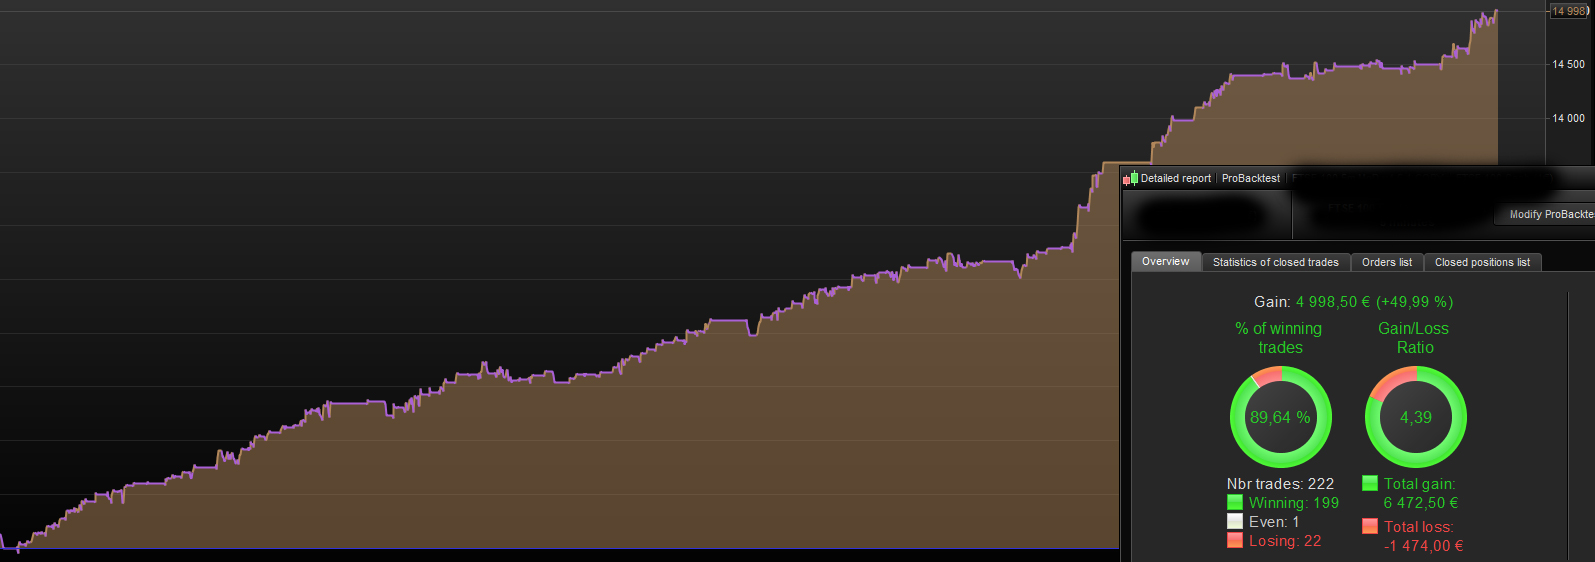
After several hours optimizing a strategy I´m finally done and the result is as the first picture. All the variables in the backtest is set to “Fixed values” and I get the same result every time i run the test.
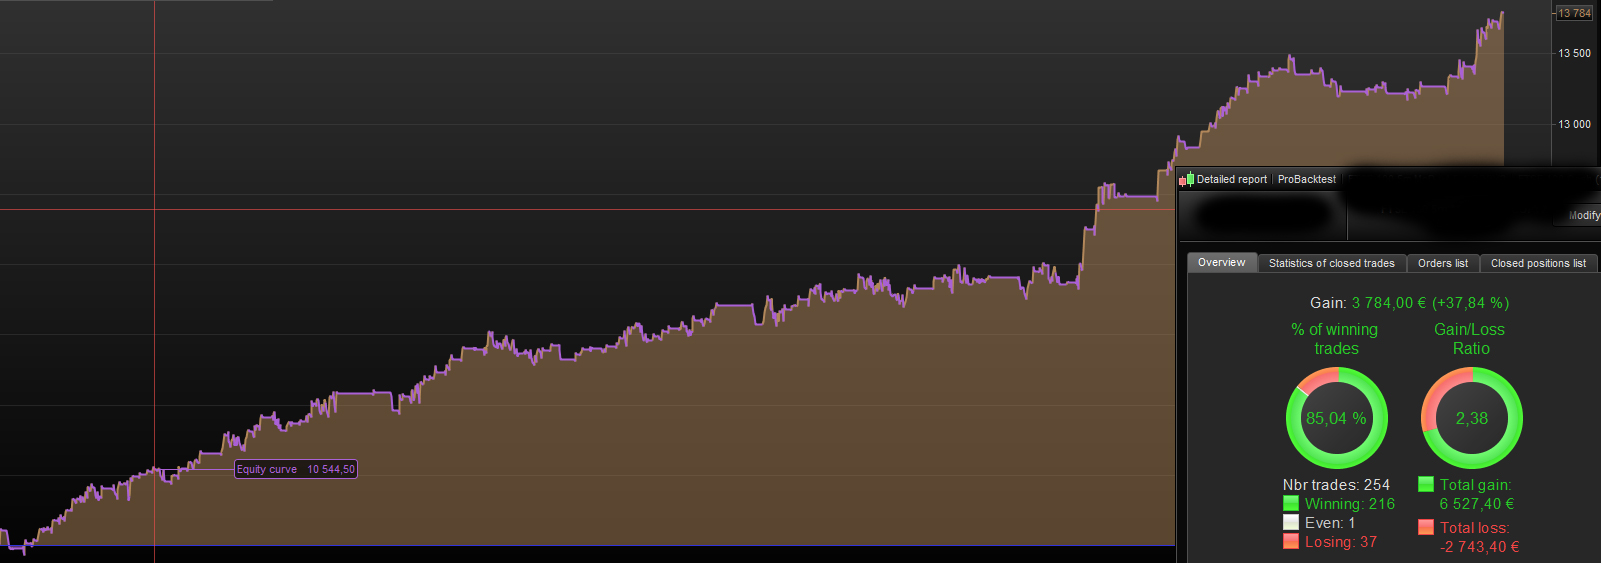
In the second picture I have replaced the variables in the CODE with the same fixed values as in the backtest. As you can see the result is much worse…
-This is not the first time this happens to me!
-I have done the same insertion of the fixed values in the code several times to make sure I haven´t made an error!
-Spread and everything else is the same.
-I have tried to get some answers in 2 other threads to see if this problem has to do with that
Unable to save Trading Strategies
Problem with ProBackTest, records disappear during optimization
Why is this happening???
The result you see in the backtest Table is WITHOUT tick by tick being applied to each individual trade.
The result you see on an equity curve and Detailed Report is WITH tick by tick being applied to each individual trade.
Apols for the brief answer … I am eating my tea! 🙂
EDIT / PS
Above may not be the answer to your Issue as I see 222 trades vs 254 trades.
Why do you not show in the screen shots above … the period over which the backtest occurred??
I am eating my tea!
Tea is something you drink!
Why do you not show in the screen shots above … the period over which the backtest occurred??
I have tested over the same period, 200bars, in both Pictures.
Tea is something you eat when you are (hope it never happens) out of coffee!
Tea is something you drink!
You must have been brought up in an affluent environment?
Oboe if you post your Algo code on here then I would backtest on my platform to see if I get same results as you.
Otherwise we are guessing as to why you get disparity in your results?
I have seen the Equity curve value be both better and worse than the gain in the table.
Me too!
Also the equity curve can show profit / loss for a current open trade.
The BT Results Table shows completed / closed trades only.
The result you see on an equity curve and Detailed Report is WITH tick by tick being applied to each individual trade.
In this case then I have shoved Pictures of Equity curves and detailed reports, so tick-by-tick is applied on both. Code and values are also the same!
The difference is that in the first Picture the fixed values have been collected from the optimizer, and in the second Picture they were written directly in the code.
Yeah well if I do the same as you and get the same results then we can explore further.
If I do not get same as you then you have a way forward to explore.
If you do not post the code then we are guessing and you are getting more frustrated due to lack of a solution being offered?
If you do not want to post your code then just say and I will try and think of a few possible reasons?
For example … do you have two places in your code where you use the same variable but you are only entering the fixed value in one place only??
The difference is that in the first Picture the fixed values have been collected from the optimizer, and in the second Picture they were written directly in the code.
Surely you must be introducing the problem … in the first picture you show 222 trades and in the second picture you show 254 trades
I get the exact same “bad” result.
Surely the difference is directly related to the difference in number of trades?
Seems you need to narrow down the field of investigation?
Have you tried to isolate if just shorts or just longs make up the difference or both shorts and longs?
Have you tried to Graph the triggers that results in a trade opening?
I guess you are hoping that somebody will say … ah I’ve had that and it’s due to xyz?? 🙂
You must have been brought up in an affluent environment?
Not really – just one where we ate breakfast, lunch and dinner and drank tea as a refreshing beverage. We never did brunch. We always felt sorry for those who had to have tea instead of a proper meal.
Sorry for being a bit off topic but tea is important to us Brits!