This simple little code snippet will plot a graph of any strategies average gain for a stake size of one. This can help us see how steadily over time a strategy performs. A stable strategy is a good strategy!
The return is average gain for every stake size of 1 so it is not gain per trade but gain per £1, 1 Euro or $1 traded. This means that the average gain result returned will always be the same no matter what the minimum stake size is or whether you use varying stake size. This can really help us compare one strategy to another even one test on one instrument to a test on a different instrument.
On a rising price index you might expect to find that average gain per 1 would increase with time as range increases with price so if you see a falling average gain then this might be a sign that it is not a good strategy and that it might be curve fitted. On a forex chart that just goes up and down around a mean you would expect average gain to be pretty level in a good strategy so if you find that it is better in one part of a chart than others then it might be a sign that your strategy is curve fitted or that your position sizing is curve fitted.
It may be very simple but it is a very useful tool for analysing strategies on a level playing field.
I post it here just in case it is of interest to anyone and for GraHal to hopefully hoover up for the snippet library!
Just add it to the bottom of any strategy but above any GRAPH or GRAPHONPRICE instructions that are already there.
if countofposition > countofposition[1] then
trades = trades + (countofposition - countofposition[1])
endif

if strategyprofit <> strategyprofit[1] then
averagegain = strategyprofit/trades
endif

graph averagegain
[attachment file=94439]
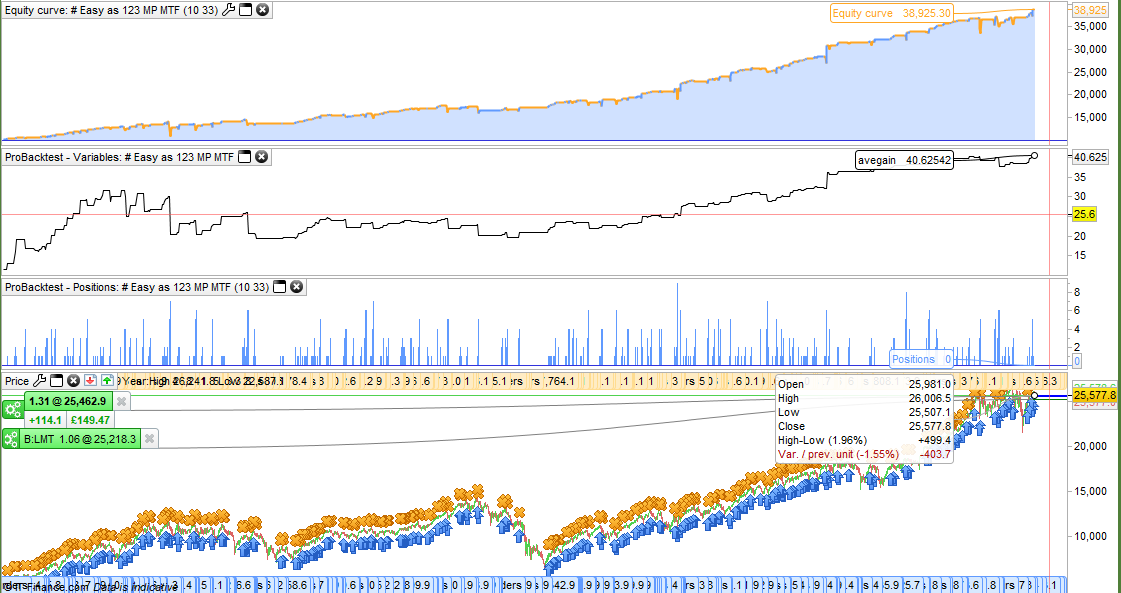
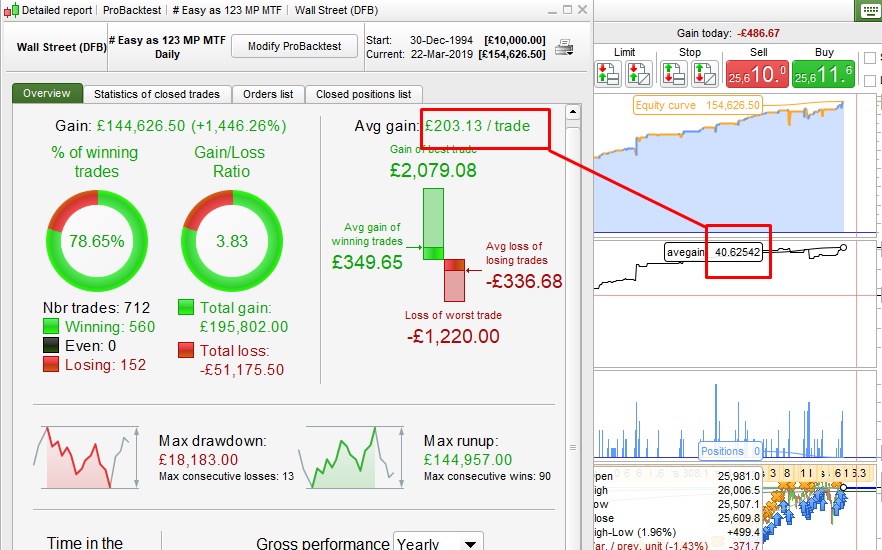
In the image in my first post the strategy had a fixed stake size of 1 and returned an average gain of £40.625 per £1 staked. In this second image I increased the stake size to £5 so the strategy report now gives us an Avg Gain of £203.13. At a glance we would think that this is a better strategy – who wouldn’t want £203.13 instead of £40.625? But by adding my code snippet we can see that both strategies are the same with a average gain of £40.625 per £1 position.
We have levelled the playing field that we are testing on. It would be nice if this sort of information was included in the PRT strategy reports.
[attachment file=94442]
Thanks a lot for this very short, efficient and usefull code !
Hi
Excellent! Can you add average ?
Can you add average ?
What average? An average with a fixed period will just be a smoothing average and not really tell us any more useful information except whether the strategy is doing better or worse than the average at any point in time. We know this anyway as if the latest value is less than the last value and the line is going down then it is doing worse!
The value returned is an all time average of returns to date for a stake size of 1 and I feel is all the info we need but maybe this is what you mean. Change the period to whatever you want.
avegainperiod = 20

if countofposition > countofposition[1] then
trades = trades + (countofposition - countofposition[1])
endif

if strategyprofit <> strategyprofit[1] then
averagegain = strategyprofit/trades
endif

ave = average[avegainperiod](averagegain)

graph averagegain
graph ave
Congratulations ! That is a new metric mesurement sys… I like it.
I usually test any “new strategy” with either a close “after N bars” or the same stop and target amount to see if there is an edge or not with the signal given…
I will now also use yours. I’ll call your code the “Vonasi’s strength” 😉
Good day.