That sounds like a good tactic, I will try this;)
The T comes from “Tag” and stands for day in german. So basically Piv T and Piv D should be the same.
Ha, nice one! language barrier again! 🙂
So next we need to determine if …
Piv D/T is todays / current day H+L+C/3 and so Piv changes as the day’s price moves on?
OR or as you have coded in your System
Pivot = (DHigh(1) + DLow(1) + DClose(1)) / 3 … which is yesterday’s price levels??
I wanted to use yesterday’s price levels. This is also how the pivot indicator is calculated, I guess.
I change to code from “set target” to “exitshort” and “low crosses under pivot”. However, this is not exactly as I planned, because now the exit is triggered not immediatly but rather at the open of the new candle.
IF shortonmarket and low crosses under pivot then
exitshort size contract at market

ENDIF
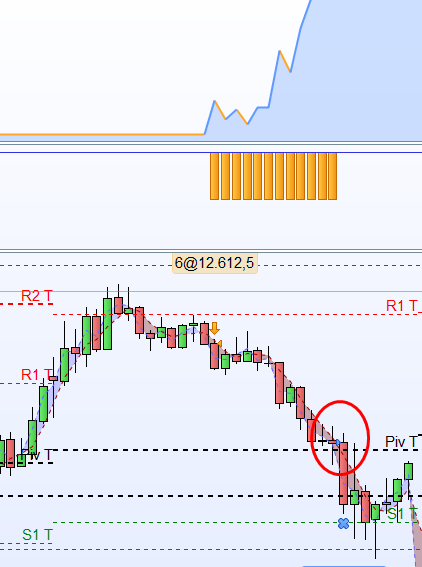
So apparently the Pivot lines must be identically with the Pivot lines from the chart since the exit is triggered as you can see in the picture.
Last but not least there is still the problem with the range. The program does not seem to recognise that condition.
now the exit is triggered not immediatly but rather at the open of the new candle
I’ve been out for a family meal so coming at with a fresh mind, what happens if you try …
If bearishr1 Then
SellShort size Contract at Market
Exitshort at pivot stop
Endif
This did not change that much. But I figured out, that the system is better off without any stops at the pivot lines. So right now I let it roll until a candle with higher highs or lower lows develops;)
Do you have any idea what we can do about the entry within the range of +- 4 points to the pivot lines?
dojisize = 4.2*pipsize
doji = Range >= ABS(Open[1] – Close[1]) * dojisize
What Market are you trading on? (good to name the market at top of your code, then easy to find) Try *pipsize as above?
Also enter GRAPH Range >= ABS(Open[1] – Close[1]) * dojisize at the bottom of yuor code and then backtest.
How many times do you see Range >= ABS(Open[1] – Close[1]) * dojisize during the backtest period??
I’m trading on the DAX. For a period of 100 I see 333 times to range and 9 times a trade was triggered. Does that mean the code is working after all?
Try
GRAPH (close[1] <= r1+4 and close[1] >= r1–4) and close<low[1])
and where that lines up with
GRAPH Range >= ABS(Open[1] – Close[1]) * dojisize
then you have all conditions to trigger a SellShort = TRUE. Does that equal 9 times?
When I try “GRAPH (close[1] <= r1+4 and close[1] >= r1–4) and close<low[1])” I get an error report for some reason:( The programm does not let me do that, why is that?
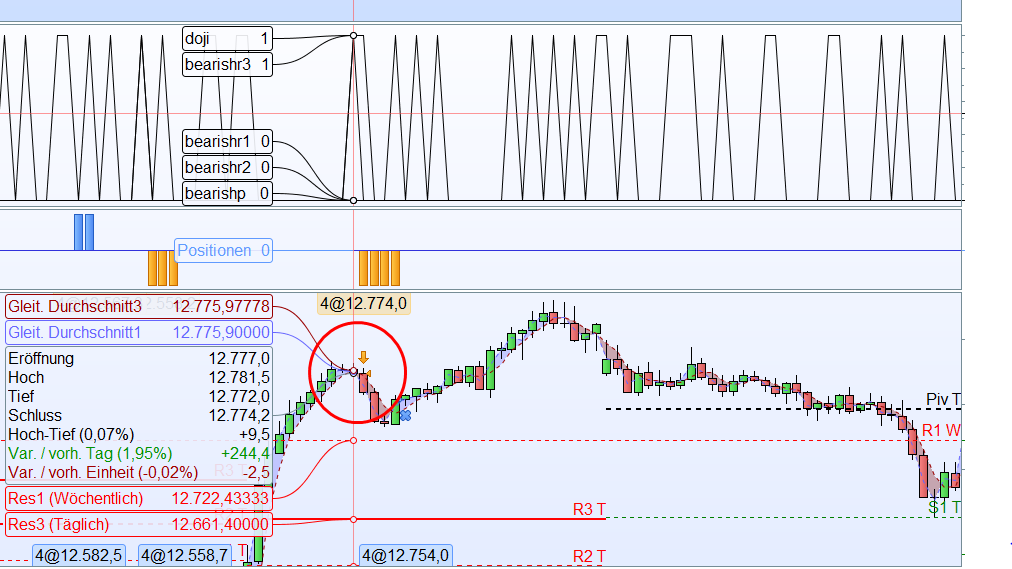
This worked. I graphed all Pivot lines and there seems to be an issue with the timeframe. For instance look at the picture. It says, that the doji was developed within the range of the R3 line, but the R3 line is way too far away. What could be the reason for this?
It be good if you copy the code you are commenting on as it will save me having to go back (to page 1 of this Thread etc) and guess / search for which bit of code you are commenting on? 🙂
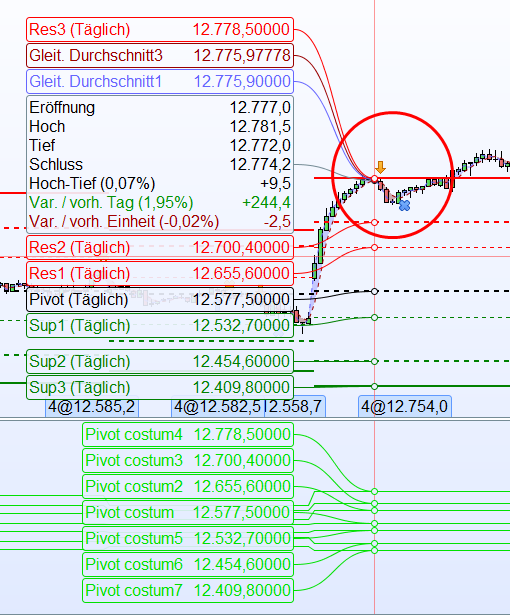
Ok, I aligned the two time frames. I created an indicator with the pivot lines and displayed them into the chart. As you can see they are now equal. But I changed my prefered Pivot point settings. I want the pivot points only to consider a daily time frame from the opening at 9:00 till the closing at 17:30. How can I change the settings within the code so the pivot points only considere this time frame?
//DAX

DEFPARAM CumulateOrders = false
DEFPARAM FlatBefore = 090000
DEFPARAM FlatAfter = 171500

Pivot = (DHigh(1) + DLow(1) + DClose(1)) / 3
R1 = 2*Pivot - DLow(1)
S1 = 2*Pivot - DHigh(1)
rR2 = Pivot + (DHigh(1) - DLow(1))
S2 = Pivot - (DHigh(1) - DLow(1))
R3 = R1 + (DHigh(1) - DLow(1))
S3 = S1 - (DHigh(1) - DLow(1))

dojisize = 4.2
doji = Range >= ABS(Open[1] - Close[1]) * dojisize

bearishr1 = (doji and (close[1] <= r1+4 and close[1] >= r1-4) and close<low[1])

stoplownextcandle = low<low[1]
stoplowdoji = low>low[1]

stophighdoji = high<high[1]
stophighnextcandle = high>high[1]

size = 30
stopbull = 2
stopbear = 2

If bearishr1 Then

SellShort size Contract at Market

Endif

if shortonmarket  and stophighnextcandle then
set stop ploss (high+stopbear)
endif

if shortonmarket  and stophighdoji then
set stop ploss (high[1]+stopbear)
endif

IF shortonmarket  and (close >high[1]) then
exitshort size contract at market

ENDIF
Here is the current code with the R1 line as an example.