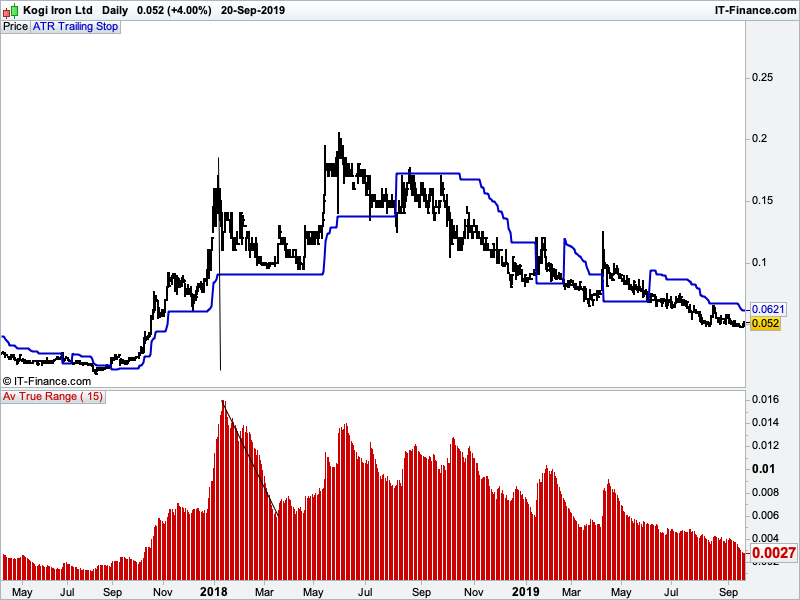
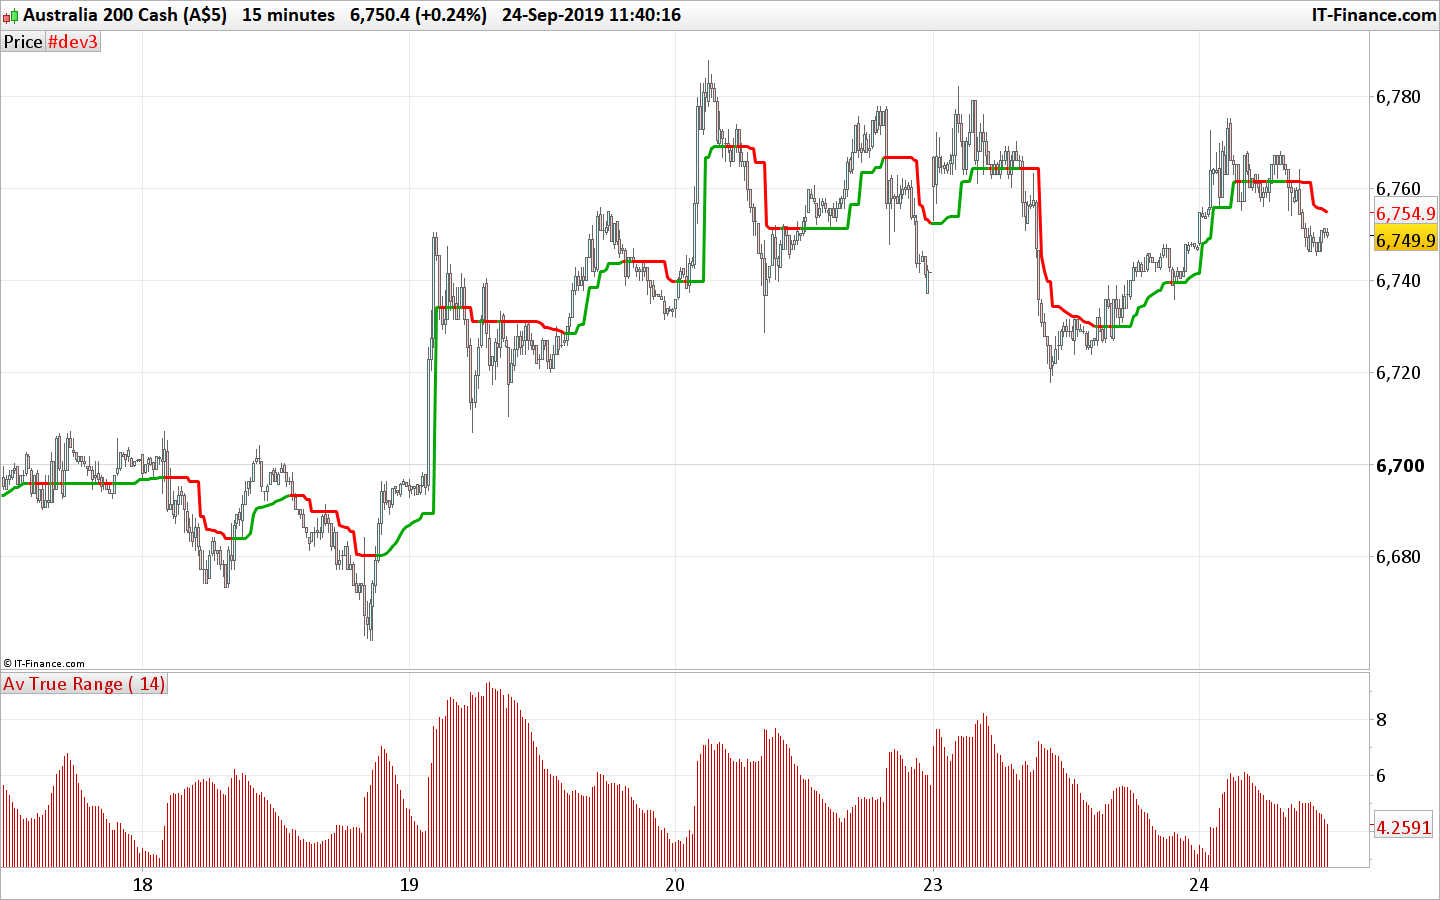
Hi everyone, I have imported the ATR STOP indicator from the library as shown below. It works great although I would like the indicator to move closer to the original stop level if ATR reduces ( but not move further away if ATR increases). In my attached file I have set the trailing stop at 5 x ATR. From the vertical line I have drawn on the chart you can see as ATR reduces, the trailing stop remains horizontal. Can someone produce the code that would ratchet the stoploss closer?
Kind Regards Simon
// Période
p = 14

// Average True Range X
ATRx = AverageTrueRange[p](close) * 3.5

// ATRts = ATR Trailing Stop

// Inversion de tendance
IF close crosses over ATRts THEN
ATRts = close - ATRx
ELSIF close crosses under ATRts THEN
ATRts = close + ATRx
ENDIF

// Cacul de l'ATRts lors de la même tendance
IF close > ATRts THEN
ATRnew = close - ATRx
IF ATRnew > ATRts THEN
ATRts = ATRnew
ENDIF
ELSIF close < ATRts THEN
ATRnew = close + ATRx
IF ATRnew < ATRts THEN
ATRts = ATRnew
ENDIF
ENDIF

return ATRts as "ATR Trailing Stop"
simoncar – Welcome to the forums – please follow the forum rules and always use the ‘Insert PRT Code’ button when posting code to make it easier for others to read. I have tidied up your post for you. 🙂
Hi Vonasi, thanks for the welcome and also for the tidy up.
Regards Simon
You could do something like this. If ATR is lower than the previous bars ATR then the distance calculation is adjusted by a factor from 0.1 to 1. This means that if ATR reduces then the stoploss level moves faster towards price.
// Période
p = 14
factor = 0.7

// Average True Range X
ATRx = AverageTrueRange[p](close) * 3.5

// ATRts = ATR Trailing Stop

// Inversion de tendance
IF close crosses over ATRts THEN
ATRts = close - ATRx
ELSIF close crosses under ATRts THEN
ATRts = close + ATRx
ENDIF

// Cacul de l'ATRts lors de la même tendance
if atrx < atrx[1] then
atrtemp = atrx*factor
else
atrtemp = atrx
endif

IF close > ATRts THEN

ATRnew = close - ATRtemp
IF ATRnew > ATRts THEN
ATRts = ATRnew
ENDIF
endif

IF close < ATRts THEN
ATRnew = close + ATRtemp
IF ATRnew < ATRts THEN
ATRts = ATRnew
ENDIF
endif

return ATRts as "ATR Trailing Stop"
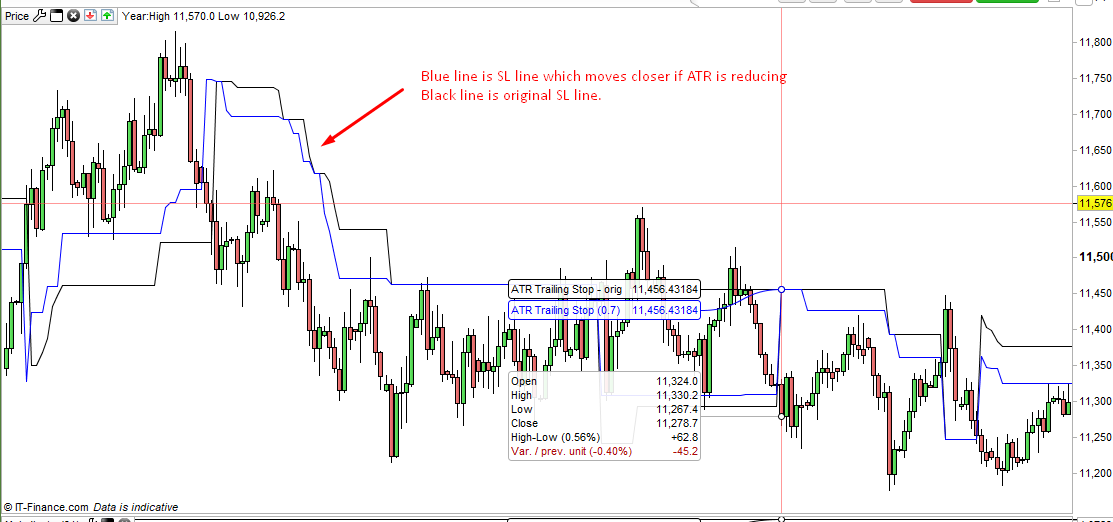
Thanks Vonasi, that looks like exactly what I need. Just noticed on the far right hand side of your attached chart that price breaks down through the trailing stop at around 11,250. Now that the blue and black lines are above the current price, why aren’t they at exactly the same level? Shouldn’t both lines commence at the same point at activation and then the blue line should move closer if ATR reduces?
Cheers Simon
That is because the ATR < ATR[1] adjustment is carried out in the code after the initial calculation of the ATRts value. A simple re-organising of the code fixes this hopefully (not tested).
// Période
p = 14
factor = 0.7

// Average True Range X
ATRx = AverageTrueRange[p](close) * 3.5

// Cacul de l'ATRts lors de la même tendance
if atrx < atrx[1] then
atrtemp = atrx*factor
else
atrtemp = atrx
endif

// ATRts = ATR Trailing Stop
IF close > ATRts THEN
ATRnew = close - ATRtemp
IF ATRnew > ATRts THEN
ATRts = ATRnew
ENDIF
endif

IF close < ATRts THEN
ATRnew = close + ATRtemp
IF ATRnew < ATRts THEN
ATRts = ATRnew
ENDIF
endif

// Inversion de tendance
IF close crosses over ATRts THEN
ATRts = close - ATRx
ELSIF close crosses under ATRts THEN
ATRts = close + ATRx
ENDIF

return ATRts coloured(0,0,255)as "ATR Trailing Stop"
Another way of doing it is to set a flag when the line flips from one side to the other to ensure that no factor is applied at that point.
p = 14
factor = 0.7

ATRx = AverageTrueRange[p](close) * 3.5

IF close crosses over ATRts THEN
ATRts = close - ATRx
flag = 1
ELSIF close crosses under ATRts THEN
ATRts = close + ATRx
flag = 1
ENDIF

if atrx < atrx[1] and not flag then
atrtemp = atrx*factor
flag = 0
else
atrtemp = atrx
flag = 0
endif

IF close > ATRts THEN
ATRnew = close - ATRtemp
IF ATRnew > ATRts THEN
ATRts = ATRnew
ENDIF
endif

IF close < ATRts THEN
ATRnew = close + ATRtemp
IF ATRnew < ATRts THEN
ATRts = ATRnew
ENDIF
endif

return ATRts coloured(0,0,255)as "ATR Trailing Stop"
Note: Code edited 20190923 16:42 as I spotted a cut and paste error!
Thanks for your help Vonasi. Is it possible to code something like this? Basically an ATR based trailing stop for long or short positions that is user adjustable by ATR period and also a multiplier ( just like supertrend). That hangs from the highest/lowest CLOSE. Once price CLOSES below/above the trailing stop value , the trailing stop line flips to be a trailing stop for opposite position. The trailing stop would be calculated and move per time period bar/candle BUT would never move further away from price ONLY move closer to it. Like the green line in the attached image ( how it moves with nearly every bar ). But without the little moves away from the current price. I hope this makes sense.
Regards Simon
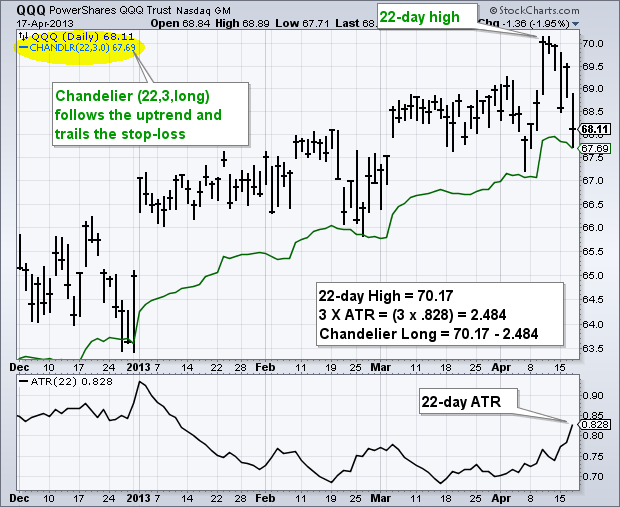
This indicator is the Chandelier exit, here is the explanation and formula:
Formula and Calculations
Chandelier Exits show two lines – the chandelier exit long and the chandelier exit short. The exit long is used to close long positions whereas the exit short is used to close short positions. Therefore, the rule of the indicator is to close long positions when the price goes below the exit long and to close short positions when the price goes above exit short.
The Chandelier long and short are used to compute the value of ATR. Then, using the recommended setting of 22 periods, the Chandelier exit will calculate the highest high or the lowest low for the same period used to calculate ATR. Lastly, subtract the multiple ATR from the figure obtained for the highest high, and add multiple ATR to the value obtained for the lowest low.
The formulas for the two lines are as follows:
Chandelier Exit Long: n-day Highest High – ATR (n) x Multiplier
Chandelier Exit Short: n-day Lowest Low + ATR (n) x Multiplier
Where:
- N is the default unit period of 22 or the number that the trader chooses.
- The multiplier is the default 3.0 Average True Range.
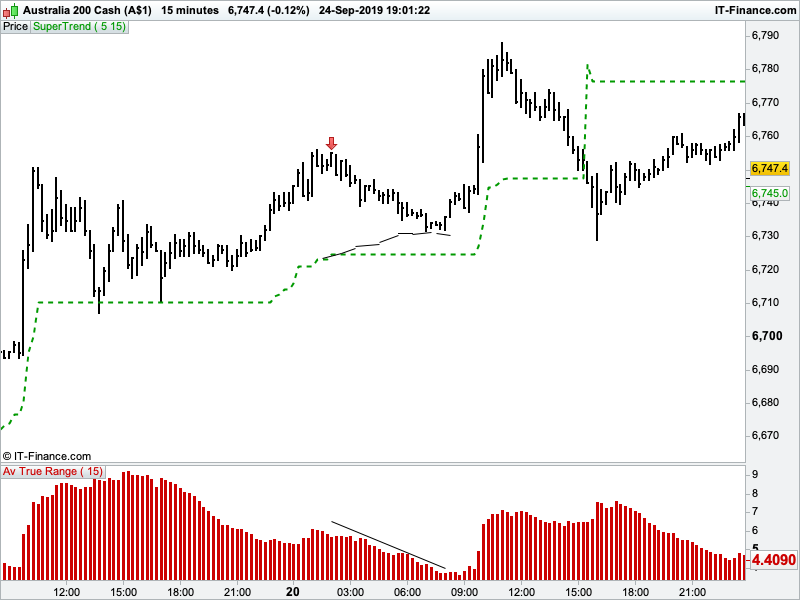
Hi Nicolas, thanks for jumping in to help as well. It’s not the exact Chandelier exit but would act a bit like it. More like the Supertrend indicator. I’m wanting the indicator to hang from the CLOSE rather than the Chandeliers highest high/lowest low. Also to flip after a CLOSE BELOW whereas the Supertrend flips once the trailing value is TOUCHED. The Chandelier exit calculates the highest high or the lowest low for the same period used to calculate ATR. I’m wanting the indicator to do something different. Lets say I’ve got a long trade on and my exit is a close below 2x ATR(15) from the highest close. I’m wanting the indicator to hang 2 x current bars ATR (15) value down from the highest close. I want the trailing stop to move closer to price every single bar that ATR reduces. If ATR increase from one bar to the next, I want the trailing stop line to remain horizontal rather than moving away from price. When price closes 2x ATR(15) below the highest close in the sequence It flips over to be a trailing stop for a short position. The problem I have with current ATR and Chandelier trailing stops is this. The trailing stop line often remains horizontal for certain periods whereas I would like it to tighten up bar by bar ( closer to price) as volatility decreases.
Kind Regards Simon
I’ll add an attachment. Excuse the very crude example. From the red arrow ( highest close in sequence ) the supertrend remains horizontal whilst ATR ( in bottom window ) decreases. My drawn in black line is the trailing stop movement I’m hoping for.
Cheers
Something like this? Note that the trailing stop is not reset to the highest or lowest close once the trend change, but that could be an option?
p=14
mult=2

atr = AverageTrueRange[p](close) * mult

once trend=1
//once ts=close

if close crosses over ts then
trend=1
elsif close crosses under ts then
trend=-1
endif

//ts=ts[1]

if trend=1 then
hh=max(hh,close)
ll=hh
if atr<atr[1] then
hhlevel=hh-atr
if hhlevel>ts then
ts=hhlevel
endif
endif
r=0
g=168
else
ll=min(ll,close)
hh=0
if atr<atr[1] then
lllevel=ll+atr
if lllevel<ts then
ts=lllevel
endif
endif
r=255
g=0
endif


return ts coloured(r,g,0) style(line,3)
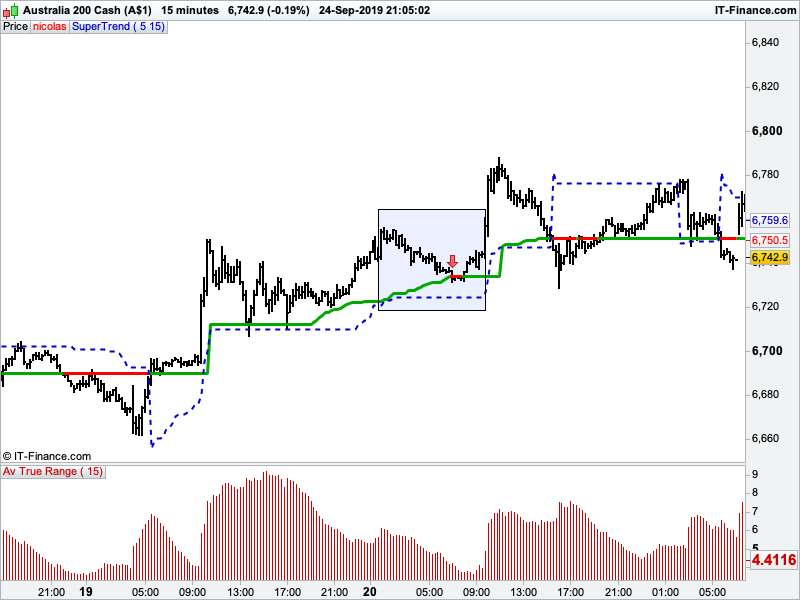
Hi Nicolas, WOW THANKYOU!! I’ve only just studied the blue square area by calculating the ATR (15 ) per bar and it looks great. It creeps closer to price perfectly and exits at the right spot. I set the indicator to 5xATR(15) GREEN and you can see it compared to Supertrend 5/15 BLUE DASHED LINE.
I would love that option of it to reset to the highest/lowest close once the trend changes. I hope its not too much trouble for you.
Many thanks again….the customer support offered by you guys is amazing.
Regards Simon
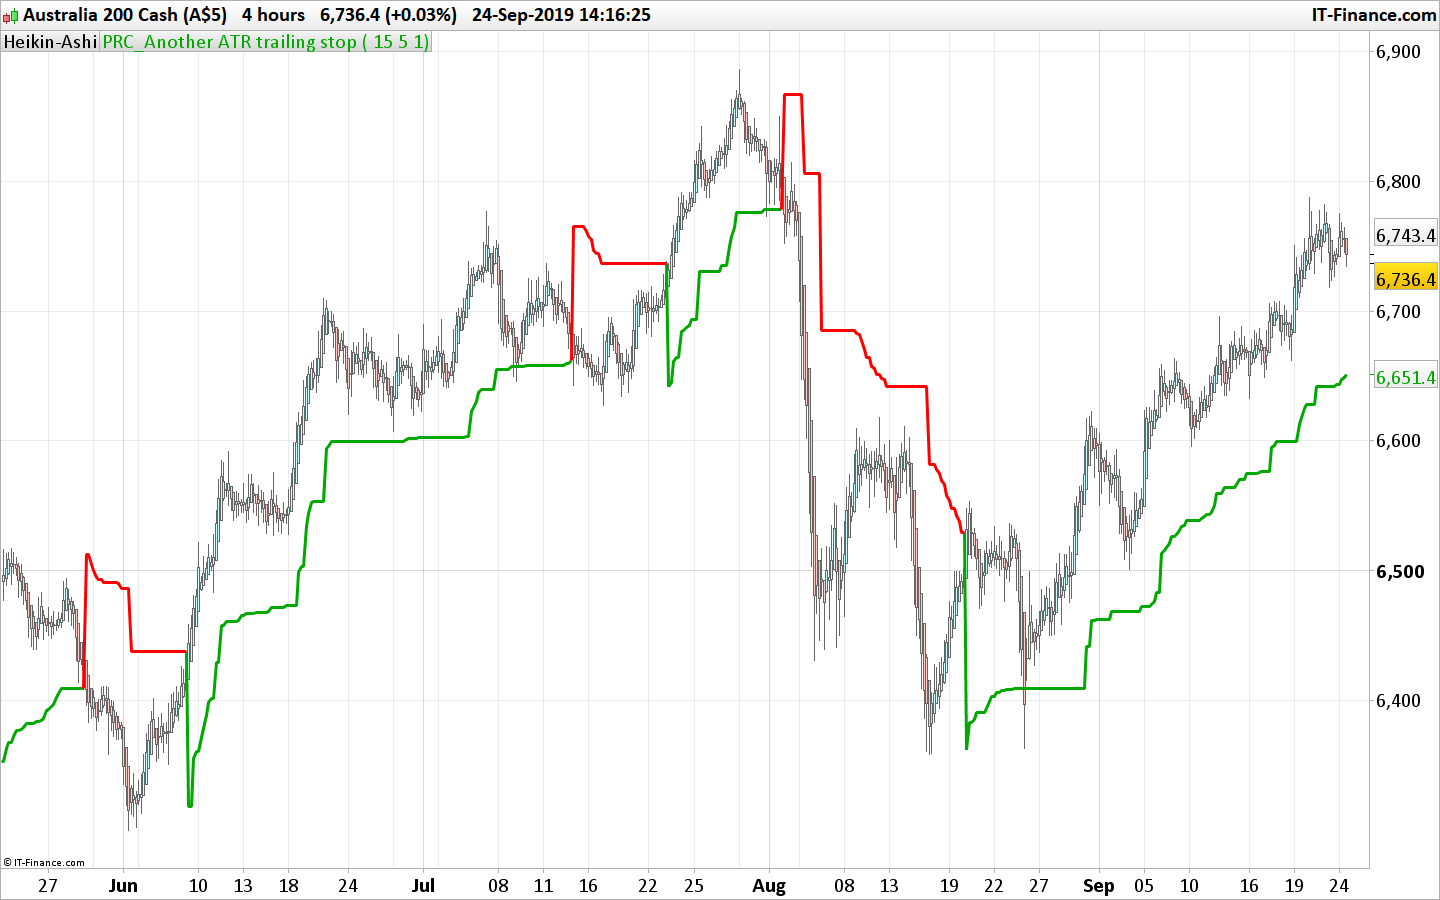
Just added the final version with the 2 different modes in the library, follow the link: Another ATR Trailing Stop
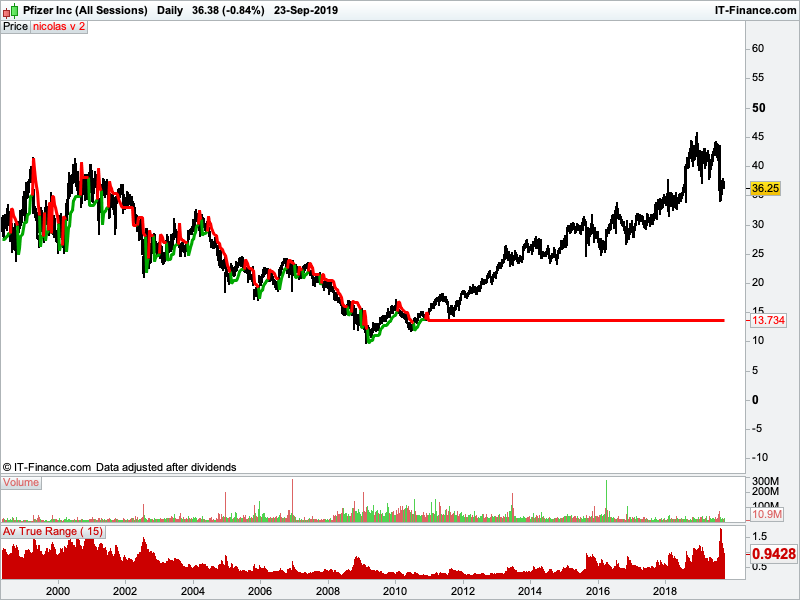
Hi Nicolas, just noticed the indicator is doing some strange things. On some charts its performing perfectly and others a bit weird. See attached chart for an example. Although the same chart on a 60 min timeframe seems fine. Note…. I used parameters 5 and 15.
Regards Simon