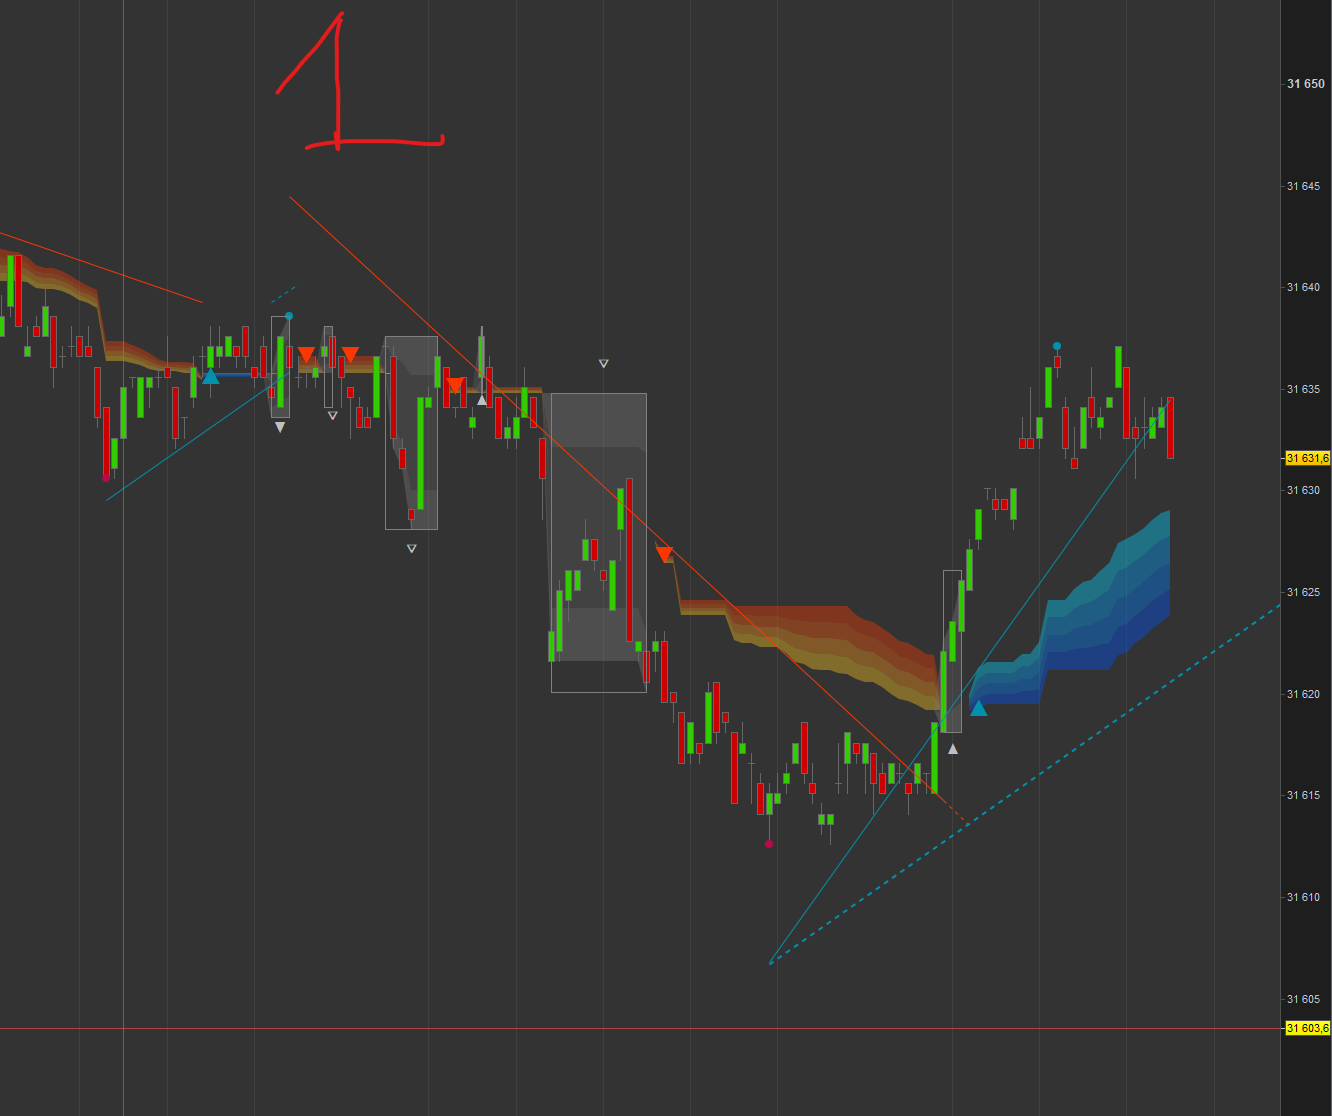
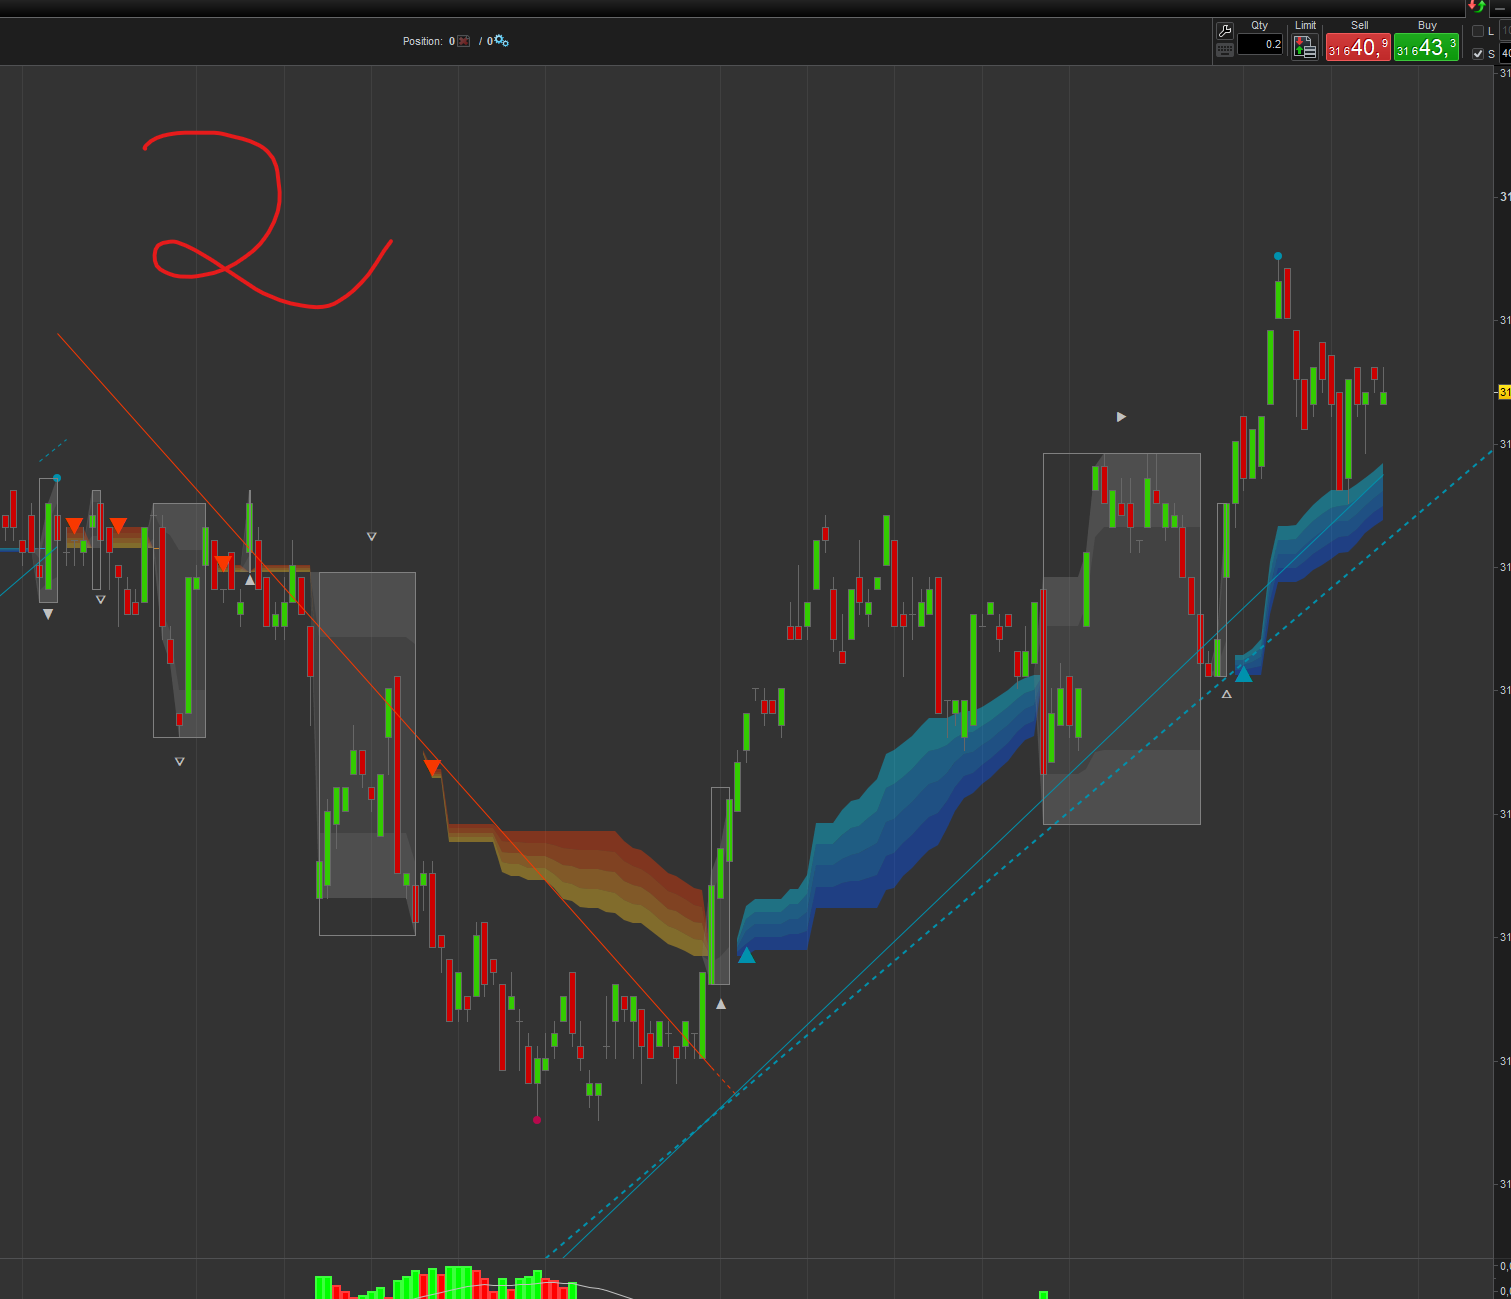
Hi,
Thanks @jonpt88 for having started this post as I am a true believer in transparency and objective product quality; it can only make us better;
@snucke Did you contact me to ask for some clarifications?
I whished I have answered you on these matters before, as you seem to be facing coding difficulties; my clients know I am quite responsive on technical matters and service;
Anyway, I will assume (and hope) then that you are not from the competition and that you were shy enough not to ask me or the community anything;-)
There are many threads talking about the subject though and I thank everybody pushing us to create a better product
TrendDecoder Screener customization
Real Trades with TrendDecoder
Backtests timeframe multiple avec TrendDecoder
On TrendLines
one thing that is very missleading is the trendlines, you cant trade on them really and you cant automate systems based on the crossing of them
- this is not true and you should know it :-), if you got from us our specific code to include the indicator in backtests
- we have created a specific code to trade the crossings with “TrendDecoder_datas”
- You seem to be facing coding difficulties; please ask me ot the community;
Backtests timeframe multiple avec TrendDecoder
Signals, TrailLong, TrailShort = CALL “TrendDecoder_datas”(close)
The 6 values of the variable “Signals” are the following:
// 1 = new uptrend detected
// -1 = new bearish trend detected
// 2 = GreyBOX during uptrend
// -2 = GreyBOX during the downtrend
// 3 = crossing of the Red RealTime TrendLine
// -3 = crossingof the Blue RealTime TrendLine
because they are repainted a bit so when you backtest it will take trades when there actually are no crossing of it.
- this is not precise: either they repaint or not; they cannot repaint “a bit” 😉 here are the facts:
- the Projective TrendLine do not repaint AT ALL as it is fixed and gives us the information of the pace of the last movement (see picture)
- the RealTime TrendLine gives the pace of the current movement; its slope will only change if a new high or a new low appears in the current movement; anyhow this TrendLine will be crossed at some point indicating that the current Trend is OFF;
- we strongly believe this a very relevent tools to detect a change in a Trend but I am very open to consider any other tool you have identified!-)
and it only acts as if it is crossed when its kinda too late to act on it.
- You seem to be facing coding difficulties; please send the code here or write to me so that we can help you;
On FiboLevels
and the Fibo-levels that just got into the indicator is not really working that well,
- this is not factual: please can you show us why on a chart?
does not plot from lowest to highest. maybe an update is coming.
- this is incorrect: as this is precisely their calculation; but maybe not the highs or lows you want;-)
- Logicaly, we take the highest and the lowest of the previous move as the picture shows
other than that its fine, i would guess the “cloud” is just some form of Supertrend.
- this is much better than a SuperTrend that only takes price into consideration based on an ATR that checks if the current price is more advantageous than the previous one;
- its proprietary calculation is based on prices AND volumes to detect ranges = GreyBOX and the Trend of course
At the disposition of the community
Chris