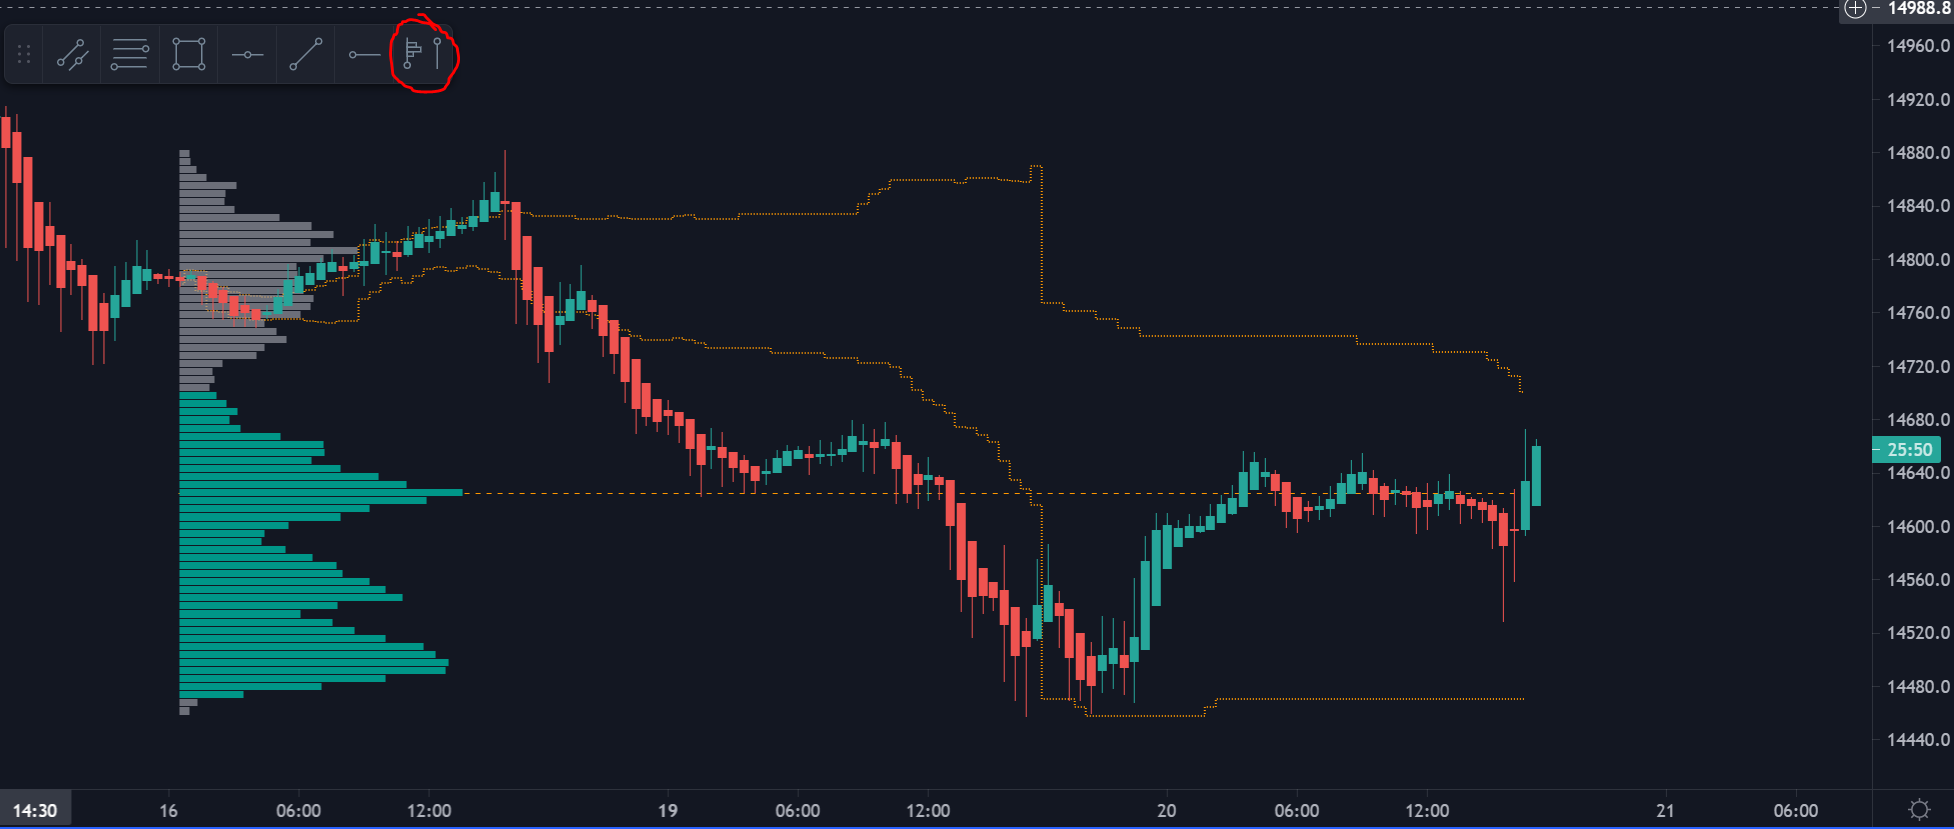
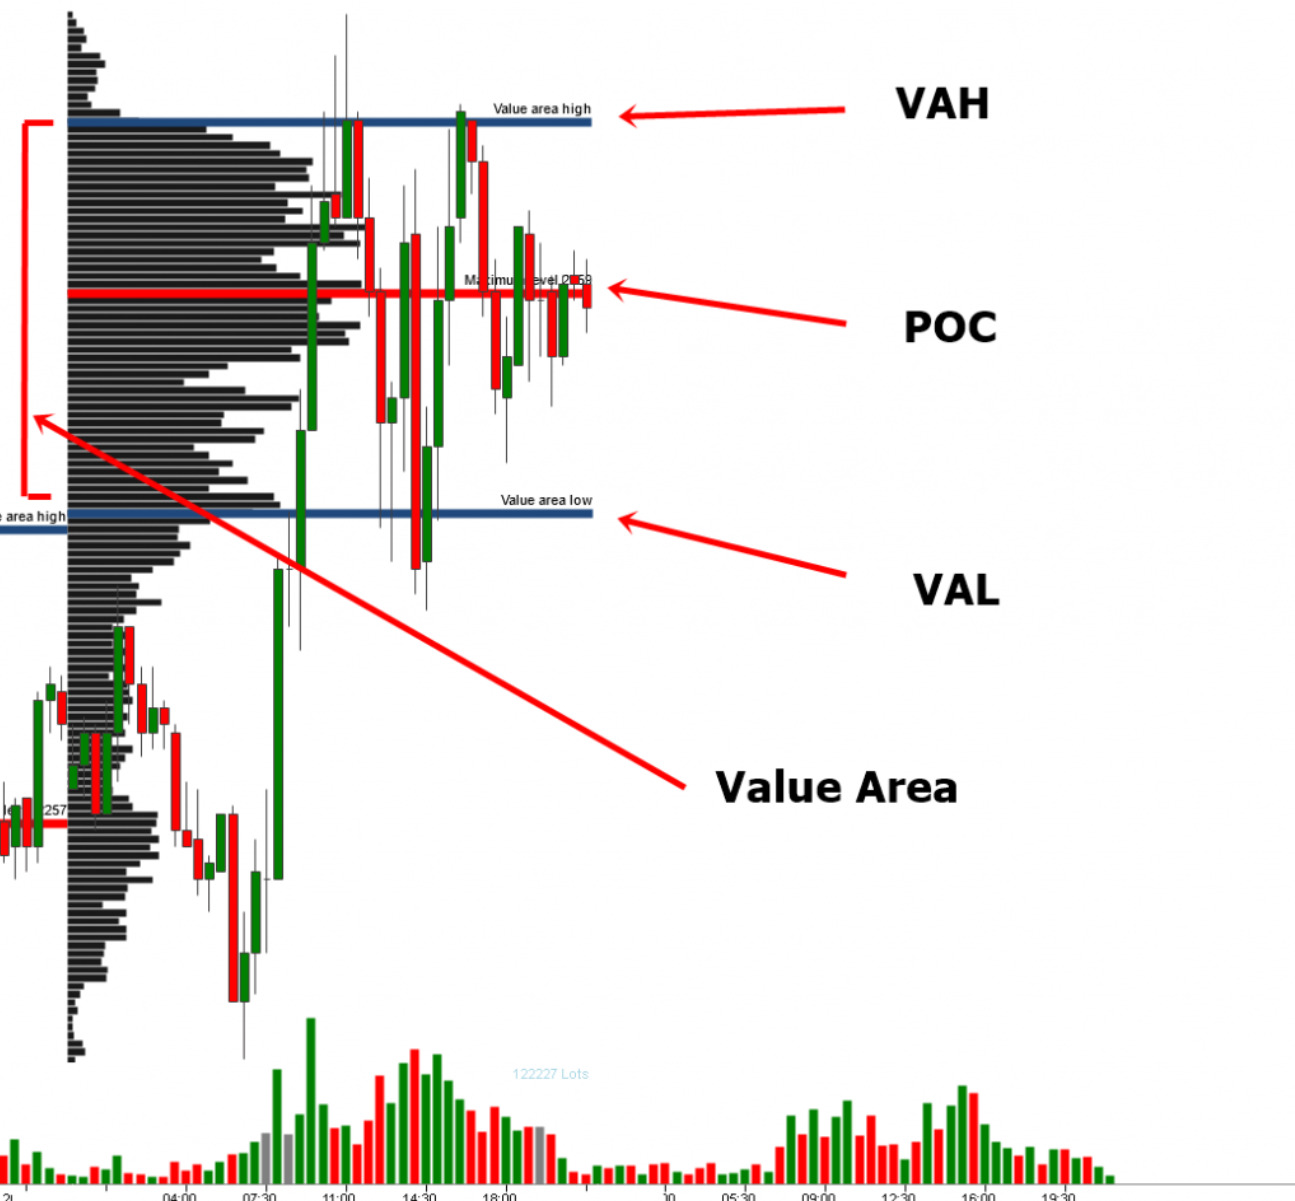
Hello, Since PRT is lacking Volume analysis tool, First I wanted to UP this topic : https://www.prorealcode.com/topic/dynamic-volume-profile/ But the indicator seems to be more a proprietary one and not the original Volume Profile. Yet the features are the same : Value Area and POC (point of control). I’ve attached 2 screenshots. The darker one (anchored on Nasdaq from Monday to Tuesday) The evolving orange lines are the Value Area developping itself along the day. The orange dotted and straight orange line is the POC. The global shape of the left volumes bars are usefull to some people to get in a glance the trading activity of the period. The lighter one is just another exemple on a Daily timeframe and without the eveolving Value Area (VA High and VA Low’s lines will simply move without printing any historic lines)
- Typical levels of significance Point of Control (POC) – The price level for the time period with the highest traded volume. Profile High – The highest reached price level during the specified time period. Profile Low – The lowest reached price level during the specified time period. Value Area (VA) – The range of price levels in which a specified percentage of all volume was traded during the time period. Typically, this percentage is set to 70% however it is up to the trader’s discretion. Value Area High (VAH) – The highest price level within the value area. Value Area Low (VAL) – The lowest price level within the value area.
Calculation - How to Calculate Value Area (VA) 1- Determine the total volume traded in the profile (total buys and sells). 2- Take the number of total buys and sells and multiply it by .7 to determine what number is 70 percent of the total buys and sells. (70% is a typical example however any percentage can be used by the trader). 3- Start at the POC (The row in the profile with the greatest total volume) and record its total volume number. The POC will be the first profile row added to the Value Area. 4- Now look at the two rows above the POC (the initial value area) and add the total volume of both. 5- Now look at the two rows beneath the POC (the initial value area) and add the total volume of both. 6-Determine which of the total volume numbers is larger and add it to the total volume number of the POC found in step 3. 7- Repeat steps 4 and 5 adding the larger of the two numbers to the Value Area. 8- Once the total volume of your Value Area matches or slightly surpasses the number found in step 2, the Value Area has been determined. 9- The highest row within the Value Area will be your Value Area High (VAH) and the lowest row within the Value Area will be your Value Area Low (VAL). Source : TradingView Wiki : https://www.tradingview.com/support/solutions/43000502040-volume-profile/ This is the best accurate and clean code I have found on TradingView:// This source code is subject to the terms of the Mozilla Public License 2.0 at https://mozilla.org/MPL/2.0/
// © LonesomeTheBlue

//@version=4
study("Volume Profile / Fixed Range", overlay = true, max_boxes_count = 200, max_bars_back = 501)
bbars = input(title="Number of Bars", defval = 150, minval = 1, maxval = 500)
cnum = input(title="Row Size", defval = 24, minval = 5, maxval = 100)
percent = input(70., title="Value Area Volume %", minval = 0, maxval = 100)
poc_color = input(defval = #ff0000, title = "POC", inline = "poc")
poc_width = input(defval = 2, title = "", minval = 1, maxval = 5, inline = "poc")
vup_color = input(defval = color.new(color.blue, 30), title = "Value Area Up")
vdown_color = input(defval = color.new(color.orange, 30), title = "Value Area Down")
up_color = input(defval = color.new(color.blue, 75), title = "UP Volume")
down_color = input(defval = color.new(color.orange, 75), title = "Down Volume")

top = highest(bbars)
bot = lowest(bbars)
dist = (top - bot) / 500
step = (top - bot) / cnum

// calculate/keep channel levels
levels = array.new_float(cnum + 1)
for x = 0 to cnum
    array.set(levels, x, bot + step * x)

// get the volume if there is intersection
get_vol(y11, y12, y21, y22, height, vol)=> nz(max(min(max(y11, y12), max(y21, y22)) - max(min(y11, y12), min(y21, y22)), 0) * vol / height)

if barstate.islast
    // calculate/get volume for each channel and candle
    volumes = array.new_float(cnum * 2, 0.)
    for bars = 0 to bbars - 1
        body_top = max(close[bars], open[bars])
        body_bot = min(close[bars], open[bars])
        itsgreen = close[bars] >= open[bars]

        topwick = high[bars] - body_top
        bottomwick = body_bot - low[bars]
        body = body_top - body_bot

        bodyvol = body * volume[bars] / (2 * topwick + 2 * bottomwick + body)
        topwickvol = 2 * topwick * volume[bars] / (2 * topwick + 2 * bottomwick + body)
        bottomwickvol = 2 * bottomwick * volume[bars] / (2 * topwick + 2 * bottomwick + body)
        for x = 0 to cnum - 1
            array.set(volumes, x, array.get(volumes, x) +
                                  (itsgreen ? get_vol(array.get(levels, x), array.get(levels, x + 1), body_bot, body_top, body, bodyvol) : 0) +
                                  get_vol(array.get(levels, x), array.get(levels, x + 1), body_top, high[bars], topwick, topwickvol) / 2 +
                                  get_vol(array.get(levels, x), array.get(levels, x + 1), body_bot, low[bars], bottomwick, bottomwickvol) / 2)
            array.set(volumes, x + cnum, array.get(volumes, x + cnum) +
                                  (itsgreen ? 0 : get_vol(array.get(levels, x), array.get(levels, x + 1), body_bot, body_top, body, bodyvol)) +
                                  get_vol(array.get(levels, x), array.get(levels, x + 1), body_top, high[bars], topwick, topwickvol) / 2 +
                                  get_vol(array.get(levels, x), array.get(levels, x + 1), body_bot, low[bars], bottomwick, bottomwickvol) / 2)

    totalvols = array.new_float(cnum, 0.)
    for x = 0 to cnum - 1
        array.set(totalvols, x, array.get(volumes, x) + array.get(volumes, x + cnum))

    int poc = array.indexof(totalvols, array.max(totalvols))

    // calculate value area
    totalmax = array.sum(totalvols) * percent / 100.
    va_total = array.get(totalvols, poc)
    int up = poc
    int down = poc
    for x = 0 to cnum - 1
        if va_total >= totalmax
            break
        uppervol = up < cnum - 1 ? array.get(totalvols, up + 1) : 0.
        lowervol = down > 0 ? array.get(totalvols, down - 1) : 0.
        if uppervol == 0 and lowervol == 0
            break
        if uppervol >= lowervol
            va_total += uppervol
            up += 1
        else
            va_total += lowervol
            down -= 1

    maxvol = array.max(totalvols)
    for x = 0 to cnum * 2 - 1
        array.set(volumes, x, array.get(volumes, x) * bbars / (3 * maxvol))


    // Draw VP rows
    var vol_bars = array.new_box(cnum * 2, na)
    for x = 0 to cnum - 1
        box.delete(array.get(vol_bars, x))
        box.delete(array.get(vol_bars, x + cnum))
        array.set(vol_bars, x, box.new(bar_index - bbars + 1, array.get(levels, x + 1) - dist,
                                       bar_index - bbars + 1 + round(array.get(volumes, x)), array.get(levels, x) + dist,
                                       border_width = 0,
                                       bgcolor = x >= down and x <= up ? vup_color : up_color))
        array.set(vol_bars, x + cnum, box.new(bar_index - bbars + 1 + round(array.get(volumes, x)), array.get(levels, x + 1) - dist,
                                       bar_index - bbars + 1 + round(array.get(volumes, x)) + round(array.get(volumes, x + cnum)), array.get(levels, x) + dist,
                                       border_width = 0,
                                       bgcolor = x >= down and x <= up ? vdown_color : down_color))

    // Draw POC line
    var line poc_line = na
    line.delete(poc_line)
    poc_line := line.new(bar_index - bbars + 1, (array.get(levels, poc) + array.get(levels, poc + 1)) / 2,
                         bar_index - bbars + 2, (array.get(levels, poc) + array.get(levels, poc + 1)) / 2,
                         extend = extend.right,
                         color = poc_color,
                         width = poc_width)
Quite a long post, I’ve only tried to set everything needed for the comprehension and to avoid time loss in coding trial. Anchored allows everybody to freely use this either on a daily basis or weekly / monthly volumes. Thanks