Hi guys,
I’m trying to learn this part of the analysis of the characteristics of a market and I wanted to know if this is the right section for a comparison with other traders, especially with those who are ahead of me in the path.
In particular, I would like to propose a ProBacktest code that I designed and used to identify time and day bias on Crude Oil (CL – Us Crude 1 euro). With results that I think are interesting.
Can I use this section of the forum?
Thanks.
If it is about an automated strategy then this is the right place. If it is just a general discussion on the subject then it is not.
In reality it is something not so easily classifiable. It is an automatic strategy even if, in my humble opinion, it is not possible to apply it as a proposal. And, at the same time, the thread could face one of the questions concerning the construction of a trading system: the possible presence of hourly and / or daily biases in a market (such as, for example, oil).
Moderators can always move any topic to another forum at any time so keep posting and we can always decide that it is in the wrong place later. 🙂
In the last few days I asked myself the following question: considering the oil market, is there a day of the week when it is preferable to go short? And, similarly, is there a day of the week when it is preferable to go long?
And then, within each of these two days, is there a particular time in which to open the position and, consequently, a time in which to close it?
I then wrote the code indicated and, after the optimization operation, I could see that the best day of the week in which it is preferable to assume a sales position is Monday. And, as regards the purchase position, it is preferable that this is taken on Wednesday.
The optimization operation also took place for the times shown to be those indicated in the code itself.
//Vende il lunedì e compra il mercoledì
//11.09.2019
//Othello
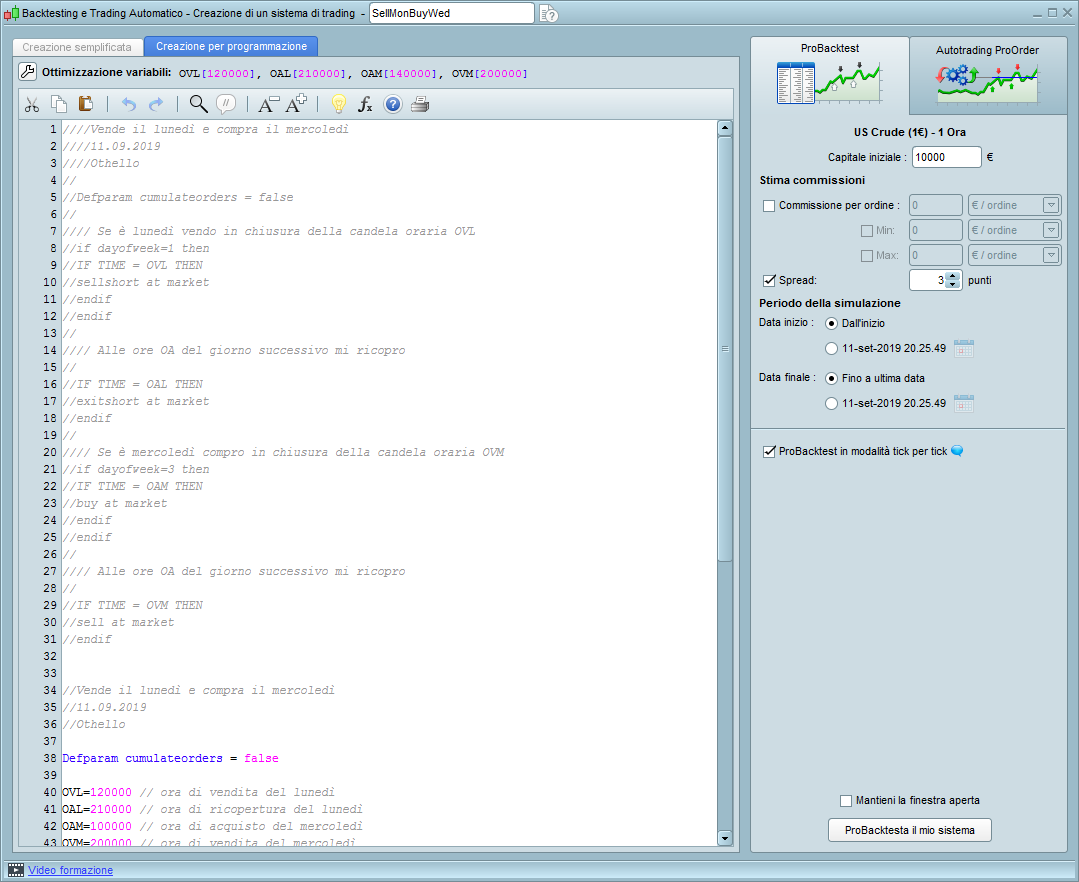
Defparam cumulateorders = false
OVL=120000 // ora di vendita del lunedì
OAL=210000 // ora di ricopertura del lunedì
OAM=140000 // ora di acquisto del mercoledì
OVM=200000 // ora di vendita del mercoledì
// Se è lunedì vendo in chiusura della candela oraria OVL
if dayofweek=1 then
IF TIME = OVL THEN
sellshort at market
endif
endif
// Alle ore OA del giorno successivo mi ricopro
IF TIME = OAL THEN
exitshort at market
endif
// Se è mercoledì compro in chiusura della candela oraria OVM
if dayofweek=3 then
IF TIME = OAM THEN
buy at market
endif
endif
// Alle ore OA del giorno successivo mi ricopro
IF TIME = OVM THEN
sell at market
endif
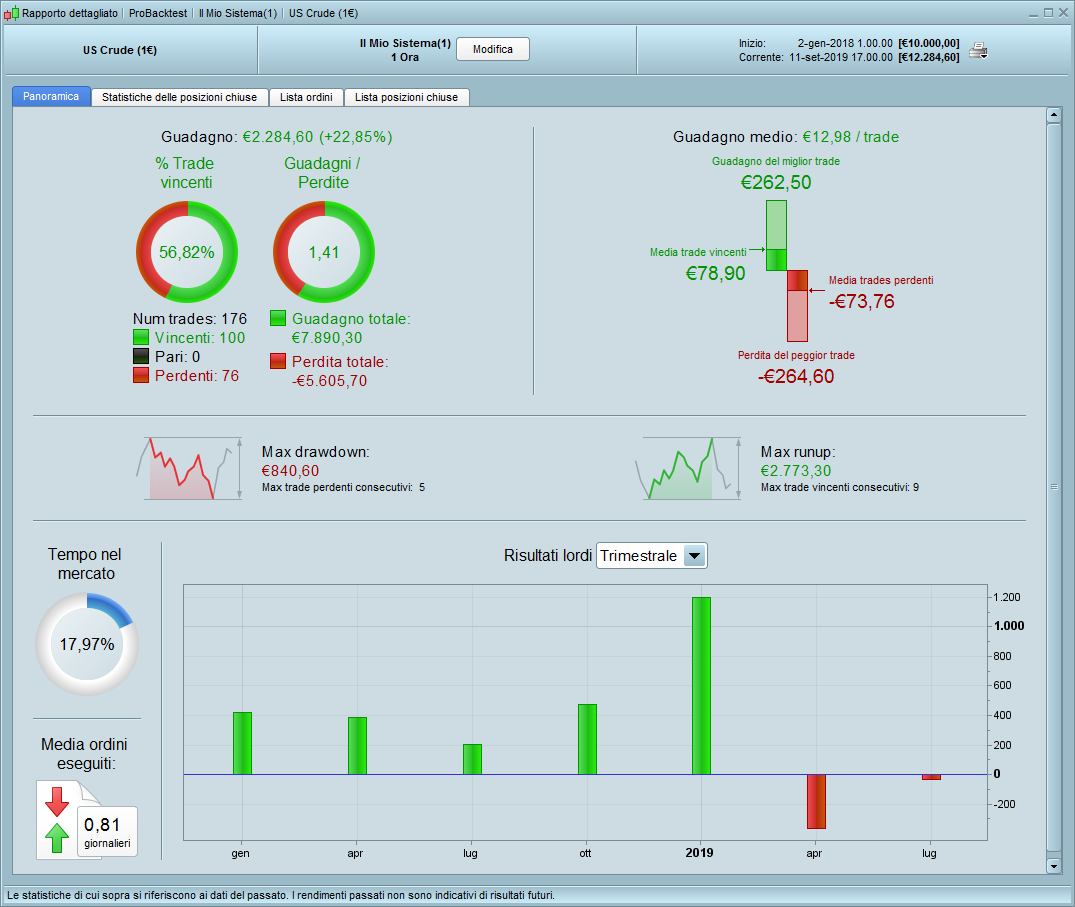
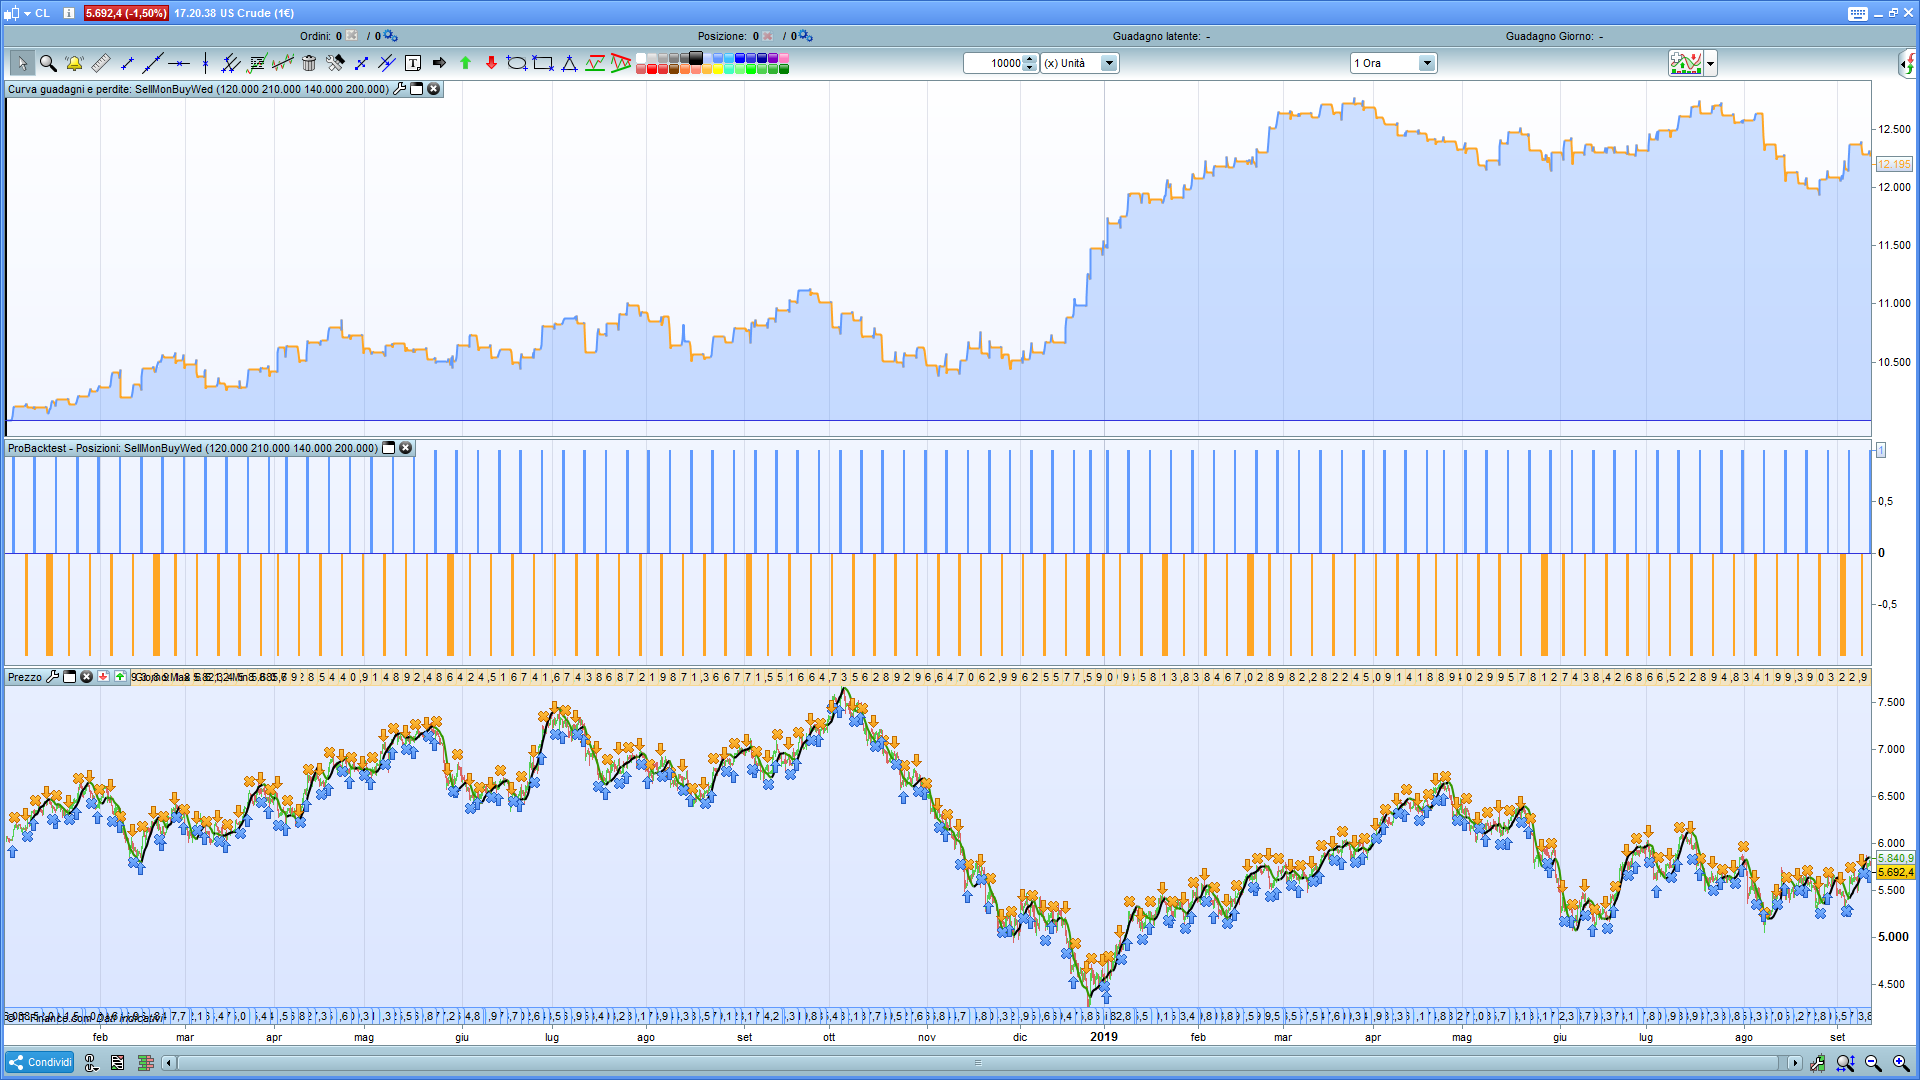
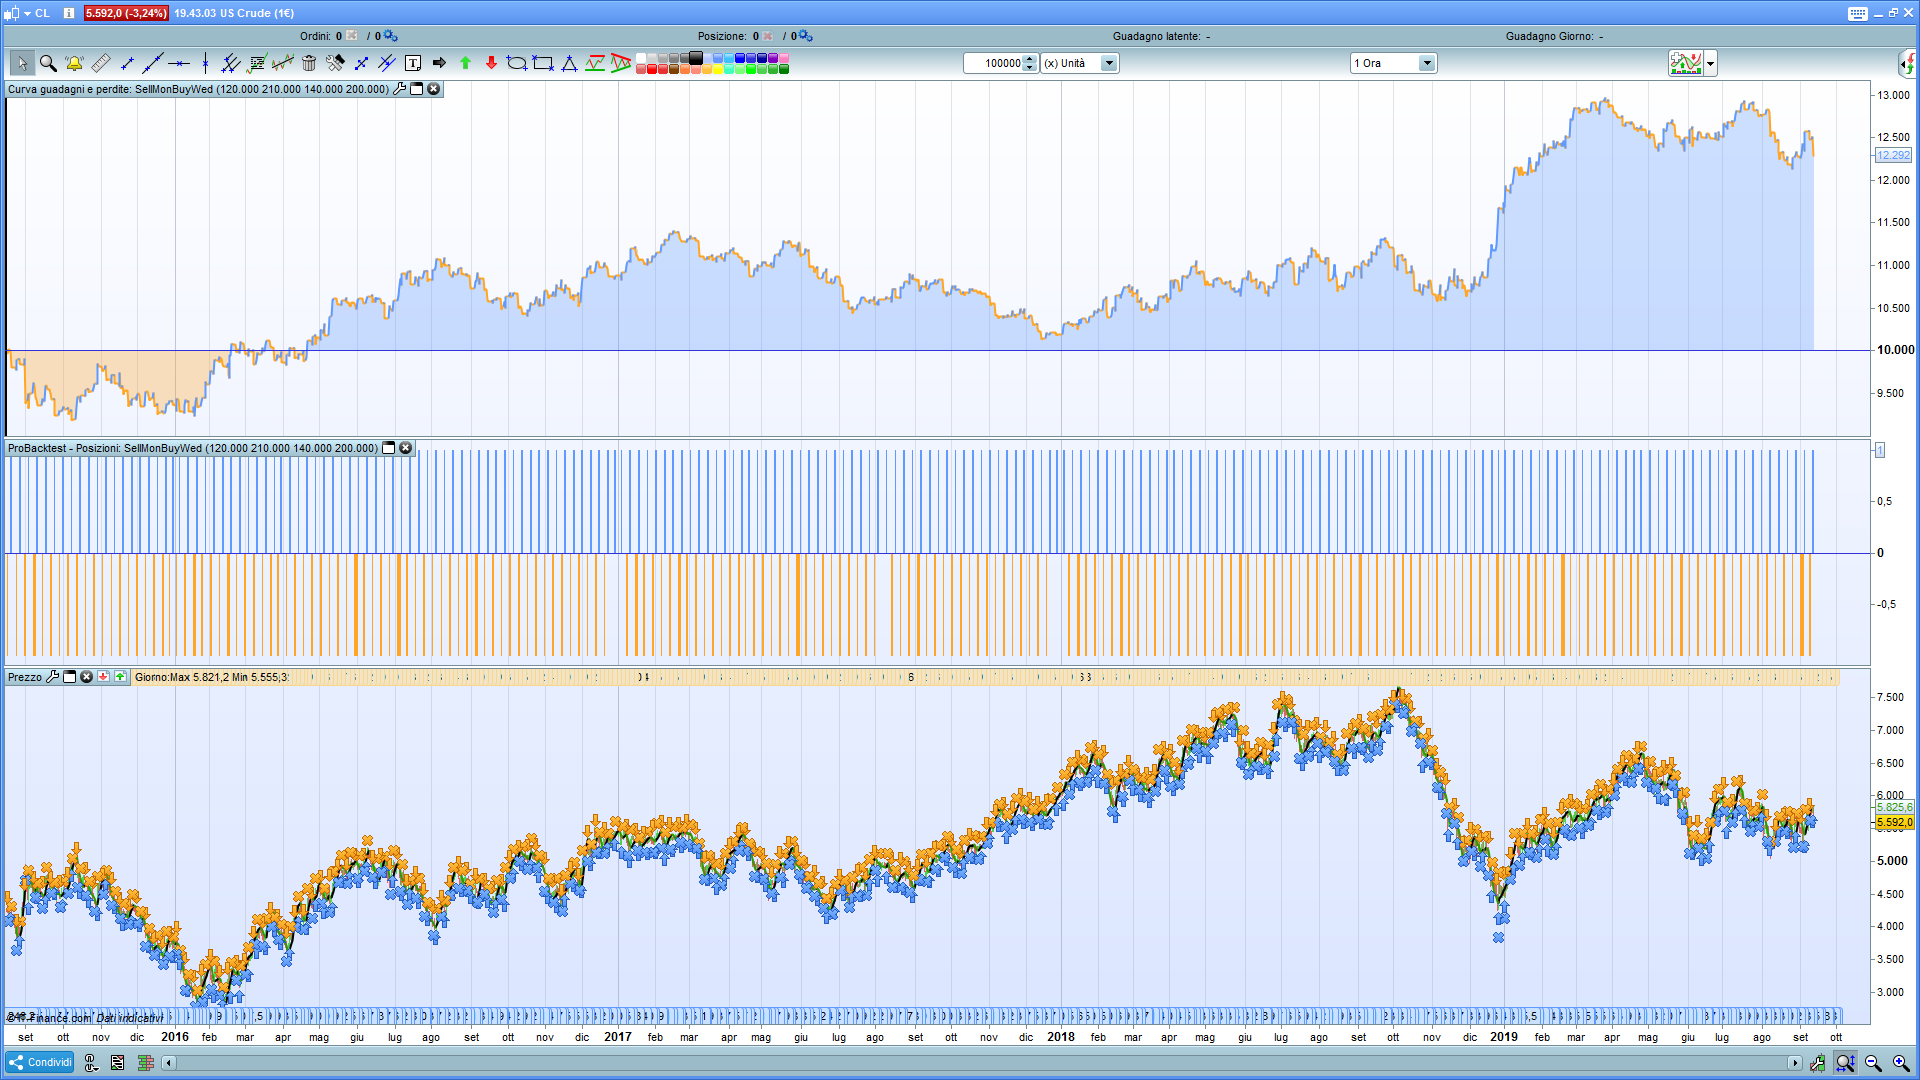
The code is applied to the CL chart (US Crude 1 €) with a timeframe of one hour.
Here I enclose the detailed report and the equity line.
The imposed spread is three points.
The number of transactions, 176, seems to me to be statistically significant.
Of course I’m not saying that this could be a system to put on the market (maybe tomorrow morning).
I believe, however, that it can be a reasonable filter to be integrated into a trading system that trades oil where inputs and outputs could be based on indicators or models of two or more candles.
Opinions on this?
Please don’t take this the wrong way but as soon as somebody says something like ‘if you buy on Mondays at 3pm’ and sell on Thursdays at 7pm’ or anything similar then data mining alarm bells start to go off in my head. Seasonality whether it is monthly, weekly, daily, hourly or minutely can create some fantastic equity curves but you have to have some pretty sound reasoning such as the time being the market open or market close or even lunchtime when a lot of traders are not paying attention otherwise it is really just data mining.
I still find myself playing with seasonality even though I decided ages ago that not much good came from it. Even just recently I was testing to see if holiday season was a good time to be out of the market and I persuaded myself in the end that I was trying to see something that just was not there even if some of the equity curves were fantastic.
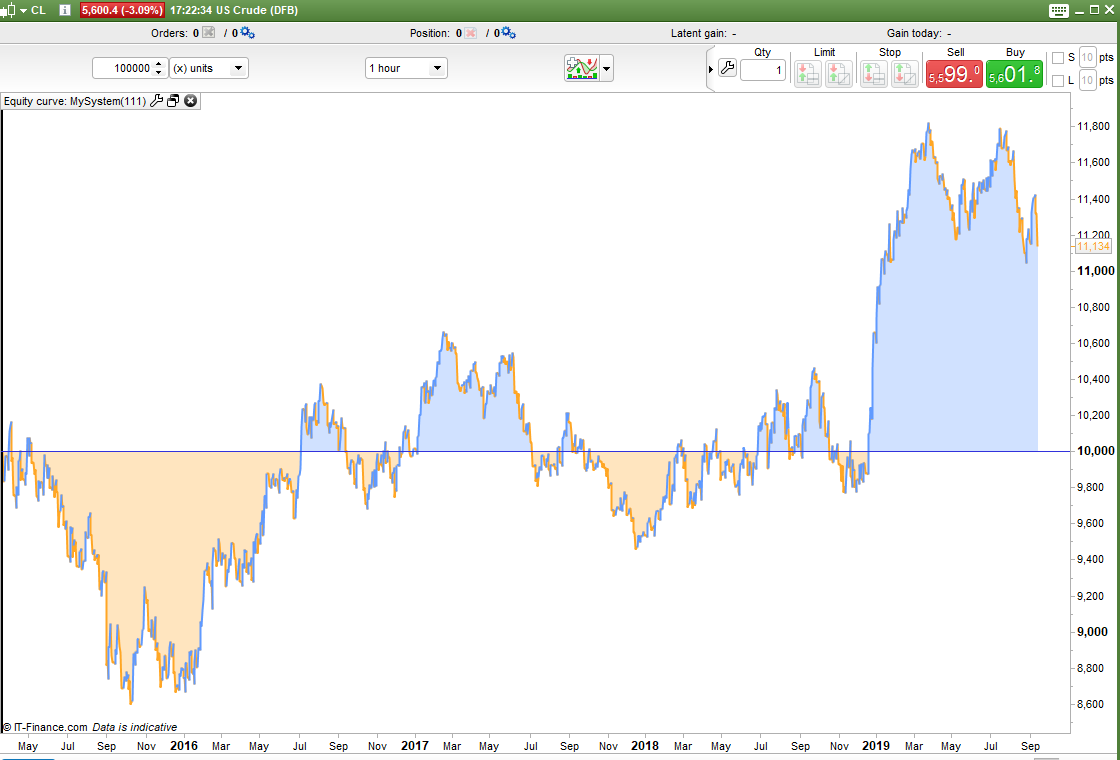
I notice that you are only showing results on 10k bars – have you done the same analysis on 100k bars or even 200k if you have it?
Here is the 100k results!
I think the in sample and out of sample comparison are pretty conclusive I’m afraid.
I thank you for your contribution. Mine was just a way to discuss the “bias” topic.
Thank you also for sharing your experience on this topic and the fact that your studies, at least until now, have not led to anything particularly interesting.
🙂
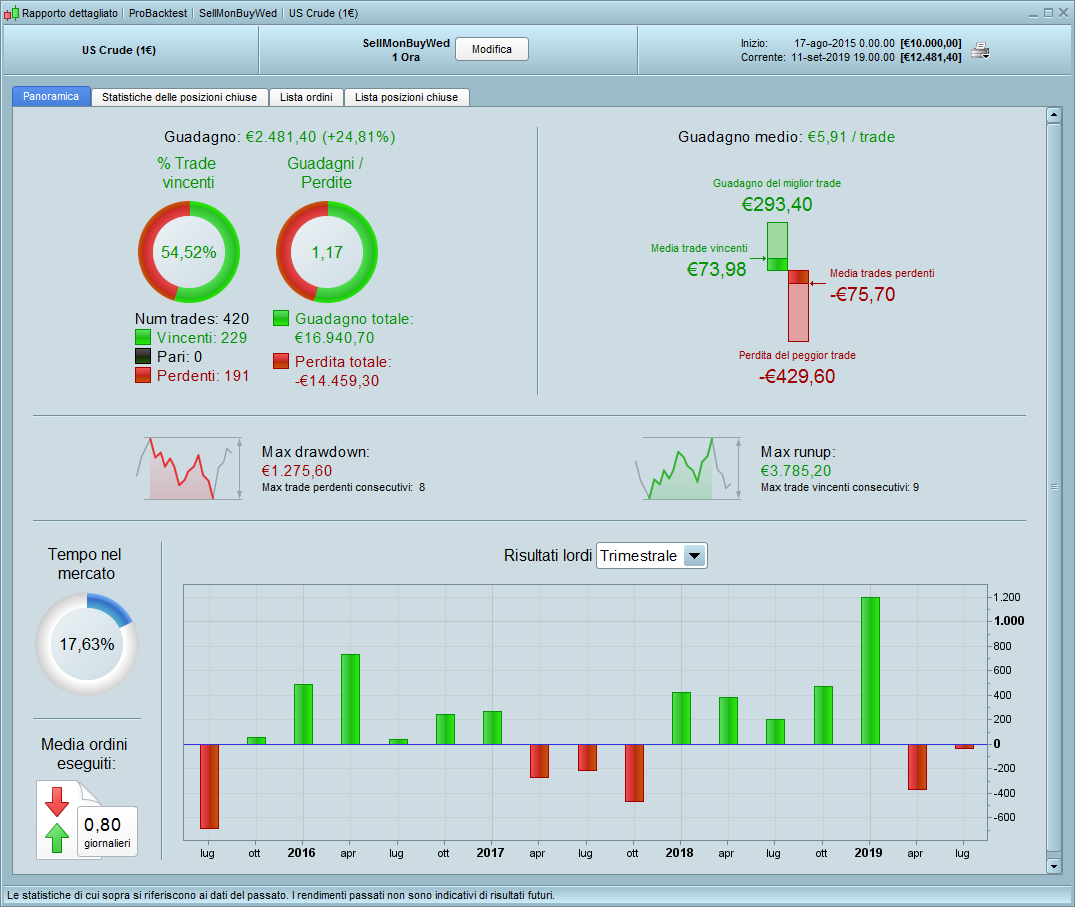
I tried to launch the backtest, with unchanged parameters, on 100,000 hourly units.
These are my results. They seem to me different from yours and, at the moment, I can’t say why.
That’s odd – I did have to change the hours in the code as I work on GMT and I didn’t want to change my chart settings – maybe I messed up!
You don’t have the spread set to 3 in your test which is what you said you had it set to in a previous post..
I checked and took the image of the window where the backtesting parameters are shown, including the spread which, as you see, is 3 points. On the other hand, in the transition from 10,000 units to 100,000 units I had not touched anything.