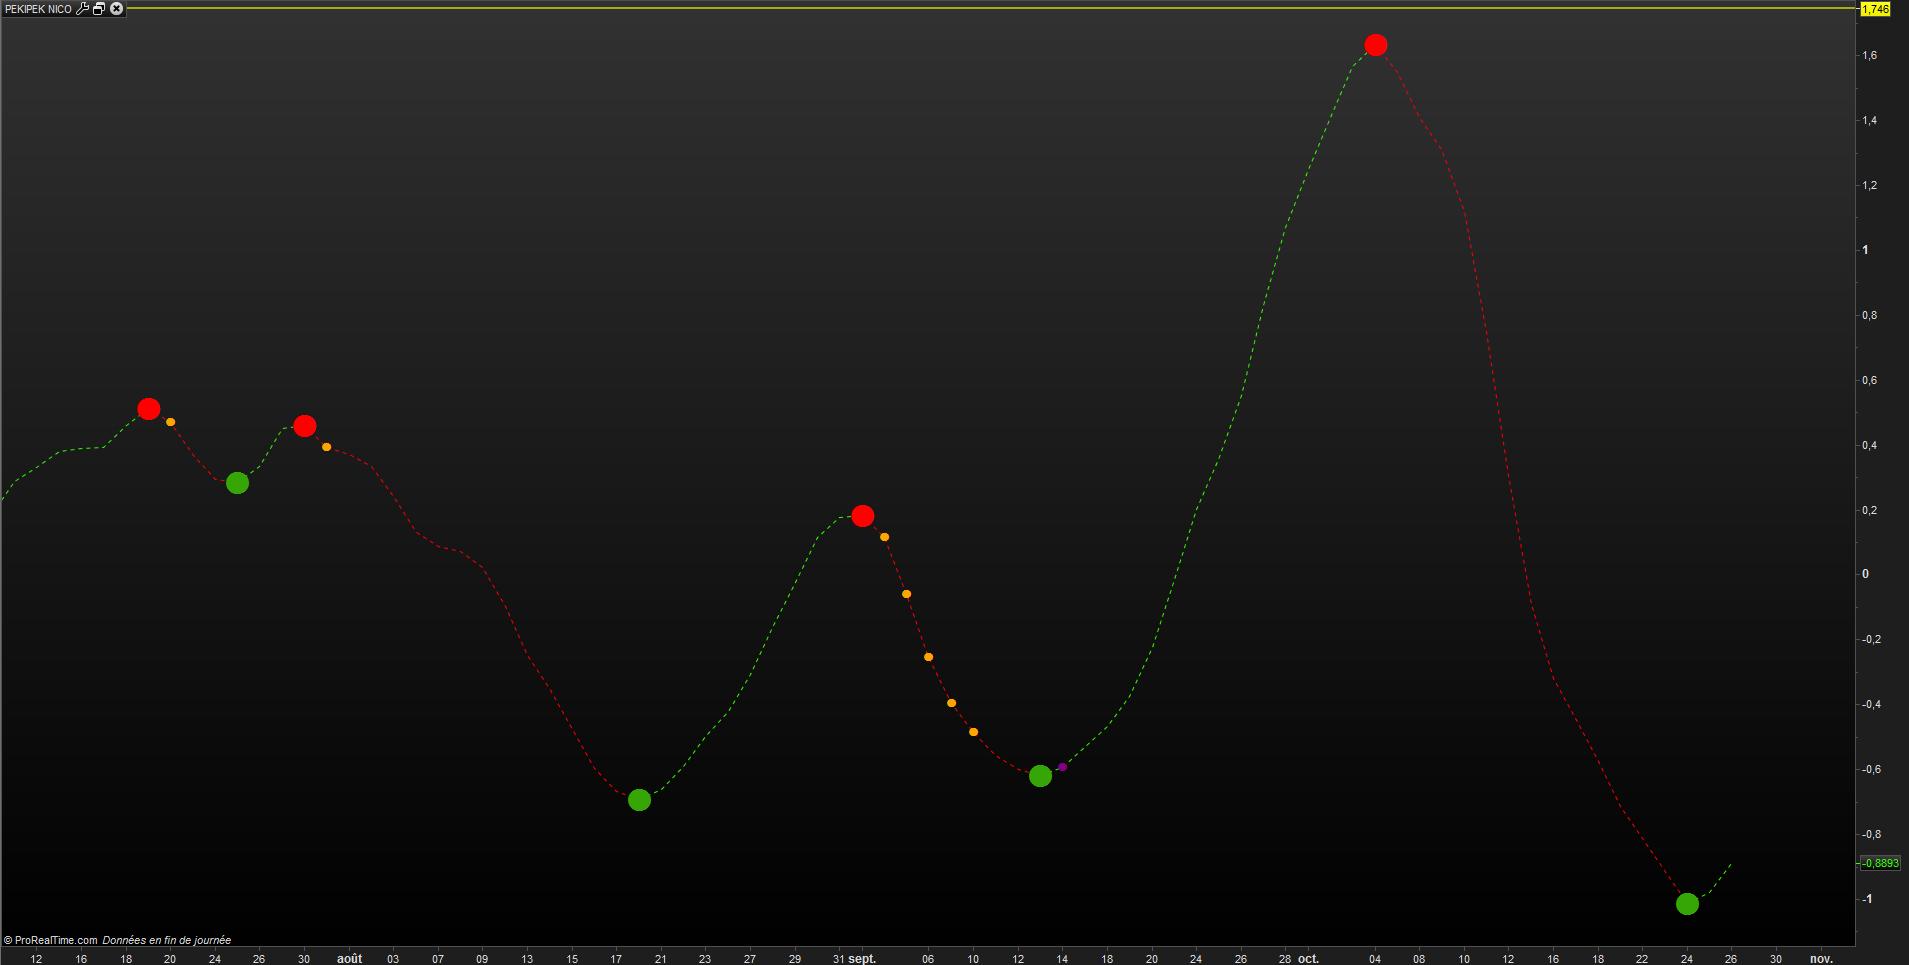
Bonjour à tous , bonjour Nicolas
On a tous sur l’écran du PC un graphe prix et une ribambelle (ou pas) d’indicateurs en fenêtre, bien.
Est-il possible de déclencher une alerte PRT (celle de prorealtime symbolisée par une cloche) lors de l’apparition d’un signal sur un indicateur ?
J’ai pris ici l’exemple du Pekipek codé par Nicolas.
Si ce n’est pas possible en l’état, est-ce que le chef (qui doit avoir l’oreille du bon dieu) pourrait demander à PRT de nous créer un bout de code à cette fin.
Ainsi lors de l’ouverture d’une valeur l’alerte nous dirait que tel signal s’est déclenché sur tel indicateur.
Bonne journée, bons trades.
graphe joint de AIR LIQUIDE
// PEKIPEK NICO PRC  14.09.2018

longtermdiv = 1 //input(true, title="Use long term Divergences?")
divlookbackperiod = 55//input(55, minval=1, title="Lookback Period")
fastLength = 12//input(12, minval=1),
slowLength= 26 //input(26,minval=1)
//signalLength= 9 //input(9,minval=1)
smoother = 2 //input(2,minval=1)

source = customclose

fastMA = average[fastLength,1](source)
slowMA = average[slowLength,1](source)
mmacd = fastMA - slowMA
macd2=(mmacd/slowMA)*100
d = average[smoother](macd2) // smoothing PPO

bullishPrice = low

priceMins = (bullishPrice > bullishPrice[1] and bullishPrice[1] < bullishPrice[2]) or (low[1] = low[2] and low[1] < low and low[1] < low[3]) or (low[1] = low[2] and low[1] = low[3] and low[1] < low and low[1] < low[4]) or (low[1] = low[2] and low[1] = low[3] and low[1] and low[1] = low[4] and low[1] < low and low[1] < low[5]) // this line identifies bottoms and plateaus in the price
oscMins= d > d[1] and d[1] < d[2] // this line identifies bottoms in the PPO

BottomPointsInPPO = oscMins

bearishPrice = high
priceMax = (bearishPrice < bearishPrice[1] and bearishPrice[1] > bearishPrice[2]) or (high[1] = high[2] and high[1] > high and high[1] > high[3]) or( high[1] = high[2] and high[1] = high[3] and high[1] > high and high[1] > high[4]) or (high[1] = high[2] and high[1] = high[3] and high[1] and high[1] = high[4] and high[1] > high and high[1] > high[5])  // this line identifies tops in the price
oscMax = d < d[1] and d[1] > d[2]   // this line identifies tops in the PPO

TopPointsInPPO = oscMax

//avoid loops!
if oscMins then
currenttrough4=d[1] //valuewhen (oscMins, d[1], 0) // identifies the value of PPO at the most recent BOTTOM in the PPO
oscMinsBar = barindex
endif
if oscMax then
currenttrough5=d[1] //valuewhen (oscMax, d[1], 0) // identifies the value of PPO at the most recent TOP in the PPO
oscMaxBar = barindex
endif

if priceMins then
currenttrough6= low[1]//valuewhen (priceMins, low[1], 0) // this line identifies the low (price) at the most recent bottom in the Price
priceMinsBar = barindex
if barindex-oscMinsBar<3 then //=line 47
delayedlow=low[1]
else
delayedlow=0
endif
if priceMins<>priceMins[1] then //=line62
longtermbullfilt=lowest[divlookbackperiod](source)[0]
endif
endif
if priceMax then
priceMaxBar = barindex
currenttrough7= high[1]//valuewhen (priceMax, high[1], 0) // this line identifies the high (price) at the most recent top in the Price
if barindex-oscMaxBar<3 then //=line48
delayedhigh=high[1]
else
delayedhigh=0
endif
if priceMax<>priceMax[1] then //=line63
longtermbearfilt=highest[divlookbackperiod](source)[0]
endif
endif


// only take tops/bottoms in price when tops/bottoms are less than 5 bars away
//filter = barssince(priceMins) < 5 ? lowest(currenttrough6, 4) : na
if barindex-priceMinsBar<5 then
filter = lowest[4](currenttrough6)
else
filter=0
endif
//filter2 = barssince(priceMax) < 5 ? highest(currenttrough7, 4) : na
if barindex-priceMaxBar<5 then
filter2=highest[4](currenttrough7)
else
filter2=0
endif

//delayedbottom/top when oscillator bottom/top is earlier than price bottom/top
//y11 = valuewhen(oscMins, delayedlow, 0)
if oscMins then
//y11=delayedlow
y7=currenttrough4 //=line71
y9 = currenttrough6 //=line74
if oscMins<>oscMins[1] and filter2>0 then
y2=filter2 //=line59
y8=currenttrough4[1] //=line72
endif
endif
//y12 = valuewhen(oscMax, delayedhigh, 0)
if oscMax then
//y12 = delayedhigh
y3=currenttrough5 //=line 65
y10=currenttrough7 //=line75
if oscMax<>oscMax[1] and filter>0 then
y6=filter //=line60
y4=currenttrough5[1] //=line66
endif
endif

// only take tops/bottoms in price when tops/bottoms are less than 5 bars away, since 2nd most recent top/bottom in osc
//y2=0
//y6=0
//for xyz=0 to barindex do
////y2=valuewhen(oscMax, filter2, 1) // identifies the highest high in the tops of price with 5 bar lookback period SINCE the SECOND most recent top in PPO
////y6=valuewhen(oscMins, filter, 1) // identifies the lowest low in the bottoms of price with 5 bar lookback period SINCE the SECOND most recent bottom in PPO
//if filter2[xyz]<>filter2 and filter2>0 then
//y2=filter2[xyz]
//endif
//if filter[xyz]<>filter and filter>0 then
//y6=filter[xyz]
//endif
//if y2>0 and y6>0 then
//break
//endif
//next

//bulldiv= BottomPointsInPPO ? d[1] : na // plots dots at bottoms in the PPO
if BottomPointsInPPo then
drawtext("●",barindex[1],d[1],dialog,bold,30) coloured (54,166,6) // vert foncé(0,255,72) // vert clair
endif
//beardiv= TopPointsInPPO ? d[1]: na // plots dots at tops in the PPO
if TopPointsInPPO then
drawtext("●",barindex[1],d[1],dialog,bold,30) coloured(255,0,0)//rouge
endif

i = currenttrough5 < highest[divlookbackperiod](d) // long term bearish oscilator divergence
i2 = y10 > longtermbearfilt // long term bearish top divergence
i3 = delayedhigh > longtermbearfilt and delayedhigh>0 // long term bearish delayedhigh divergence

i4 = currenttrough4 > lowest[divlookbackperiod](d) // long term bullish osc divergence
i5 = y9 < longtermbullfilt // long term bullish bottom div
i6 = delayedlow < longtermbullfilt and delayedlow>0// long term bullish delayedbottom div

//plot(y10>y2 and oscMax and y3 < y4 ? d :na, title = "Bearish Divergence2", color=orange, style= circles, linewidth=4)
if y10>y2 and oscMax and y3 < y4 then
drawtext("●",barindex,d,dialog,bold,10) coloured(255,165,0)
endif
//plot(y9<y6 and oscMins and y7 > y8 ? d :na, title = "Bullish Divergence2", color=purple, style=circles, linewidth=4)
if y9<y6 and oscMins and y7 > y8 then
drawtext("●",barindex,d,dialog,bold,10) coloured(128,0,128)
endif
//plot(delayedlow<y6 and y7 > y8 ? d :na, title = "Bullish Divergence2", color=purple, style=circles, linewidth=4)
if delayedlow<y6 and y7 > y8 and delayedlow>0 then
drawtext("●",barindex,d,dialog,bold,10) coloured(128,0,128)
endif
//plot(delayedhigh>y2 and y3 < y4 ? d :na, title = "Bearish Divergence2", color=orange, style= circles, linewidth=4)
if delayedhigh>y2 and y3 < y4 and delayedhigh>0 then
drawtext("●",barindex,d,dialog,bold,10) coloured(255,165,0)
endif

//plot(long_term_div and oscMax and i and i2 ? d :na, title = "Bearish Divergence2", color=orange, style= circles, linewidth=4)
if longtermdiv and oscMax and i and i2 then
drawtext("●",barindex,d,dialog,bold,10) coloured(255,165,0)
endif
//plot(long_term_div and oscMins and i4 and i5 ? d : na, title = "Bullish Divergence2", color=purple, style=circles, linewidth=4)
if longtermdiv and oscMins and i4 and i5 then
drawtext("●",barindex,d,dialog,bold,10) coloured(128,0,128)
endif
//plot(long_term_div and i and i3 ? d :na, title = "Bearish Divergence2", color=orange, style= circles, linewidth=4)
if longtermdiv and i and i3 then
drawtext("●",barindex,d,dialog,bold,10) coloured(255,165,0)
endif
//plot(long_term_div and i4 and i6 ? d : na, title = "Bullish Divergence2", color=purple, style=circles, linewidth=4)
if longtermdiv and i4 and i6 then
drawtext("●",barindex,d,dialog,bold,10) coloured(128,0,128)
endif

return d  as "ppo"