Indicateur OBV ProRealTime : ajout de divergences

Viewing 2 posts - 1 through 2 (of 2 total)
  • Author
    Posts
  • #236540 quote
    Armand2020
    Participant
    Senior

    Bonjour serait il possible d ajouter  les divergence sur cet indicateur et sur le prix directement aussi?

    https://www.prorealcode.com/prorealtime-indicators/on-balance-volume-oscillator/

    #260073 quote
    Nicolas
    Keymaster
    Legend

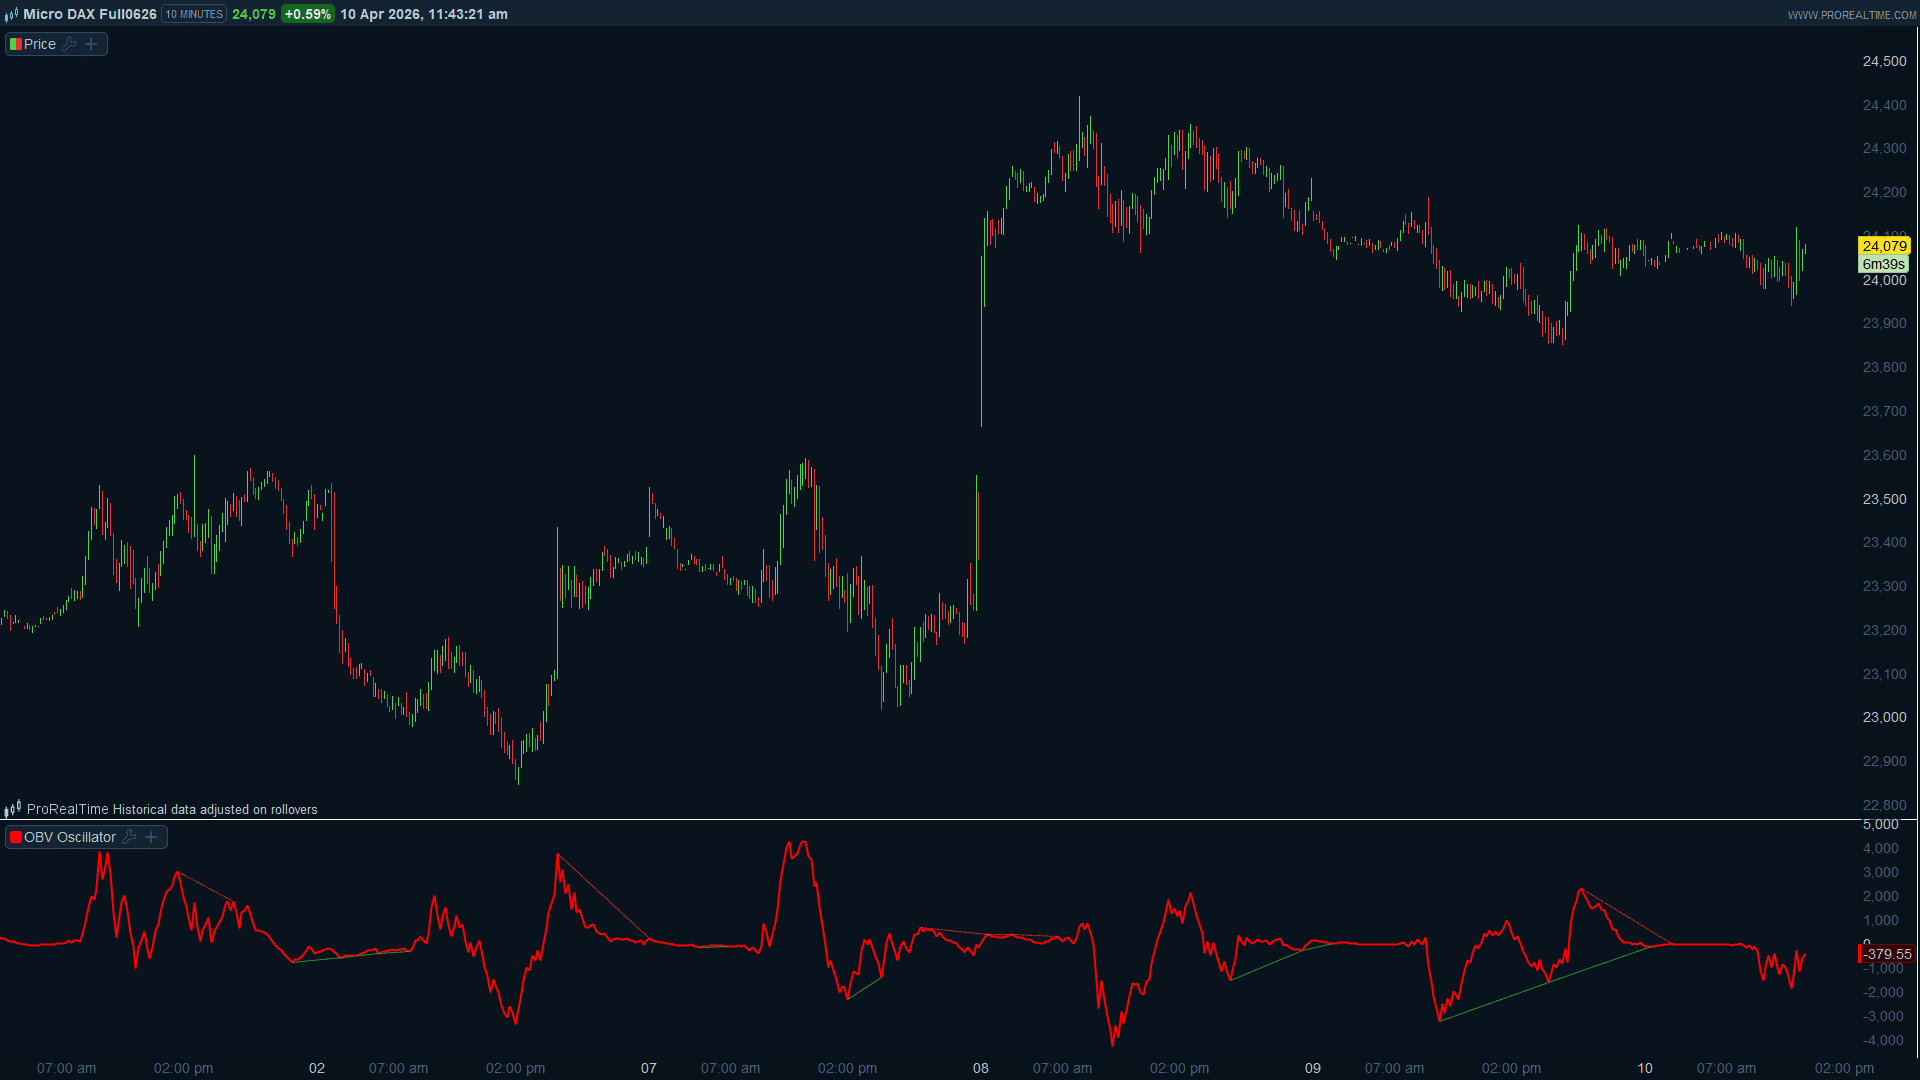
    Voici le code complet. Il ajoute deux types de divergences : des segments tracés dans le panneau de l’oscillateur OBV, et des segments tracés directement sur le graphique des prix. Les pivots sont détectés avec une fenêtre symétrique paramétrable (PivotBars de chaque côté).

    // OBV Oscillator with Divergences
    Periods   = 20
    PivotBars = 5
    
    
    Periods   = max(1, min(999, Periods))
    PivotBars = max(2, min(20, PivotBars))
    
    
    // --- OBV Oscillator ---
    MyOBV = OBV(close)
    Sma   = Average[Periods, 0](MyOBV)
    Diff  = MyOBV - Sma
    
    
    // --- Pivot detection sur l'oscillateur OBV ---
    // Un pivot haut : Diff[PivotBars] est le max sur la fenêtre 2*PivotBars+1 bougies
    isPivotHighOBV = Diff[PivotBars] = Highest[2*PivotBars+1](Diff)
    isPivotLowOBV  = Diff[PivotBars] = Lowest[2*PivotBars+1](Diff)
    
    
    // --- Pivot detection sur le prix ---
    isPivotHighPrice = close[PivotBars] = Highest[2*PivotBars+1](close)
    isPivotLowPrice  = close[PivotBars] = Lowest[2*PivotBars+1](close)
    
    
    // --- Recherche du pivot précédent sur l'OBV ---
    prevOBVHighVal = 0
    prevOBVHighBar = 0
    prevOBVLowVal  = 0
    prevOBVLowBar  = 0
    
    
    for i = PivotBars+1 to PivotBars+50
        if Diff[i] = Highest[2*PivotBars+1](Diff[i-PivotBars]) and prevOBVHighBar = 0 then
            prevOBVHighVal = Diff[i]
            prevOBVHighBar = barindex[i]
        endif
        if Diff[i] = Lowest[2*PivotBars+1](Diff[i-PivotBars]) and prevOBVLowBar = 0 then
            prevOBVLowVal = Diff[i]
            prevOBVLowBar = barindex[i]
        endif
    next
    
    
    // --- Recherche du pivot précédent sur le prix ---
    prevPriceHighVal = 0
    prevPriceHighBar = 0
    prevPriceLowVal  = 0
    prevPriceLowBar  = 0
    
    
    for j = PivotBars+1 to PivotBars+50
        if close[j] = Highest[2*PivotBars+1](close[j-PivotBars]) and prevPriceHighBar = 0 then
            prevPriceHighVal = close[j]
            prevPriceHighBar = barindex[j]
        endif
        if close[j] = Lowest[2*PivotBars+1](close[j-PivotBars]) and prevPriceLowBar = 0 then
            prevPriceLowVal = close[j]
            prevPriceLowBar = barindex[j]
        endif
    next
    
    
    // --- Divergences sur l'oscillateur OBV ---
    // Bearish : le prix fait un plus haut, l'OBV fait un plus bas haut
    bearDivOBV = isPivotHighOBV and prevOBVHighBar > 0 and close[PivotBars] > prevPriceHighVal and Diff[PivotBars] < prevOBVHighVal
    
    
    // Bullish : le prix fait un plus bas, l'OBV fait un plus haut bas
    bullDivOBV = isPivotLowOBV and prevOBVLowBar > 0 and close[PivotBars] < prevPriceLowVal and Diff[PivotBars] > prevOBVLowVal
    
    
    // --- Divergences sur le prix ---
    bearDivPrice = isPivotHighPrice and prevPriceHighBar > 0 and close[PivotBars] > prevPriceHighVal and Diff[PivotBars] < prevOBVHighVal
    bullDivPrice = isPivotLowPrice  and prevPriceLowBar  > 0 and close[PivotBars] < prevPriceLowVal  and Diff[PivotBars] > prevOBVLowVal
    
    
    // --- Tracé des divergences dans le panneau OBV ---
    if bearDivOBV then
        DRAWSEGMENT(prevOBVHighBar, prevOBVHighVal, barindex[PivotBars], Diff[PivotBars]) COLOURED(220, 50, 50, 200)
    endif
    if bullDivOBV then
        DRAWSEGMENT(prevOBVLowBar, prevOBVLowVal, barindex[PivotBars], Diff[PivotBars]) COLOURED(50, 180, 50, 200)
    endif
    
    
    // --- Tracé des divergences sur le graphique des prix ---
    if bearDivPrice then
        DRAWSEGMENT(prevPriceHighBar, prevPriceHighVal, barindex[PivotBars], close[PivotBars]) COLOURED(220, 50, 50, 200)
    endif
    if bullDivPrice then
        DRAWSEGMENT(prevPriceLowBar, prevPriceLowVal, barindex[PivotBars], close[PivotBars]) COLOURED(50, 180, 50, 200)
    endif
    
    
    RETURN Diff AS "OBV Oscillator"
    

    Quelques points importants sur le fonctionnement :

    • PivotBars contrôle la sensibilité des pivots. Avec 5, il faut 5 bougies de chaque côté pour confirmer un sommet ou un creux. Plus la valeur est grande, plus les pivots sont rares et significatifs.
    • Les segments rouges signalent une divergence baissière (prix en hausse, OBV en baisse), les segments verts une divergence haussière (prix en baisse, OBV en hausse).
    • Les segments dans le panneau OBV relient les deux sommets/creux de l’oscillateur. Les segments sur le graphique des prix relient les deux sommets/creux de prix correspondants. Cela permet de visualiser la divergence des deux côtés simultanément.
    • La détection étant confirmée avec un décalage de PivotBars bougies, les signaux apparaissent légèrement en retard par rapport au pivot réel, ce qui est inévitable pour toute détection propre de pivot.
    obv-divergences-indicator.png obv-divergences-indicator.png
Viewing 2 posts - 1 through 2 (of 2 total)
  • You must be logged in to reply to this topic.

Indicateur OBV ProRealTime : ajout de divergences


ProOrder : Trading Automatique & Backtests

New Reply
Author
author-avatar
Armand2020 @armand2020 Participant
Summary

This topic contains 1 reply,
has 2 voices, and was last updated by Nicolas

1 month, 2 weeks ago.

Topic Details
Forum: ProOrder : Trading Automatique & Backtests
Language: French
Started: 08/20/2024
Status: Active
Attachments: 1 files
Logo Logo
Loading...