MTF MM dashbord

Viewing 1 post (of 1 total)
  • Author
    Posts
  • #263052 quote
    Bernard13
    Participant
    Senior

    Bonjour,

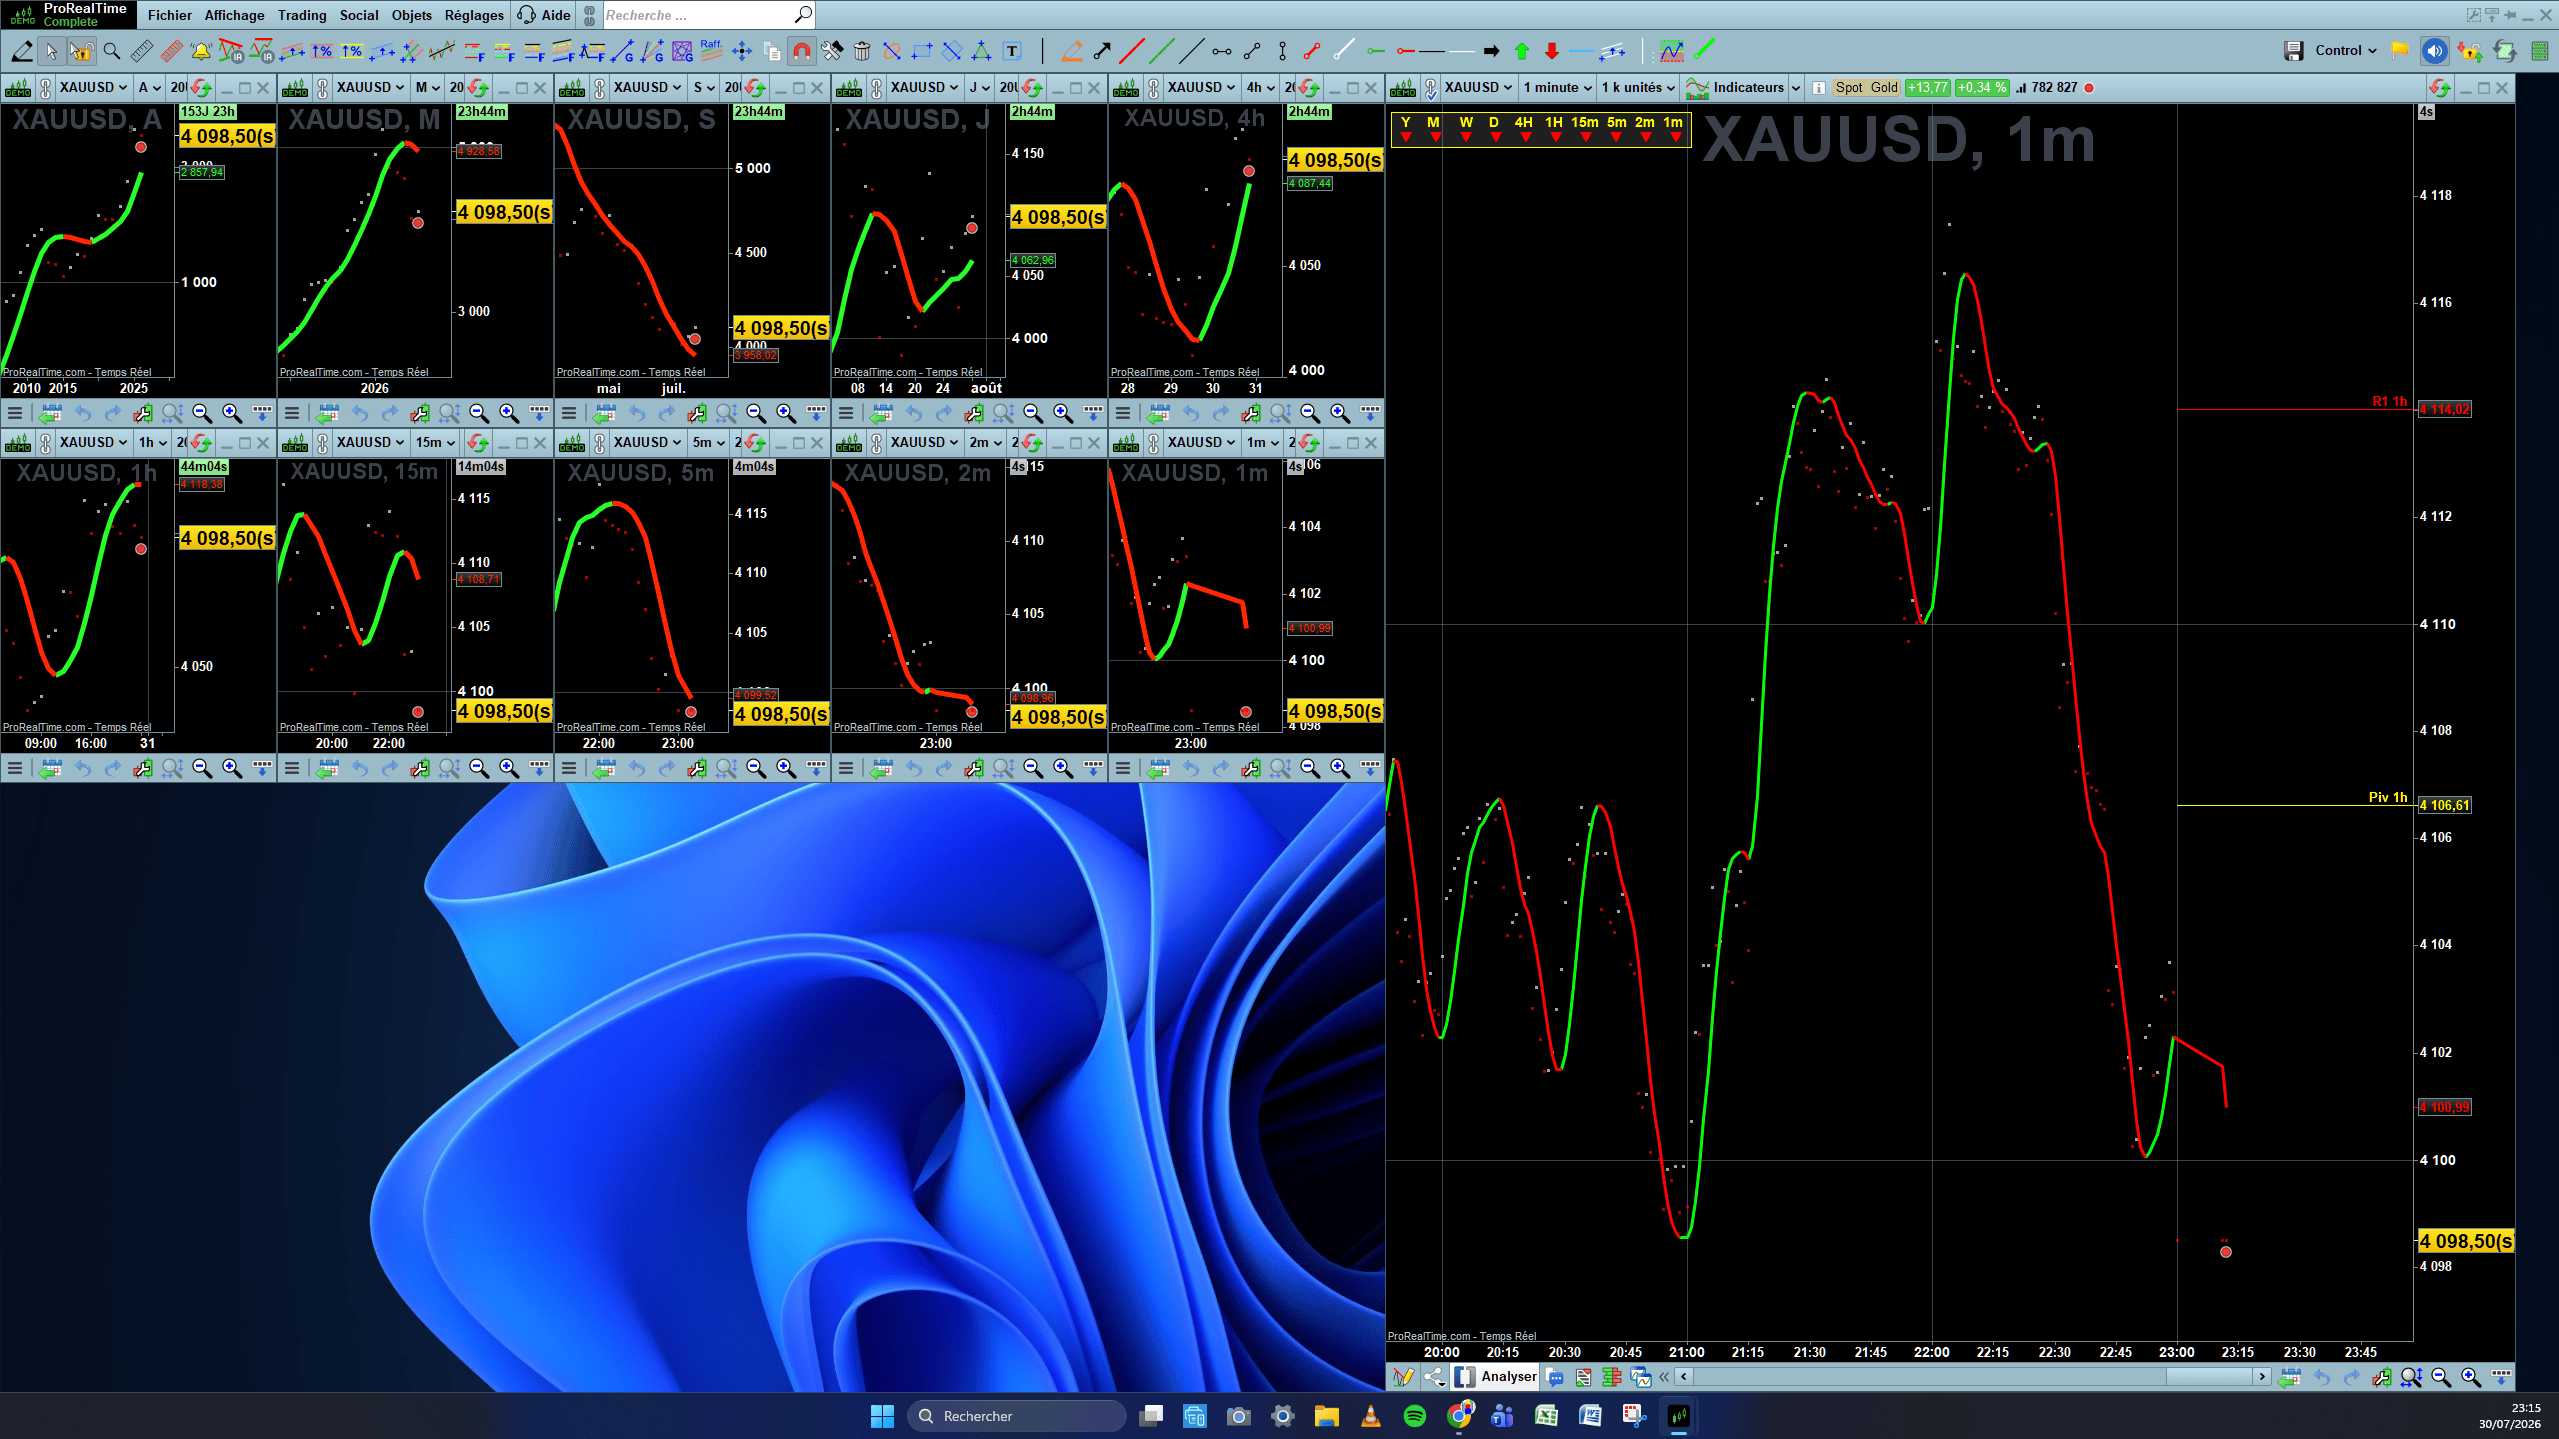
    A titre pédagogique, je souhaite créer un dashbord qui me permettra d’un seul coup d’oeil de connaîitre les directions d’une moyenne mobile dans plusieurs UT.

    Mon algo ne fonctionne pas. Quelle(s) faute(s) de programmation ai-je commis ?

    Ci-joint, code et écran de contrôle.

    Cordialement.

    //===============================================================================================
    // ProRealTime V12 / Partage des connaissances ProRealTime. / Sharing ProRealTime knowledge.
    // 2026 07 30 23:13
    // by Bernard13 "BYP"
    
    //===============================================================================================
    //                              #I BYP MTF MM dashbord
    //===============================================================================================
    // Warning ! The dashboard display only works in UT 1mn.
    //===============================================================================================
    DEFPARAM DrawOnLastBarOnly = true // Force the graph to the right
    
    S= CustomClose // Source
    
    //----- Index Moving Average (PRT V11 + )
    // 0 SMA
    // 1 EMA
    // 2 WMA
    // 3 Wilder
    // 4 Triangular
    // 5 End point
    // 6 Time series
    // 7 Hull
    // 8 ZeroLag
    
    //===============================================================================================
    //                                Multi-Time Frame
    //===============================================================================================
    // p= 21 // Fibonacci period by default
    // idx= 7  // HullAverage by default
    
    TimeFrame(1mn)
    H1m= Average[p,idx](S)
    c1m= H1m[1] < H1m
    
    TimeFrame(2mn)
    H2m= Average[p,idx](S)
    c2m= H2m[1] < H2m
    
    TimeFrame(5mn)
    H5m= Average[p,idx](S)
    c5m= H5m[1] < H5m
    
    TimeFrame(15mn)
    H15m= Average[p,idx](S)
    c15m= H15m[1] < H15m
    
    TimeFrame(1H)
    H1H= Average[p,idx](S)
    c1H= H1H[1] < H1H
    
    TimeFrame(4H)
    H4H= Average[p,idx](S)
    c4H= H4H[1] < H4H
    
    TimeFrame(Daily)
    HD= Average[p,idx](S)
    cD= HD[1] < HD
    
    TimeFrame(Weekly)
    HW= Average[p,idx](S)
    cW= HW[1] < HW
    
    TimeFrame(Monthly)
    HM= Average[p,idx](S)
    cM= HM[1] < HM
    
    TimeFrame(Yearly)
    HY= Average[p,idx](S)
    cY= HY[1] < HY
    
    //===============================================================================================
    //                                Dashboard
    //===============================================================================================
    Timeframe(Default)
    X= 20  // x-Axis
    Es= 30 // X spacing
    Y= -35  // y-Axis
    Ls= -15 // Y Line Spacing
    
    IF IsLastBarUpdate THEN
    DrawRectangle(5, -10, 305, -45) Bordercolor("Yellow") Anchor(TopLeft)
    DrawText ("Y    M     W    D    4H   1H  15m  5m  2m  1m", 156, Y-Ls, Dialog, Bold, 14) Coloured("Yellow") Anchor(TopLeft)
    IF cY THEN
    DrawText("▲", X+0*Es, Y, Dialog, Bold, 14)  Coloured("Lime") Anchor(TopLeft)
    ELSE
    DrawText("▼", X+0*Es, Y, Dialog, Bold, 14)  Coloured("Red") Anchor(TopLeft)
    ENDIF
    IF cM THEN
    DrawText("▲", X+1*Es, Y, Dialog, Bold, 14)  Coloured("Lime") Anchor(TopLeft)
    ELSE
    DrawText("▼", X+1*Es, Y, Dialog, Bold, 14)  Coloured("Red") Anchor(TopLeft)
    ENDIF
    IF cW THEN
    DrawText("▲", X+2*Es, Y, Dialog, Bold, 14)  Coloured("Lime") Anchor(TopLeft)
    ELSE
    DrawText("▼", X+2*Es, Y, Dialog, Bold, 14)  Coloured("Red") Anchor(TopLeft)
    ENDIF
    IF cD THEN
    DrawText("▲", X+3*Es, Y, Dialog, Bold, 14)  Coloured("Lime") Anchor(TopLeft)
    ELSE
    DrawText("▼", X+3*Es, Y, Dialog, Bold, 14)  Coloured("Red") Anchor(TopLeft)
    ENDIF
    IF c4H THEN
    DrawText("▲", X+4*Es, Y, Dialog, Bold, 14)  Coloured("Lime") Anchor(TopLeft)
    ELSE
    DrawText("▼", X+4*Es, Y, Dialog, Bold, 14)  Coloured("Red") Anchor(TopLeft)
    ENDIF
    IF c1H THEN
    DrawText("▲", X+5*Es, Y, Dialog, Bold, 14)  Coloured("Lime") Anchor(TopLeft)
    ELSE
    DrawText("▼", X+5*Es, Y, Dialog, Bold, 14)  Coloured("Red") Anchor(TopLeft)
    ENDIF
    IF c15m THEN
    DrawText("▲", X+6*Es, Y, Dialog, Bold, 14)  Coloured("Lime") Anchor(TopLeft)
    ELSE
    DrawText("▼", X+6*Es, Y, Dialog, Bold, 14)  Coloured("Red") Anchor(TopLeft)
    ENDIF
    IF c5m THEN
    DrawText("▲", X+7*Es, Y, Dialog, Bold, 14)  Coloured("Lime") Anchor(TopLeft)
    ELSE
    DrawText("▼", X+7*Es, Y, Dialog, Bold, 14)  Coloured("Red") Anchor(TopLeft)
    ENDIF
    IF c2m THEN
    DrawText("▲", X+8*Es, Y, Dialog, Bold, 14)  Coloured("Lime") Anchor(TopLeft)
    ELSE
    DrawText("▼", X+8*Es, Y, Dialog, Bold, 14)  Coloured("Red") Anchor(TopLeft)
    ENDIF
    IF c1m THEN
    DrawText("▲", X+9*Es, Y, Dialog, Bold, 14)  Coloured("Lime") Anchor(TopLeft)
    ELSE
    DrawText("▼", X+9*Es, Y, Dialog, Bold, 14)  Coloured("Red") Anchor(TopLeft)
    ENDIF
    ENDIF
    
    //===============================================================================================
    RETURN H1m AS "H1m"
    //===============================================================================================


    Dashbord-MTF-Capture-decran-2026-07-30-231637.png Dashbord-MTF-Capture-decran-2026-07-30-231637.png
Viewing 1 post (of 1 total)
  • You must be logged in to reply to this topic.

MTF MM dashbord


ProBuilder : Indicateurs & Outils Personnalisés

New Reply
Author
author-avatar
Bernard13 @bernard13 Participant
Summary

This topic contains 1 voice and has 0 replies.

Topic Details
Forum: ProBuilder : Indicateurs & Outils Personnalisés
Language: French
Started: 07/30/2026
Status: Active
Attachments: 1 files
Logo Logo
Loading...