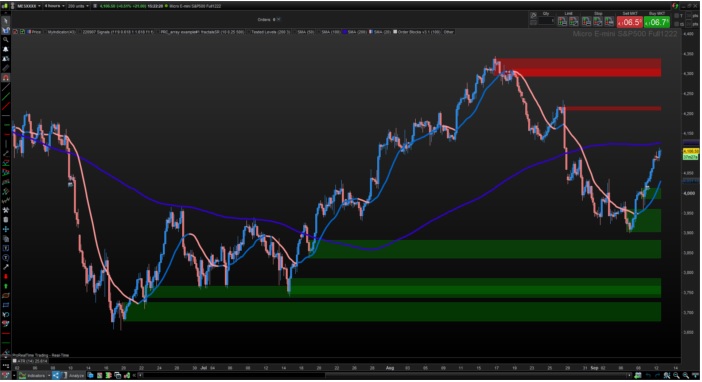
Comment afficher dans l’échelle du graphique de droite les niveaux de chaque nouveaux block ordres de l’indicateur Supply & demand
Voici le code à modifier:
Ce n’est pas possible d’écrire ces valeurs dans l’échelle de la plateforme, car il faudrait extraire toutes les valeurs des blocks dans des variables et on ne connaît pas à l’avance la quantité qui existent. Ces blocks sont purement visuels en l’état.
Par contre, on pourrait les écrire dans le graphique, à droite de chaque bloc de couleur.
Voilà ce que ça peut donner: couleur, placement et taille du texte à modifier aux lignes 134 et 143
// Sonarlabs - Order Block Finder
// converted from TradingView
// Lower the sensitivity to show more order blocks. A higher sensitivity will show less order blocks

defparam drawonlastbaronly=true

//Transparency = 80

//sens = 28

once obcreatedbear = 0
once obcreatedbull = 0
once crossindexbear = 0
once crossindexbull = 0


// Custom Rate of Change (ROC) calculation. This is to calculate high momentum moves in the market.
pc = ((open - open[4]) / open[4]) * 100


// -----------------
sens = sens/100 //ExponentialAverage[8](pc) //sens/100
OBBullMitigation = close[1]
OBBearMitigation = close[1]


// If the ROC crossover our Sensitivty input - Then create a Bearish Order Block
// Sensitivty is negative as this is a Bearish OB
if pc crosses under -sens then
obcreatedbear = 1
crossindexbear = barindex
endif


// If the ROC crossover our Sensitivty input - Then create a Bullish Order Block
if pc crosses over sens then
obcreatedbull = 1
crossindexbull = barindex
endif


////////////////////////////////////////////////////////////////////////////////////////////////////////////////
//      Calculation
////////////////////////////////////////////////////////////////////////////////////////////////////////////////

// -------------------------------
// Bearish OB Creation
// -------------------------------
// Check if we should create a OB. Also check if we haven't created an OB in the last 5 candles.
if obcreatedbear and (crossindexbear - crossindexbear[1]) > 5 then
lastgreen = 0
hhighest = 0
// Loop through the most recent candles and find the first GREEN (Bullish) candle. We will place our OB here.
for i = 4 to 15
if close[i] > open[i] then
lastgreen = i
//populate the arrays of order block to draw them later
$left[plot]= barindex[lastgreen]
$top[plot]=high[lastgreen]
$bottom[plot]=low[lastgreen]
$right[plot]=barindex[lastgreen]
plot=plot+1 //increase the array column for next data
break
endif
next
endif


// -------------------------------
// Bullish OB Creation
// -------------------------------
// Check if we should create a OB, Also check if we haven't created an OB in the last 5 candles.
if obcreatedbull and (crossindexbull - crossindexbull[1]) > 5 then
lastred = 0
hhighest = 0
// Loop through the most recent candles and find the first RED (Beaarish) candle. We will place our OB here.
for ibull = 4 to 15
if close[ibull] < open[ibull] then
lastred = ibull
//populate the arrays of order block to draw them later
$leftbull[plotbull]= barindex[lastred]
$topbull[plotbull]=high[lastred]
$bottombull[plotbull]=low[lastred]
$rightbull[plotbull]=barindex[lastred]
plotbull=plotbull+1 //increase the array column for next data
break
endif
next
endif


////////////////////////////////////////////////////////////////////////////////////////////////////////////////
//      Cleanup
////////////////////////////////////////////////////////////////////////////////////////////////////////////////

// Clean up Bearish OB boxes
if plot>0 then
for j = plot-1 downto 0 //0 to plot-1
// If the two last closes are above the high of the bearish OB - Remove the OB
if $left[j]>0 then //check if the zone still exist
itop = $top[j]
breakout = summation[max(1,barindex-$left[j])](OBBearMitigation>itop)>=1 //2
if breakout then
$left[j]=0
endif
endif
next
endif

// Clean up Bullish OB boxes
if plotbull>0 then
for jbull = plotbull-1 downto 0 //0 to plotbull-1
// If the two last closes are below the low of the bullish OB - Remove the OB
if $leftbull[jbull]>0 then //check if the zone still exist
ibot = $bottombull[jbull]
breakoutbull = summation[max(1,barindex-$leftbull[jbull])](OBBullMitigation<ibot)>=1
if breakoutbull then
$leftbull[jbull]=0
endif
endif
next
endif

////////////////////////////////////////////////////////////////////////////////////////////////////////////////
//     Drawing
////////////////////////////////////////////////////////////////////////////////////////////////////////////////

if islastbarupdate then
//plot the Bearish boxes
if  plot>0 then //islastbarupdate and
for j = plot-1 downto 0 //0 to plot-1
if $left[j]>0 then
drawrectangle($left[j],$top[j],barindex,$bottom[j]) coloured("red",Transparency)bordercolor("red",Transparency)
drawtext($bottom[j],barindex,$bottom[j],dialog,Standard,14)coloured("red")
endif
next
endif
//plot the Bullish boxes
if  plotbull>0 then //islastbarupdate and
for jbull = plotbull-1 downto 0 //0 to plotbull-1
if $leftbull[jbull]>0 then
drawrectangle($leftbull[jbull],$bottombull[jbull],barindex,$topbull[jbull]) coloured("green",Transparency)bordercolor("green",Transparency)
drawtext($topbull[jbull],barindex,$topbull[jbull],dialog,Standard,14)coloured("green")
endif
next
endif
endif

return
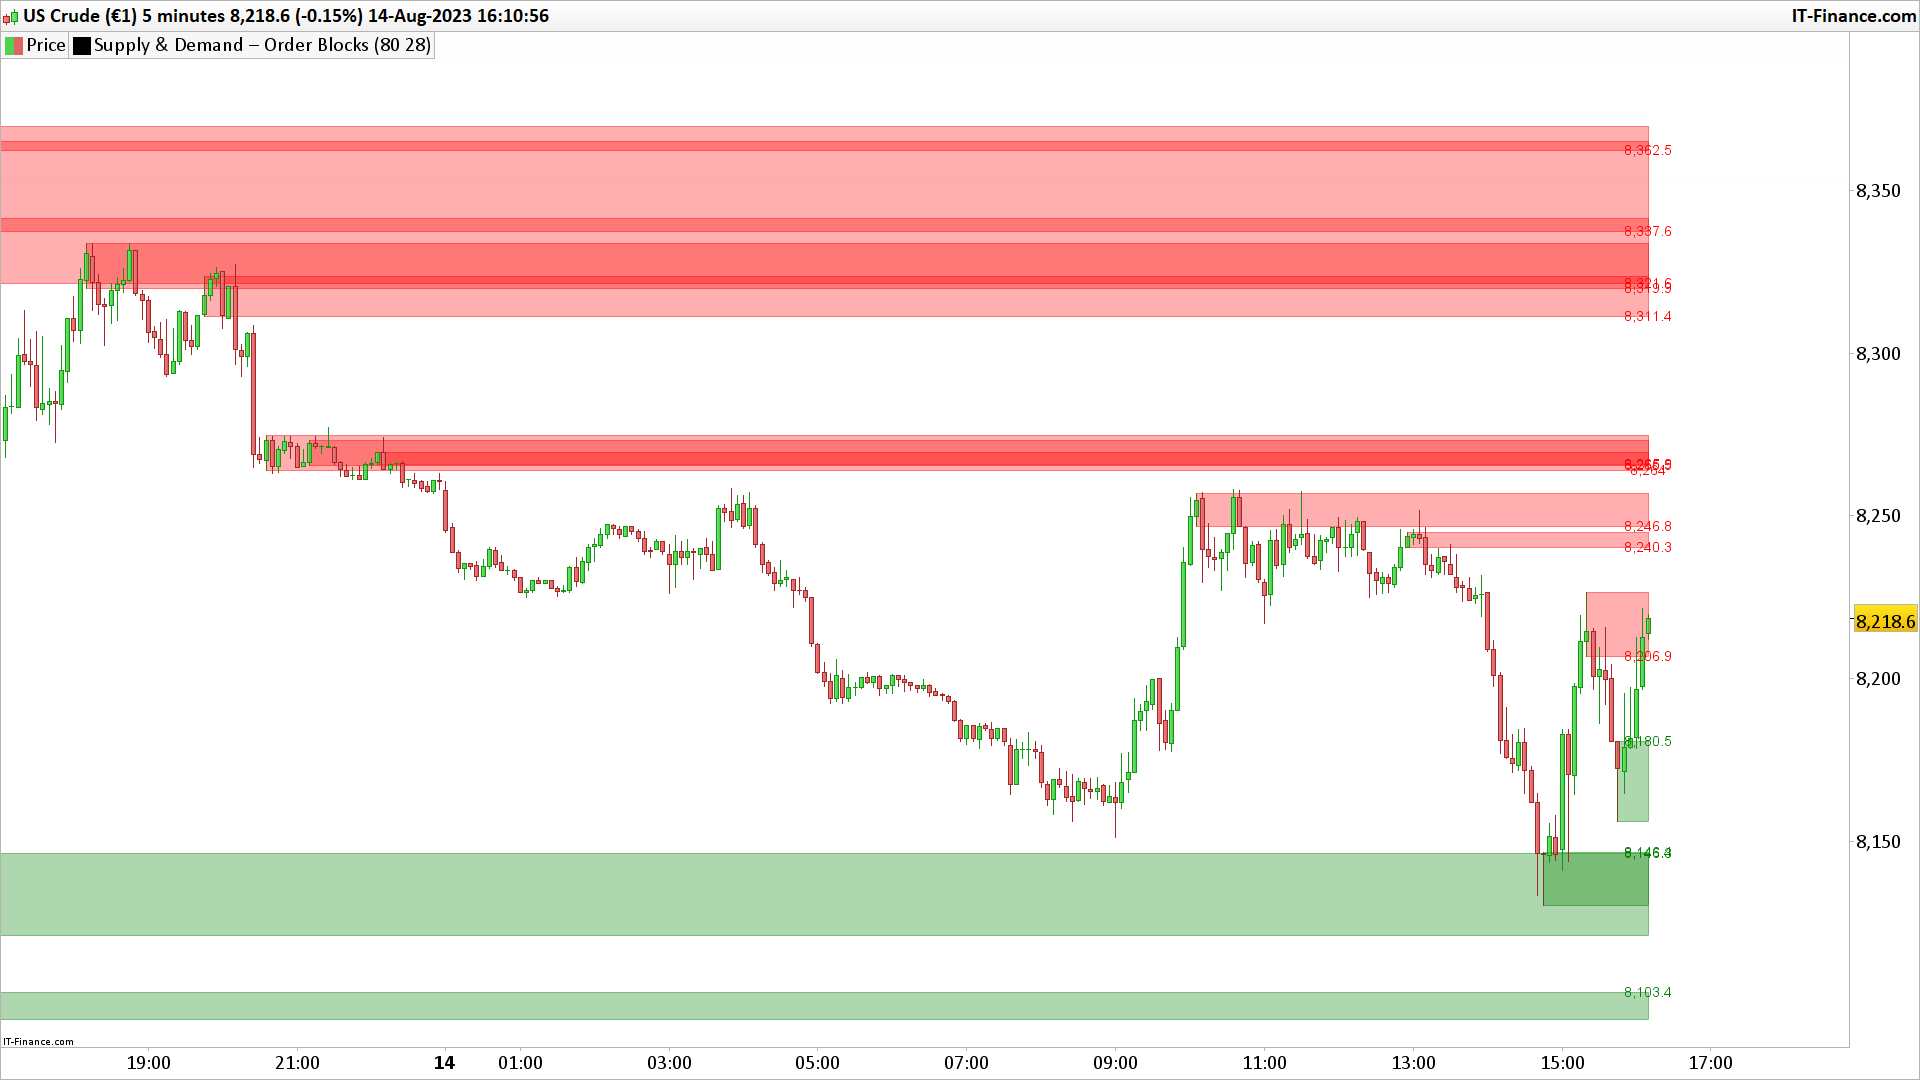
Et voilà le travail, c’est cela que je ne parvenais pas à faire après plusieurs tentatives.
Un grand merci quand même