I will like to view this Daily ADR calcualation in Intraday time frame. Please help code
defparam drawonlastbaronly=true
P = 10
AVH = average[p](high)
AVL= average[p](low)
ADR =AVH -AVL
L0=(Dlow(0) )
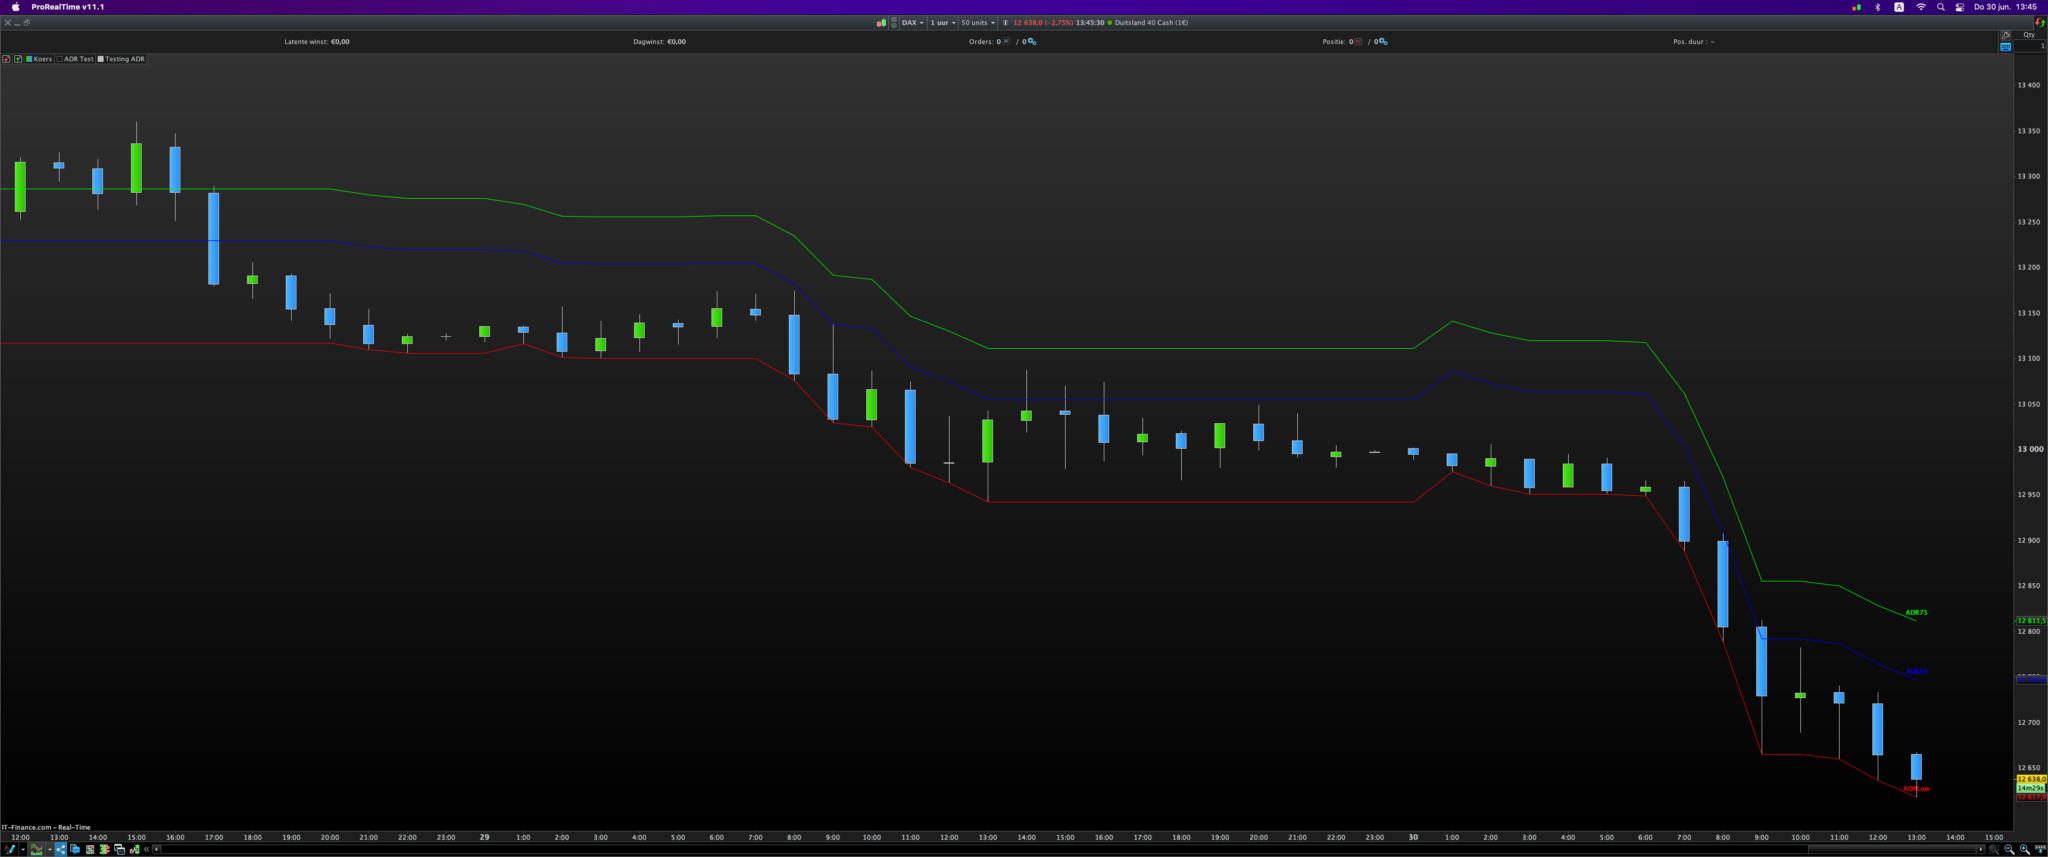
R75=L0+(ADR*.75)
R50=L0+(ADR*.50)
drawtext(“R75”,barindex,R75)
drawtext(“R50”,barindex,R50)
drawtext(“L0”,barindex,L0)
Hello,
here it is, with small horizontal segments added and text shifted a little bit to the right:
defparam drawonlastbaronly=true

P = 10

somme=0
for i=0 to p-1
 somme=somme+Dhigh(i)-Dlow(i)
next
ADR=somme/p

L0=Dlow(0)

R75=L0+(ADR*.75)
R50=L0+(ADR*.50)

drawtext("R75", barindex+15, R75)
drawtext("R50", barindex+15, R50)
drawtext("L0", barindex+15, L0)

DRAWSEGMENT(barindex, R75, barindex+10, R75)
DRAWSEGMENT(barindex, R50, barindex+10, R50)
DRAWSEGMENT(barindex, L0, barindex+10, L0)

return
Thanks a million. Is it possible to have the horizontal line fron the beginning of the day to end of day, please I mean from 00:00 to 23:59 .
Good morning. Is it possible to code a Weekly ADR calculation in Intraday time frame. Thanks in advance
defparam drawonlastbaronly=true
P = 10
somme=0
for i=0 to p–1
somme=somme+Dhigh(i)–Dlow(i)
next
ADR=somme/p
L0=Dlow(0)
R75=L0+(ADR*.75)
R50=L0+(ADR*.50)
drawtext(“R75”, barindex+15, R75)
drawtext(“R50”, barindex+15, R50)
drawtext(“L0”, barindex+15, L0)
DRAWSEGMENT(barindex, R75, barindex+10, R75)
DRAWSEGMENT(barindex, R50, barindex+10, R50)
DRAWSEGMENT(barindex, L0, barindex+10, L0)
return
 JS
JSParticipant
Veteran
DefParam DrawOnLastBarOnly = True

TimeFrame(Daily)

ADR = Range
ADRLow = Low
AvgADR = Average[10](ADR)
ADR50 = ADRLow + 0.5 * AvgADR
ADR75 = ADRLow + 0.75 * AvgADR

TimeFrame(Default)
drawtext("ADR75", barindex, ADR75+10) Coloured(0,255,0)
drawtext("ADR50", barindex, ADR50+10) Coloured(0,0,255)
drawtext("ADRLow", barindex, ADRLow+10) Coloured(255,0,0)

Return ADR50 as "ADR50" Coloured(0,0,255), ADR75 as "ADR75" Coloured(0,255,0), ADRLow as "ADRLow" Coloured(255,0,0)
Hi @oyinloyea
Here is an alternative with MTF.
If you want to use weekly rates, you can change “TimeFrame(Daily)” to TimeFrame(Weekly)…
Using the above style of coding labels are not showing on my chart when using Timeframe Weekly
DefParam DrawOnLastBarOnly = True
DEFPARAM CalculateOnLastBars = 1000
Voffset = -5*pipsize
TimeFrame(Weekly)
ADR = Range
//L0 =DLow(0)
L0 = Low
L0=L0
//H0 =DHigh(0)
H0 =High
H0=H0
AvgADR = Average[10](ADR)
S125= H0- 1.25 * AvgADR
S100= H0 – 1 * AvgADR
S75=H0- .75 * AvgADR
S50=H0- .50 * AvgADR
Mid= (H0+L0)/2
drawtext(“S125”,barindex,S125+Voffset,SansSerif,Bold,10)
drawtext(“S100”,barindex,S100+Voffset,SansSerif,Bold,10)
drawtext(“S75”,barindex,S75+Voffset,SansSerif,Bold,10)
drawtext(“S50”,barindex,S50+Voffset,SansSerif,Bold,10)
drawtext(“H0”,barindex,H0+Voffset,SansSerif,Bold,10)
drawtext(“L0”,barindex,L0+Voffset,SansSerif,Bold,10)
drawtext(“Mid”,barindex,Mid+Voffset,SansSerif,Bold,10)
DRAWSEGMENT(barindex, S125, barindex+10, S125)coloured(0,153,0)
DRAWSEGMENT(barindex, S100, barindex+10, S100)coloured(0,153,0)
DRAWSEGMENT(barindex, S75, barindex+10, S75)coloured(0,153,0)
DRAWSEGMENT(barindex, S50, barindex+10, S50)coloured(0,153,0)
DRAWSEGMENT(barindex, mid, barindex+10, mid)
DRAWSEGMENT(barindex, H0, barindex+10, H0)
DRAWSEGMENT(barindex, L0, barindex+10, L0)
RETURN L0 as “Low”,H0 as “High”,S125 AS “S125”, S100 AS “S100”, S75 AS “S75” , S50 AS “S50”, mid as “mid”
That’s because from JS’s code above you only took timeframe(weekly) and for some reason deleted the timeframe(default) line (see his line 11 before the drawtext labels lines). You would need to place it back to see your labels, in between your Mid= (H0+L0)/2 line and your drawtext(“S125”… line
I am trying to code this as an indicator
AvgRange= Average((H-L),10
NarrowRange= AvgRange*.65
AdvanvcesdADR=((H-L),Periods
Wide Range= Avg Range * 1.25
This is what I have but I think it is incorrect. Please help
defparam drawonlastbaronly=true

AVR= (High-Low)[p]
WR=AVR *1.25
NR=AVR *.65
ADADR= (High-Low)
If ADADR > WR then
r=255
g=0
b=0

endif
If ADADR > NR and ADADR < WR then
r=0
g=0
b=255

endif

If ADADR < NR then
r=204
g=204
b=0

endif
return ADADR coloured(r,g,b) style(histogram),AVR as “AVR” , WR as “WR”, NR as “NR”
Although on one hand I guess AvgRange= Average((H-L),10 in whatever programming language that was, would probably be in probuilder language:
AvgRange= Average[10](H-L)
on the other hand I do not know what AdvanvcesdADR=((H-L),Periods would be, this is not a programming language I can help with, sorry