Hi there,
I am trying to add stop levels to an indicator I am using – I’ve looked everywhere and nothing seems to work well enough with the indicator I am using. The closest I got was with Someones Darvas Boxes code:
Darvas Boxes
Id like to add these lines as stop loss level (It is for hidden Divergence) so when the indicator picks up a lower high / higher low it will draw these lines on the previous high / low
See code below:
//RSI Divergences By Frank (Francesco)

//Description: the indicator draws arrows on chart as entry points when a direct or an hidden RSI divergence is found.
//When a DIRECT divergence is found, "dd" (direct divergence) text is added to chart over (Sell signal) or under (Buy signal) the arrow

//When an HIDDEN or INVERSE divergence is found, "hd" (hidden divergence) text is added to chart over (Sell signal) or under (Buy signal) the arrow

//Variables:
//RsiPeriod: number of bars to calculare RSI value
//RsiOverSold: Oversold Level
//RsiOverBought: OverBought Level
//MinBarRange: minimum distance from two consecutive Price Highs or Price Lows

Rge = averagetruerange[7](close)
MyRSI = rsi[RsiPeriod](Close)

ONCE ShiftText = 3

RsiMax = MyRSI < MyRSI[1] and MyRSI[1] > MyRSI[2] and MyRSI[1] > RsiOverBought
RsiMin = MyRSI > MyRSI[1] and MyRSI[1] < MyRSI[2] and MyRSI[1] < RsiOverSold

if RsiMax then
RSIMax1 = MyRSI[1]
High1 = High[1]

for I = MinBarRange to  80
if RsiMax[I] then
RSIMax2 = MyRSI[I + 1]
High2 = High[I + 1]
If High1 > High2 and RSIMax1 < RSIMax2 then
elsif High1 < High2 and RSIMax1 > RSIMax2 then
DRAWARROWDOWN(barindex, High + Rge / ShiftText)coloured(255,192,203,255)
DRAWTEXT("Sell", barindex, High + Rge / ShiftText / 0.2,SansSerif,Italic,15)coloured(0,0,255,255)

endif
break
endif
next
endif

if RsiMin then
RSIMin1 = MyRSI[1]
Low1 = Low[1]
for I = MinBarRange to  80
if RSIMin[I] then
RSIMin2 = MyRSI[I + 1]
Low2 = Low[I + 1]
If Low1 < Low2 and RSIMin1 > RSIMin2 then
elsif Low1 > Low2 and RSIMin1 < RSIMin2 then
DRAWARROWUP(barindex, lOW - Rge / ShiftText)coloured(0,0,255,255)
DRAWTEXT("Buy", barindex, lOW - Rge / ShiftText / 0.2,SansSerif,Italic,15)coloured(0,0,255,255)
REM Set Stop Level
MyStop =Low[1]
endif
break
endif
next
endif

return
Thanks in advance and let me know if you need anymore information
Geoff
Just to clarify, these levels would be on the price chart not the RSI
Regards,
Geoff
There you go:
//////////////////////////////////////////////////////////////////////////////////////////
// DARVAS Boxes
//
//  https://www.prorealcode.com/prorealtime-indicators/darvas-boxes-2/
//============================== Indicateur

if box=1 and (high>DownBoxe or low<UpBoxe) then
box=0
flag=0
endif
if box=0 and flag=0 and low>low[3] and low[1]>low[3] and low[2]>low[3] then
th=low[3]
flag=1
endif
if flag=1 and box=0 and low<th then
flag=0
endif
if flag=1 and box=0 and high<high[3] and high[1]<high[3] and high[2]<high[3] then
DownBoxe=high[3]
UpBoxe=th
box=1
endif

once DownBoxe=undefined
once UpBoxe=undefined

//============================== Fin

//return UpBoxe style (point,3) as "UpBoxe",DownBoxe style (point,3) as "DownBoxe"
//////////////////////////////////////////////////////////////////////////////////////////
//RSI Divergences By Frank (Francesco)

//Description: the indicator draws arrows on chart as entry points when a direct or an hidden RSI divergence is found.
//When a DIRECT divergence is found, "dd" (direct divergence) text is added to chart over (Sell signal) or under (Buy signal) the arrow

//When an HIDDEN or INVERSE divergence is found, "hd" (hidden divergence) text is added to chart over (Sell signal) or under (Buy signal) the arrow

//Variables:
RsiPeriod     = 14 //: number of bars to calculare RSI value
RsiOverSold   = 30 //: Oversold Level
RsiOverBought = 70 //: OverBought Level
MinBarRange   = 2 //: minimum distance from two consecutive Price Highs or Price Lows

Rge = averagetruerange[7](close)
MyRSI = rsi[RsiPeriod](Close)

ONCE ShiftText = 3

RsiMax = MyRSI < MyRSI[1] and MyRSI[1] > MyRSI[2] and MyRSI[1] > RsiOverBought
RsiMin = MyRSI > MyRSI[1] and MyRSI[1] < MyRSI[2] and MyRSI[1] < RsiOverSold

if RsiMax then
RSIMax1 = MyRSI[1]
High1 = High[1]

for I = MinBarRange to  80
if RsiMax[I] then
RSIMax2 = MyRSI[I + 1]
High2 = High[I + 1]
If High1 > High2 and RSIMax1 < RSIMax2 then
elsif High1 < High2 and RSIMax1 > RSIMax2 then
DRAWARROWDOWN(barindex, High + Rge / ShiftText)coloured(255,192,203,255)
DRAWTEXT("Sell", barindex, High + Rge / ShiftText / 0.2,SansSerif,Italic,15)coloured(0,0,255,255)

endif
break
endif
next
endif

if RsiMin then
RSIMin1 = MyRSI[1]
Low1 = Low[1]
for I = MinBarRange to  80
if RSIMin[I] then
RSIMin2 = MyRSI[I + 1]
Low2 = Low[I + 1]
If Low1 < Low2 and RSIMin1 > RSIMin2 then
elsif Low1 > Low2 and RSIMin1 < RSIMin2 then
DRAWARROWUP(barindex, lOW - Rge / ShiftText)coloured(0,0,255,255)
DRAWTEXT("Buy", barindex, lOW - Rge / ShiftText / 0.2,SansSerif,Italic,15)coloured(0,0,255,255)
REM Set Stop Level
MyStop =Low[1]
endif
break
endif
next
endif

return UpBoxe style (point,1) as "UpBoxe",DownBoxe style (point,1) as "DownBoxe"
Thank you so much – I really appreciate the help
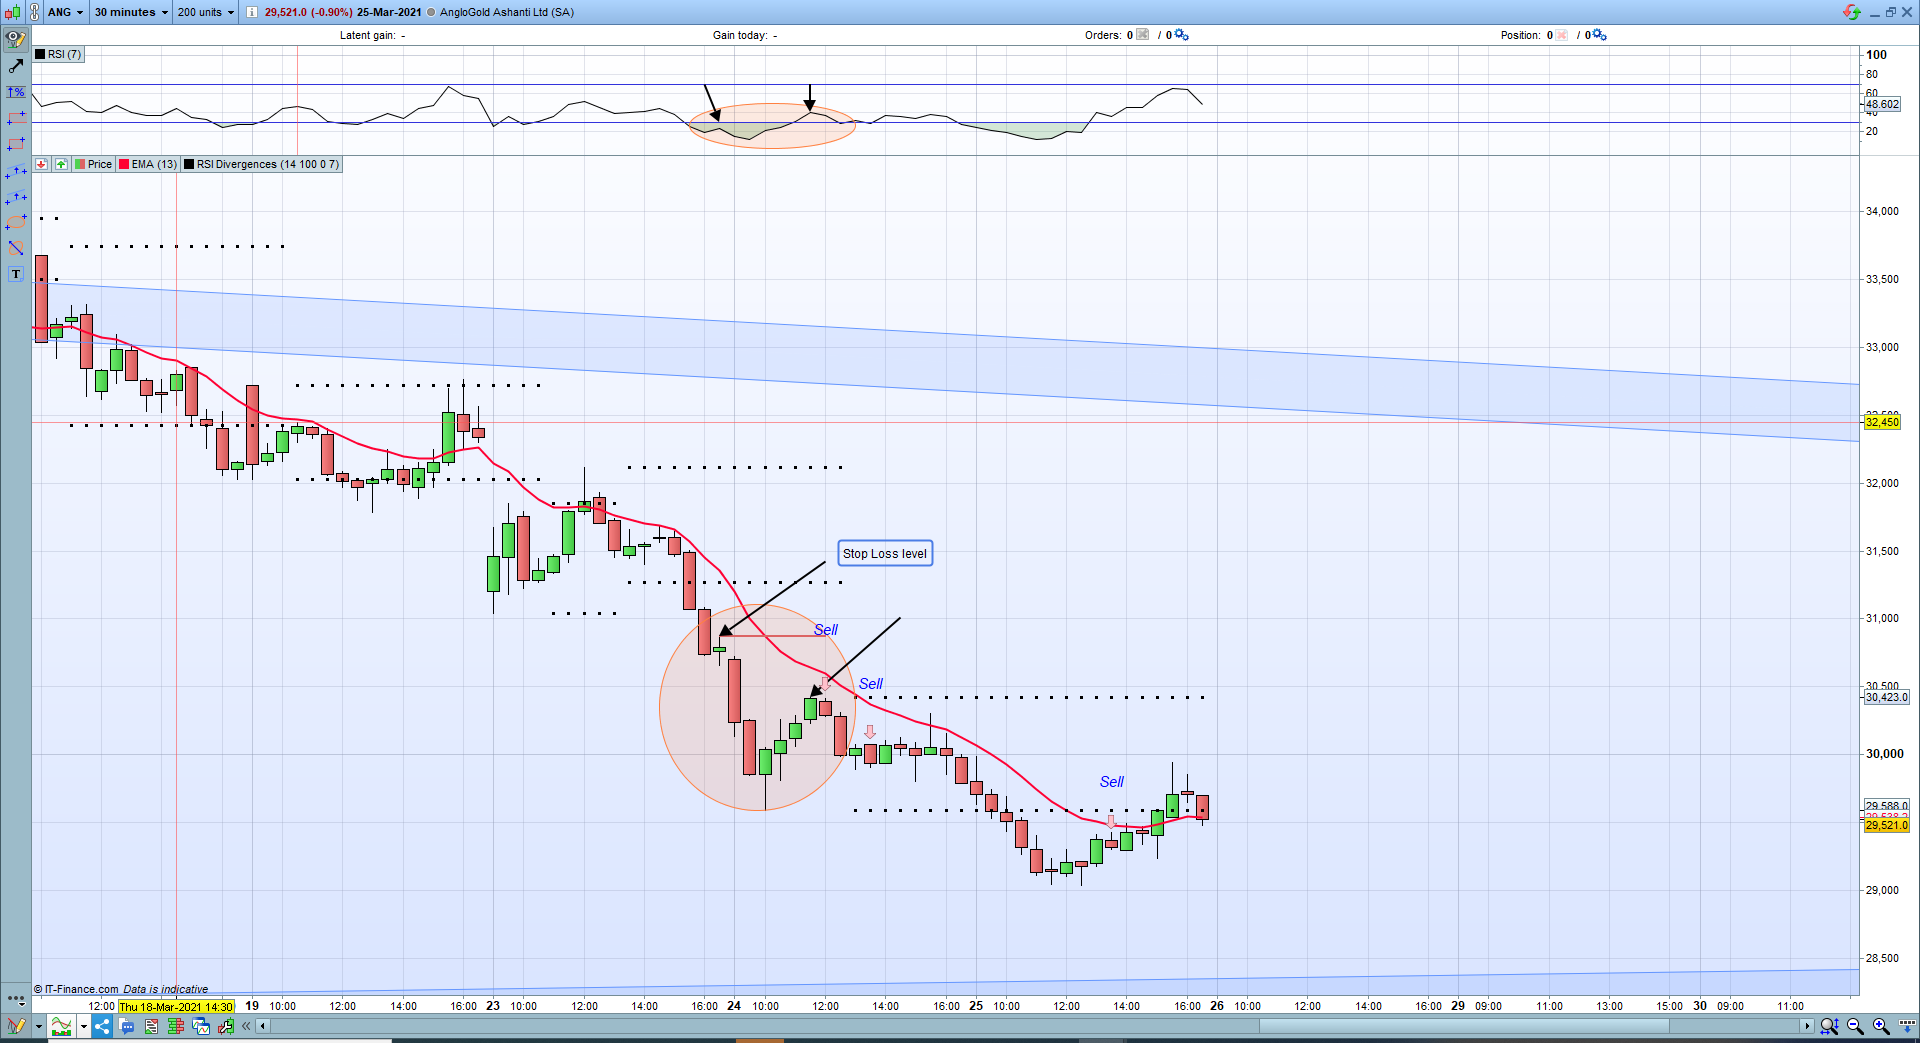
I am sorry if I am starting to ask too much but is there a way that the lines can be drawn drawn according to the high / low that corresponds to the previous high or low defined in the divergence indicator instead of just highs and lows on the chart
Ive tried to show an example in the attached image