Good day,
I found this indicator in the library. Will it be possible to add a text e.g “Buy” or “Sell” just above or below the divergence lines?
Regards,
Segie
///////////////////////////////////////////////////////////

// MACD divergences on price
//by Jose Callao
// twitter @jose7674
// attach this indicator to the chart

N=40///N is the number of bars to look back for a divergence. Normal values are 20-40. Must be the same in both indicators

//using any other indicator is as easy as changing the values
miMACD = exponentialAverage[12](close) - exponentialAverage[26](close)

IF (BarIndex > 10+1+N) THEN

 //we look for bearish divergences
 IF (miMACD[1]>miMACD AND miMACD[1]>miMACD[2]) THEN
  extremum2=miMACD[1]
  extremum1=highest[N](miMACD)

  preciomax2=close[1]
  preciomax=Highest[N](close)
  IF(extremum2<extremum1 AND preciomax2>preciomax[1]) THEN
   for i=1 to N
    if close[i]=preciomax[1] then
     zz=i

     drawsegment (barindex[1], close[1], barindex[zz], close[zz]) coloured(200,0,0)
    endif
   next

  endif
 endif

 //we look for bullish divergences
 IF (miMACD[1]<miMACD AND miMACD[1]<miMACD[2]) THEN
  extremum22=miMACD[1]
  extremum11=lowest[N](miMACD)

  preciomin2=close[1]
  preciomin=lowest[N](close)

  IF(extremum22>extremum11 AND preciomin2<preciomin[1]) THEN
   for i2=1 to N
    if close[i2]=preciomin[1] then
     zz2=i2

     drawsegment(barindex[1], close[1], barindex[zz2], close[zz2]) coloured(0,200,0)
    endif
   next
  endif
 endif
endif
return

//////////////////////////////////////////////
Hi segie
see code with text and arrows
///////////////////////////////////////////////////////////

// MACD divergences on price
//by Jose Callao
// twitter @jose7674
// attach this indicator to the chart

N=40///N is the number of bars to look back for a divergence. Normal values are 20-40. Must be the same in both indicators

//using any other indicator is as easy as changing the values
miMACD = exponentialAverage[12](close) - exponentialAverage[26](close)
ATR = Averagetruerange[100](close)//Added

IF (BarIndex > 10+1+N) THEN

//we look for bearish divergences
IF (miMACD[1]>miMACD AND miMACD[1]>miMACD[2]) THEN
extremum2=miMACD[1]
extremum1=highest[N](miMACD)

preciomax2=close[1]
preciomax=Highest[N](close)
IF(extremum2<extremum1 AND preciomax2>preciomax[1]) THEN
for i=1 to N
if close[i]=preciomax[1] then
zz=i

drawtext("SELL",barindex[1],high[1]+ATR,Dialog,Bold,10)coloured(255,0,0)//Added
drawarrowdown(barindex[1], high[1])coloured(255,0,0)//Added
drawsegment (barindex[1], close[1], barindex[zz], close[zz]) coloured(255,0,0)
endif
next

endif
endif

//we look for bullish divergences
IF (miMACD[1]<miMACD AND miMACD[1]<miMACD[2]) THEN
extremum22=miMACD[1]
extremum11=lowest[N](miMACD)

preciomin2=close[1]
preciomin=lowest[N](close)

IF(extremum22>extremum11 AND preciomin2<preciomin[1]) THEN
for i2=1 to N
if close[i2]=preciomin[1] then
zz2=i2

drawtext("BUY",barindex[1],low[1]-ATR,Dialog,Bold,10)coloured(0,200,0)//Added
drawarrowup(barindex[1], low[1])coloured(0,200,0)//Added
drawsegment(barindex[1], close[1], barindex[zz2], close[zz2]) coloured(0,200,0)
endif
next
endif
endif
endif
return

//////////////////////////////////////////////
There you go:
///////////////////////////////////////////////////////////

// MACD divergences on price
//by Jose Callao
// twitter @jose7674
// attach this indicator to the chart

N=40///N is the number of bars to look back for a divergence. Normal values are 20-40. Must be the same in both indicators

//using any other indicator is as easy as changing the values
miMACD = exponentialAverage[12](close) - exponentialAverage[26](close)

IF (BarIndex > 10+1+N) THEN

//we look for bearish divergences
IF (miMACD[1]>miMACD AND miMACD[1]>miMACD[2]) THEN
extremum2=miMACD[1]
extremum1=highest[N](miMACD)

preciomax2=close[1]
preciomax=Highest[N](close)
IF(extremum2<extremum1 AND preciomax2>preciomax[1]) THEN
for i=1 to N
if close[i]=preciomax[1] then
zz=i

drawsegment (barindex[1], close[1], barindex[zz], close[zz]) coloured(200,0,0)
offset = high[1] + (high[1] / 100)
drawtext("Sell",barindex[1],Offset) coloured(255,0,0,255)
endif
next

endif
endif

//we look for bullish divergences
IF (miMACD[1]<miMACD AND miMACD[1]<miMACD[2]) THEN
extremum22=miMACD[1]
extremum11=lowest[N](miMACD)

preciomin2=close[1]
preciomin=lowest[N](close)

IF(extremum22>extremum11 AND preciomin2<preciomin[1]) THEN
for i2=1 to N
if close[i2]=preciomin[1] then
zz2=i2
drawsegment(barindex[1], close[1], barindex[zz2], close[zz2]) coloured(0,200,0)
offset = low[1] - (low[1] / 100)
drawtext("buy",barindex[1],Offset) coloured(0,128,0,255)
endif
next
endif
endif
endif
return
Hello Nicolas, Jose, Segie & Roberto,
When the above indicator triggers, it lags by a few points. This is normal and correct with all MACD type indicators.
Now assume I have it displayed on Chart and instead of having Drawsegment, I have Drawarrowup and Drawarrowdown instead. My question is:
If I want to (on purpose) make it false trigger i.e. trigger the up and down arrows on Barindex[1] prematurely by say 10 index points before actual bullish and bearish conditions are triggered, how would I do that please?
Many tnx in advance
There’s no way to foretell if a signal will be returned next bar.
You can only wait for the signal and when it shows you can plot something on the prior bar. It’s a ZigZag-like behavior called REPAINTING.
Tnx Roberto. I am not sure if I explained myself properly.
I want the signal to appear prematurely (i.e. prior prior and in advance of what it was going to appear).
Let’s say the signal will appear when a condition is met (let’s say when current bar price is or reaches 7000). What I want is the signal to appear as the price approaches or near 7000 (say 7000 – x points, for example 6990)
with the MACD indicator that JOSE has written, once the conditions that trigger the signals are understood, then we can alter those conditions to trigger on approach not on attainment. I am fully aware that this would defeat the purpose of the divergence/convergence but still that’s what I want to achieve and test. It would be like a prewarning of trouble ahead 🙂
Hope this has clarified what I am trying to achieve.
Yes, you had explained yourself clearly.
If 7000 is lagging, you can replace it with 6990. Then 6990 will be lagging.
Anyway, were it a fixed price, say 7000, you could easily wait when it is 6990, though not exactly, but with CLOSE how can you tell it’s now 10 points less than it will be next bar?
Mate I used Close as just a plain example. The actual conditions for the signal trigger are those in the MACD on MACD indicator that is coded by JOSE and posted here in the forum. Have a look at this indicator and see if you can grasp the conditions that trigger the signal. if you can then see if there is a way to trigger the signal on approach of condition (i.e. pre-mature trigger) rather than on attainment of condition.
Indicators are even worse than price, if the current price is 6990, on the rise, you may guess the next bar is approx. 7000, but how can you foretell next bar MACD will be 0 if now it’s -3?
If you mean something like this:
IF (miMACD[1]>(miMACD-2) AND miMACD[1]>miMACD[2]) THEN
assuming next miMACD will be the current value + 2, it won’t work most of the times.
tnx Roberto.
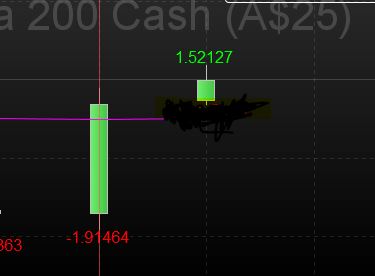
The below attached file returns value of an indicator I have written on top or bottom of candle (green if positive and red if negative). The value is live and dynamic i.e. it changes up and down for the duration of the timeframe. At the end of time frame, the value freezes and becomes historic, green if positive by end of time frame and red if negative by end of time frame). So far so easy and straightforward.
My question is:
How can I display the rate the value is changing per minute? is that possible with an array or some other simpler code?
It was a picture. I here attach it again
It’s the same answer I posted here https://www.prorealcode.com/topic/creating-timer-to-capture-indicator-values-at-intervals/.
You can display values every 15 minutes on a 1-minute TF, not the other way round.