Buenas,
Mira a ver si este te vale.
//DEFPARAM DrawOnLastBarOnly = true
// Parabolic Psar
psar = SAR[0.02, 0.02, 0.2]
if close > psar then
r=0
g=255
b=250
else
r=255
g=0
b=250
endif
// Bandas de Bollinger
ema20 = ExponentialAverage[20](close)
dev = 2
Bbup = ema20 + std[20](close) * dev
Bbdown = ema20 - std[20](close) * dev
//------------------------------------------------//
barsPsarDN=barssince(close>psar)
barsPsarUP=barssince(close<psar)
//------------------------------------------------//
if close<psar then
countdw=1+countdw
minLow=min(low,minLow)
barsminLow=barssince(minLow=low)

countup=0
maxhigh=high
elsif close>psar then
countdw=0
minLow=low

countup=1+countup
maxhigh=max(high,maxhigh)
barsmaxhigh=barssince(high=maxhigh)
endif

if close>psar and close[1]<psar[1] then
lastbarsPsarDN=barsPsarDN[1]
lastbarsMinLow=barsminLow[1]
BBdn=Bbdown[lastbarsMinLow+1]
PEdn=lowest[lastbarsPsarDN](low)

endif

if close<psar and close[1]>psar[1] then
lastbarsPsarUP=barsPsarUP[1]
lastbarsMaxHigh=barsmaxhigh[1]
BollUp=Bbup[lastbarsMaxHigh+1]
PEdn=lowest[lastbarsPsarDN](low)

endif

drawsegment(barindex,BBdn,barindex[lastbarsMinLow+1],BBdn)style(line,2)
drawsegment(barindex,BollUp,barindex[lastbarsMaxHigh+1],BollUp)style(line,2)
//------------------------------------------------//
return bbUp as "BBUp" coloured("yellow")style(line,2),Bbdown as "BBDown" coloured("yellow")style(line,2), psar as "PSAR" coloured(r,g,b)
Lo que hace es almacenar el valor de la banda de bollinger en el punto extremo.
Con esto podrás adaptarlo a tu gusto.
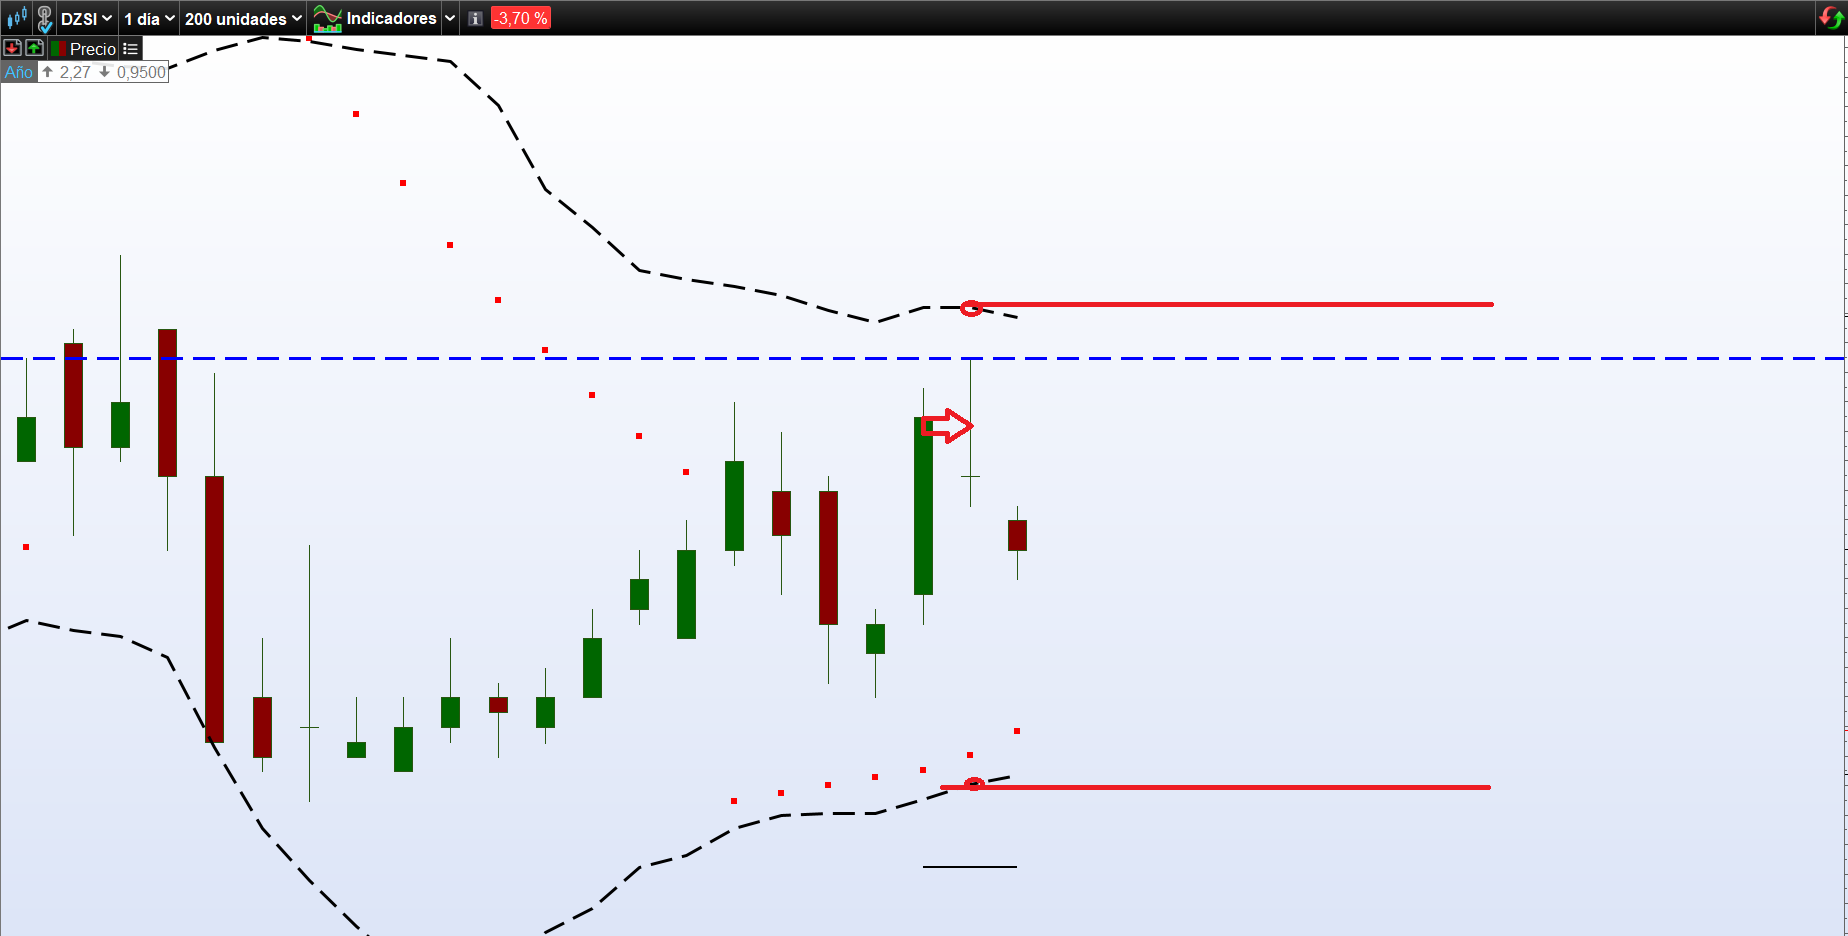
Buenas Iván, no lo hace bien. Lo que quiero es que cuando el close deje de ser igual al PE me dibuje una linea en la bbup y en la bbdown y se queden fijas como te pongo en la imagen y no se actualicen hasta que el close vuelva a ser igual al PE o que el precio rebase la parabolica sar. En la imagen te señalo con una flecha la vela que ha realizado el PE y luego una simulación de donde irían las líneas. Te adjunto el código modificado por si te serviría de algo. Un saludo
DEFPARAM DrawOnLastBarOnly = true
//-------------------------------PE-------------------------------------------------------------------------------------
psar = SAR[0.02,0.02,0.2]
C1 = CLOSE > PSAR
C2 = CLOSE < PSAR
IF C1 AND NOT C1[1] THEN
CONTADOR = 1
TENDENCIAANTERIOR = 1
ELSIF C2 AND NOT C2[1] THEN
CUENTA = 1
TENDENCIAANTERIOR = -1
ELSIF TENDENCIAANTERIOR = 1 THEN
CONTADOR = CONTADOR[1] + 1
ELSIF TENDENCIAANTERIOR = -1 THEN
CUENTA = CUENTA[1] + 1
ENDIF
IF C1 THEN
IF CONTADOR > 1 THEN
PE = HIGHEST[CONTADOR](HIGH)
ELSE
PE = HIGH
ENDIF
ENDIF
IF C2 THEN
IF CUENTA > 1 THEN
PE = LOWEST[CUENTA](LOW)
ELSE
PE = LOW
ENDIF
ENDIF
Offset = psar  - (average[100,0](range) / 1)
IF close <= psar THEN
Offset = psar  + (average[100,0](range) / 1)
endif
Offset2 = psar  - (average[100,0](range) / 2)
IF close <= psar THEN
Offset2 = psar  + (average[100,0](range) / 2)
endif


IF C1 AND NOT C1[1] THEN
CONTADOR = 1
TENDENCIAANTERIOR = 1
ELSIF C2 AND NOT C2[1] THEN
CUENTA = 1
TENDENCIAANTERIOR = -1
ELSIF TENDENCIAANTERIOR = 1 THEN
CONTADOR = CONTADOR[1] + 1
ELSIF TENDENCIAANTERIOR = -1 THEN
CUENTA = CUENTA[1] + 1
ENDIF

IF C1 THEN
IF CONTADOR > 1 THEN
PE = HIGHEST[CONTADOR](HIGH)
ELSE
PE = HIGH
ENDIF
DRAWSEGMENT(barindex+510, PE, barindex[510], PE)  COLOURED(0,0,255)STYLE(dottedline1,3)

ENDIF

IF C2 THEN
IF CUENTA > 1 THEN
PE = LOWEST[CUENTA](LOW)
ELSE
PE = LOW
ENDIF
DRAWSEGMENT(barindex+510, PE, barindex[510], PE)  COLOURED(0,0,255) STYLE(dottedline1,3)

ENDIF


// Bandas de Bollinger
ema20 = ExponentialAverage[20](close)
dev = 2
Bbup = ema20 + std[20](close) * dev
Bbdown = ema20 - std[20](close) * dev
//------------------------------------------------//
barsPsarDN=barssince(close>PE)
barsPsarUP=barssince(close<PE)
//------------------------------------------------//
if close<PE then
countdw=1+countdw
minLow=min(low,minLow)
barsminLow=barssince(minLow=low)

countup=0
maxhigh=high
elsif close>PE then
countdw=0
minLow=low

countup=1+countup
maxhigh=max(high,maxhigh)
barsmaxhigh=barssince(high=maxhigh)
endif

if close>psar and close[1]<psar[1] then
lastbarsPsarDN=barsPsarDN
lastbarsMinLow=barsminLow
BBdn=Bbdown[lastbarsMinLow+1]
PEdn=lowest[lastbarsPsarDN](low)

endif

if close<psar and close[1]>psar[1] then
lastbarsPsarUP=barsPsarUP[1]
lastbarsMaxHigh=barsmaxhigh[1]
BollUp=Bbup[lastbarsMaxHigh+2]
PEdn=lowest[lastbarsPsarDN](low)

endif

drawsegment(barindex,BBdn,barindex[lastbarsMinLow+1],BBdn)style(line,2)
drawsegment(barindex,BollUp,barindex[lastbarsMaxHigh+1],BollUp)style(line,2)
//------------------------------------------------//
return
Ok, entonces sería así:
DEFPARAM DrawOnLastBarOnly = true
// Parabolic Psar
psar = SAR[0.02, 0.02, 0.2]
if close > psar then
r=0
g=255
b=250
else
r=255
g=0
b=250
endif
// Bandas de Bollinger
ema20 = ExponentialAverage[20](close)
dev = 2
Bbup = ema20 + std[20](close) * dev
Bbdown = ema20 - std[20](close) * dev
//------------------------------------------------//
if close<psar then
countdw=1+countdw
minLow=min(low,minLow)
barsminLow=barssince(minLow=low)

countup=0
maxhigh=high

drawsegment(barindex[barsminLow],Bbup[barsminLow],barindex+10,Bbup[barsminLow])style(line,2)coloured("red")
drawsegment(barindex[barsminLow],Bbdown[barsminLow],barindex+10,Bbdown[barsminLow])style(line,2)coloured("red")
drawpoint(barindex[barsminLow],minLow,2)coloured("blue")

elsif close>psar then
countdw=0
minLow=low

countup=1+countup
maxhigh=max(high,maxhigh)
barsmaxhigh=barssince(high=maxhigh)
drawsegment(barindex[barsmaxhigh],Bbup[barsmaxhigh],barindex+10,Bbup[barsmaxhigh])style(line,2)coloured("red")
drawsegment(barindex[barsmaxhigh],Bbdown[barsmaxhigh],barindex+10,Bbdown[barsmaxhigh])style(line,2)coloured("red")
drawpoint(barindex[barsmaxhigh],maxhigh,2)coloured("blue")
endif
//------------------------------------------------//
//------------------------------------------------//
return bbUp as "BBUp" coloured("yellow")style(dottedline,2),Bbdown as "BBDown" coloured("yellow")style(dottedline,2), psar as "PSAR" coloured(r,g,b)style(point,2)
Hola, me gustaría tener un indicador donde dibuje por ejemplo en 4 velas de 15 minutos, lo que supone en una hora, es decir, que la vela de 1 hora envuelva las 4 de 15 minutos, sin relleno, ya que el relleno de la vela de 1 hora son las 4 de 15 minutos.
no sé dónde poner esto en el foro…..
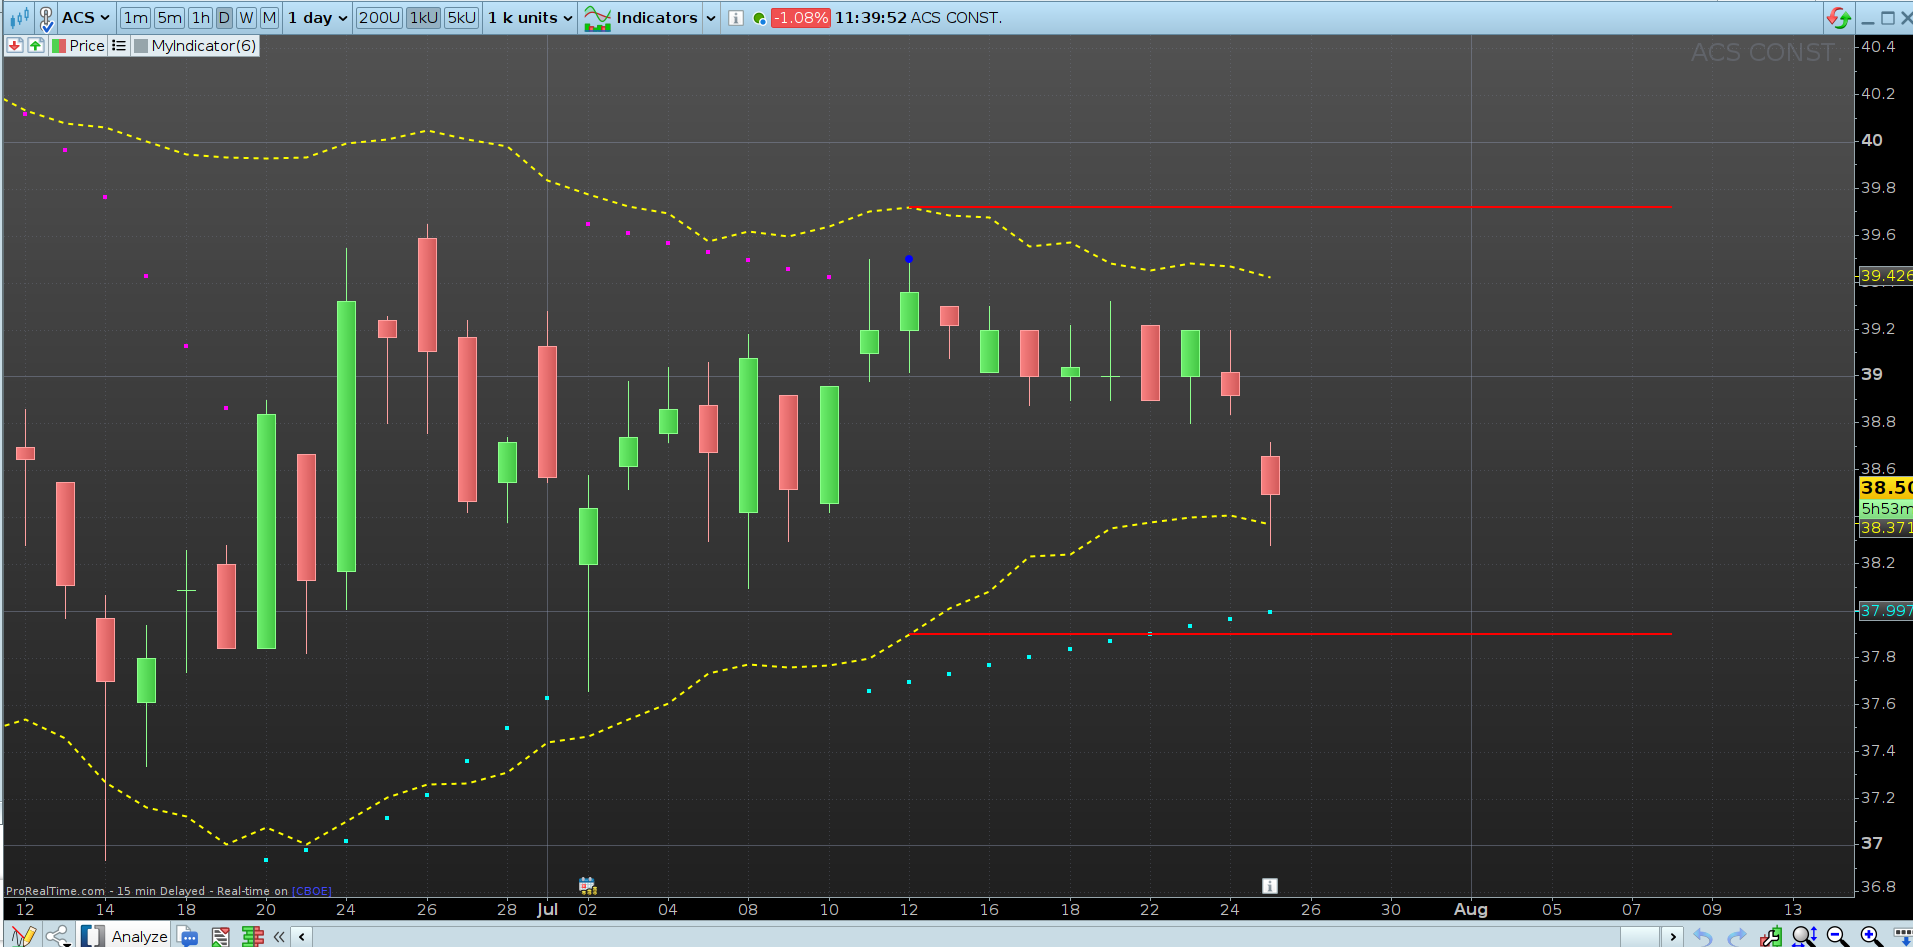
Buenas Iván, si me sale perfecto, pero al cambiarlo en alguna temporalidad me sale el siguiente error: Se espera un campo positivo con barsminLow. Y se me borra el indicador entero cuando sale es error. Como podría solucionarlo. Un saludo
Alguien me puede ayudar con este error. Un saludo
ok, escribe entonces max(1,barsminLow) y ya no te dará el error
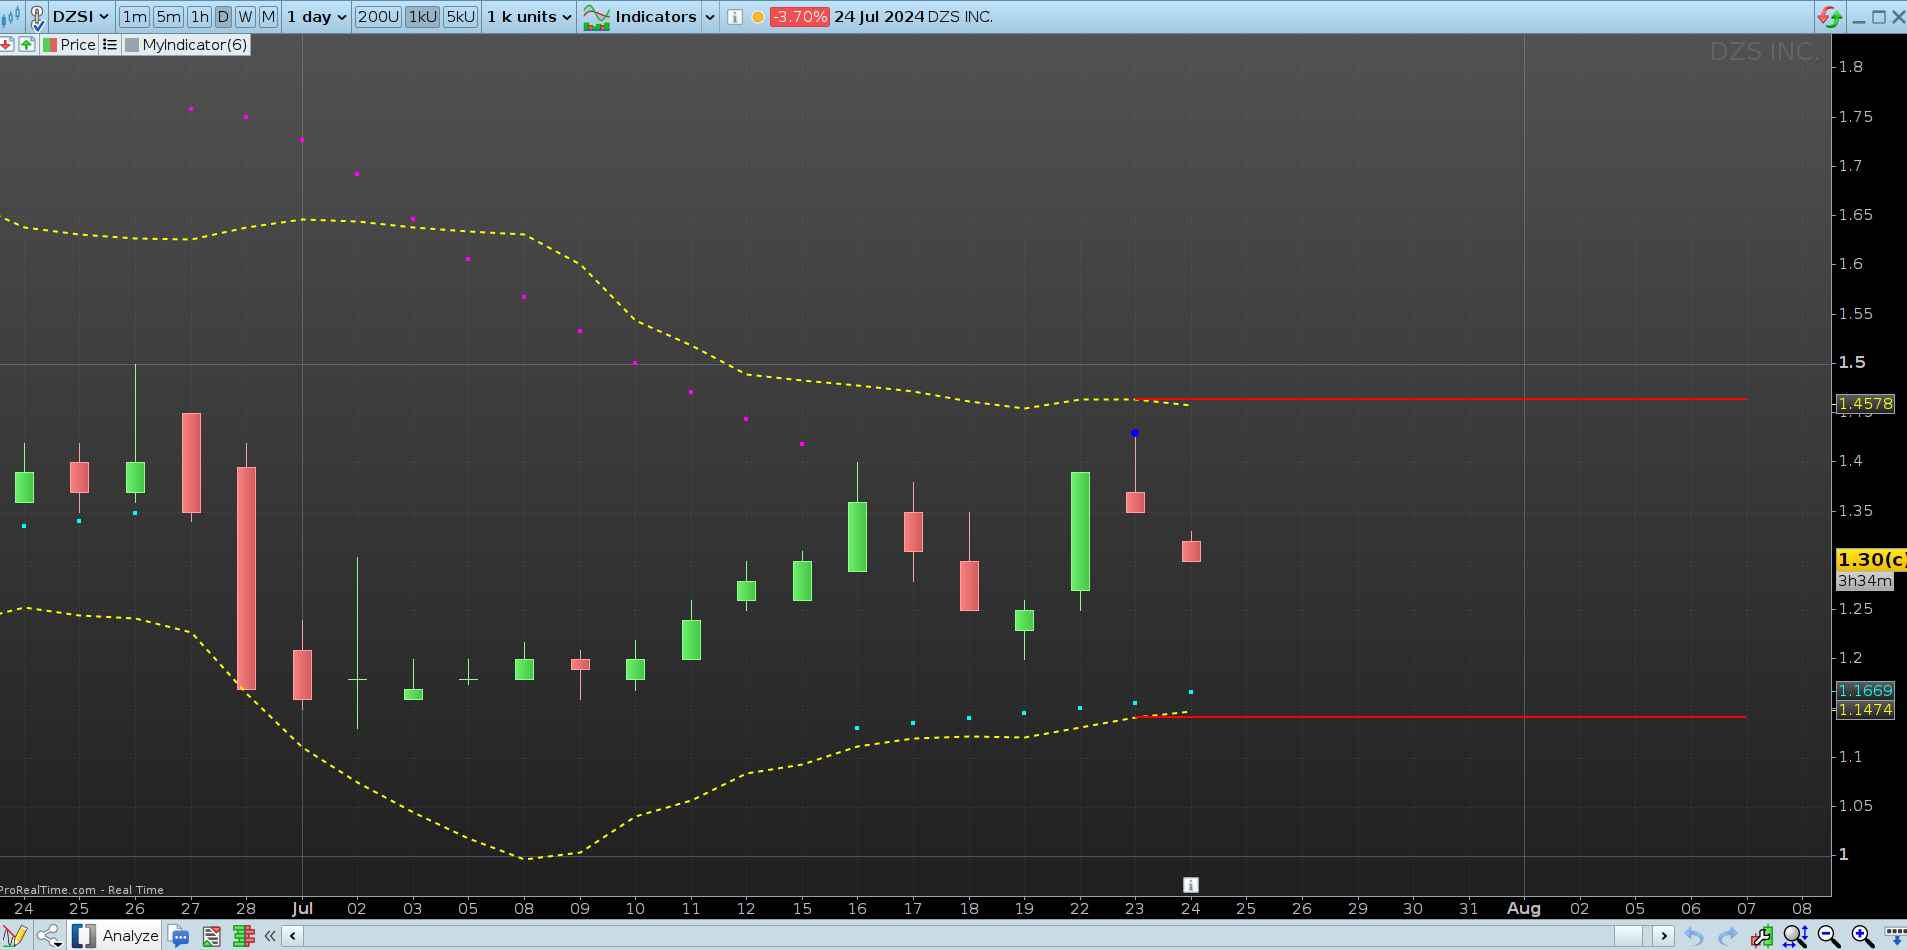
Buenas, despues de probarlo me da error ya que cuando hace un nuevo maximo funciona perfectamente y las lineas de dibujan en la vela actual pero cuando le toca hacer nuevos minimos las lineas se dibujas 1 mas atras que la actual y hace mal el indicador, no se como se podría solucionar. Un saludo