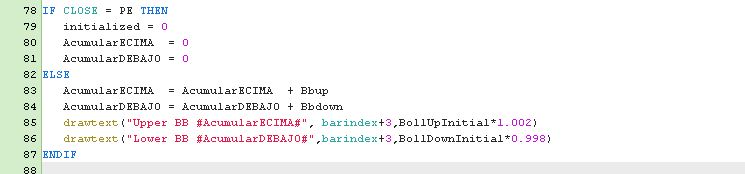
Lo edité como me pediste.
Cuando CLOSE = PE restablece las dos variables
- AcumularENCIMA
- AcumularDEBAJO
en caso contrario los acumula (y los imprime como se puede ver en las dos fotos adjuntas).
//src = customclose
//Ema3 = average[3,1](src)
//Ema9 = average[9,1](src)
//bUP = BollingerUp[20](src)
//bDN = BollingerDOWN[20](src)
//ONCE UpperPrice = src
//ONCE LowerPrice = src
//IF (Ema3 CROSSES OVER Ema9) OR (Ema3 CROSSES UNDER Ema9) THEN
//UpperPrice = bUP
//LowerPrice = bDN
//ENDIF
//return UpperPrice AS "UpperBB" style(DottedLine,2) coloured("Fuchsia"),LowerPrice AS "LowerBB" style(DottedLine,2) coloured("Fuchsia"),Ema3 AS "Ema3" style(line,1) coloured("Red"),Ema9 as "Ema9" style(line,1) coloured("Blue")
DEFPARAM DrawOnLastBarOnly = true
ONCE AcumularENCIMA = 0
ONCE AcumularDEBAJO = 0
// PUNTO EXTREMO AZUL
psar = SAR[0.02, 0.02, 0.2]
C1 = CLOSE > psar
C2 = CLOSE < psar
// Variables para controlar la tendencia
IF C1 AND NOT C1[1] THEN
CONTADOR = 1
TENDENCIAANTERIOR = 1
ELSIF C2 AND NOT C2[1] THEN
CUENTA = 1
TENDENCIAANTERIOR = -1
ELSIF TENDENCIAANTERIOR = 1 THEN
CONTADOR = CONTADOR[1] + 1
ELSIF TENDENCIAANTERIOR = -1 THEN
CUENTA = CUENTA[1] + 1
ENDIF
// Calcular el Punto Extremo (PE)
IF C1 THEN
IF CONTADOR > 1 THEN
PE = HIGHEST[CONTADOR](HIGH)
ELSE
PE = HIGH
ENDIF
DRAWSEGMENT(barindex + 510, PE, barindex[510], PE) COLOURED(0, 0, 255) STYLE(dottedline1, 3)
DRAWTEXT("sar", barindex, PE, Dialog, Bold, 20) COLOURED(0, 0, 255)
ENDIF
IF C2 THEN
IF CUENTA > 1 THEN
PE = LOWEST[CUENTA](LOW)
ELSE
PE = LOW
ENDIF
DRAWSEGMENT(barindex + 510, PE, barindex[510], PE) COLOURED(0, 0, 255) STYLE(dottedline1, 3)
DRAWTEXT("sar", barindex, PE, Dialog, Bold, 20) COLOURED(0, 0, 255)
ENDIF
// Bandas de Bollinger
ema20 = ExponentialAverage[20](close)
dev = 2
Bbup = ema20 + std[20](close) * dev
Bbdown = ema20 - std[20](close) * dev
// Variables para guardar los valores iniciales de las Bandas de Bollinger cuando CLOSE deja de estar en el PE
once BollUpInitial = 0
once BollDownInitial = 0
initialized = 0 // Usaremos 1 para inicializado y 0 para no inicializado
// Detectar el momento en que CLOSE deja de ser igual al PE y guardar los valores iniciales de las Bandas de Bollinger
IF CLOSE <> PE THEN
IF initialized = 0 THEN
BollUpInitial = Bbup
BollDownInitial = Bbdown
initialized = 1
DRAWTEXT("#BollUpInitial#", barindex, BollUpInitial) COLOURED(255, 0, 0)
DRAWTEXT("#BollDownInitial#", barindex, BollDownInitial) COLOURED(0, 0, 255)
ENDIF
ENDIF
// Reiniciar cuando CLOSE vuelva a ser igual al PE
IF CLOSE = PE THEN
initialized = 0
AcumularENCIMA = 0
AcumularDEBAJO = 0
ELSE
AcumularENCIMA = AcumularENCIMA + Bbup
AcumularDEBAJO = AcumularDEBAJO + Bbdown
drawtext("Upper BB #AcumularENCIMA#", barindex+3,BollUpInitial*1.002)
drawtext("Lower BB #AcumularDEBAJO#",barindex+3,BollDownInitial*0.998)
ENDIF
RETURN PE AS "PUNTO EXTREMO azul y verde" COLOURED("BLUE", 0)