Hi Inertia, my apologies I do not know what you mean by #70524, please paste here, I assure you I will be logged in here over the next few day to respond. My intention is not to avoid. Once again I apologies I simply havn’t been logged in here for some time now.
I have not found any strong strategies here, this is not a slight at anyone, it is my observation from countless backtest strategies. Some have worked, but for higher timeframes, 1 hour+ as PRT historically hasn’t calculated Stop hit first, inside tested bars, profit calculated before losses.
As was said before, for discussion. If statistical indicators work: MovingAverages, Oscilators etc – go ahead post 1 or 2 that works for: M1/M5/M15 time frames (since lower timeframe better mimics live P/L of an open positions).
To anyone knocking/trolling algorythmic trading the most successful fund on the planet is the Medallion Fund and it is 100% mathematical . Just putting it out there and for the gentleman saying Price action trading is the only way i hope you are aware its possible to mathematize any price action , of course this may be above your pay grade and once again i refer to this bit of gold
[attachment file=”80018″]
I have not said “they don’t work”, I’ve said (respectfully, just for observation) there are no functional strategies that work here. I’d share mine, but only among other positive strategies. I have commented that likely, overtime oscilators etc do not produce advantagious-positive and can be used by the market for knowing large retail trader entries and exits, buy/sell pools. I have said at best produce: 50:50 which can profitable, depending how is traded.
My challenge is to prove me wrong. Go!
My challenge is to prove me wrong. Go!
Put yourself in the shoes of all those on here who have profitable strategies and general methods that have taken them a lot of time, effort and dedication to create – why would they have any interest in sharing them just because you want to set a challenge?
As said before in this topic – any strategies either in the library or in forum topics are not there because the author thinks they are the holy grail – they are there for discussion, thought, further development and to add to the enjoyment that some people get from testing new ideas and maybe developing them further. Every non-profitable/failed strategy is a lesson for everyone including you. Your challenge is to use what is available here to improve your own strategies and thinking processes and maybe share all your failures and ideas along the way to help others to learn.
I could post a 100 enticing equity curves with no logic behind them but then i’d look like like a typical smug smartass and ive found utility companies dont take ego as payment
How do you tell the difference between a smug smartass equity curve with no logic behind it and a very good equity curve with logic behind it if the person posting it has not shared the code or the full strategy details with you?
If paying the bills is a worry then you should try living on a boat. You would not have any utility companies asking you for money and there is no room for an ego on a boat as the wind and the sea take no notice of egos.
If someone posts an equity curve they are most likely doing it to inspire others who are maybe still questioning how to be profitable rather than posting it to boost their own ego. Those viewing the equity curves can be either inspired by them or just plain cynical about them – that is their choice. Those who are inspired may use that inspiration to continue their journey to profitability and those who are cynical of every equity curve will learn nothing and carry on through life believing they already know everything.
Logicless uselss equity curve , what does it actually mean outside a #figjam , absolutely nothing say it again … rock on
Logicless uselss equity curve , what does it actually mean outside a #figjam , absolutely nothing say it again … rock on
You are absolutely correct. Your image is worthless unless posted in context to a subject being discussed. Then with the addition of a few details such as which market you are trading, what style of strategy it is, how long you have forward tested it on OOS data etc it becomes an inspiration for others to aim for. If it is something that you have just created and you clarify that when posting then everyone knows where they stand when considering whether it is truly possible. However as just an image posted on its own with no details or context then it could possibly be a FIGJAM or it could be your own personal holy grail – but without context no one else can possibly know and it is thus just an inspiration to yourself and maybe an ego boost if you are the type that needs that sort of thing.
 Leo
LeoParticipant
Veteran
That sort of Equity curve I got at the beginning. how? optimised dozens of parameters. Then with a super ego I run with real money those codes and the I learn in a very expensive way the concept of “over optimisation”
That sort of Equity curve I got at the beginning. how? optimised dozens of parameters. Then with a super ego I run with real money those codes and the I learn in a very expensive way the concept of “over optimisation”
Thank you Leo for sharing your real life experience for others to learn from.
There is a direct correlation between the number of lines of code and the level of curve fitting.
If we have more than one variable in a strategy we should start to worry about curve fitting. If we have just one variable in a strategy then its value needs to work over a large range of values. If we have two then combined they need to work over a large range of combined value combinations.
Through extensive forward testing of OOS data and dedicating our attentions to only a few markets it is possible to get a very good knowledge of what is curve fitted and what is not. Spread yourself too thin and you are a master of nothing.
Our interest when developing a strategy should be in whether our account can afford margin costs and draw downs and be profitable and not on trying to beat the market. The bigger the margin and draw down that we can handle the less likely we are to go broke and the more likely we are to be profitable. Unfortunately it is easier in life to make money if you start with a lot of money.
Don’t go live until you have back tests, forward tests and a hundred strategies based on a similar theory that are all profitable. Even then you might be wrong – but it is called spread BETTING for a reason. Just one line of code in your strategy could be the curve fit that is the difference between a massive profit and one day blowing up your account. Test them all until you are sick of looking for the weakness in your code and then when you go live expect everyday to be proven wrong. The markets are very good at proving people wrong so expect to lose money and only use money you are able to live without.
Just saying because when I have something to say, I say something.
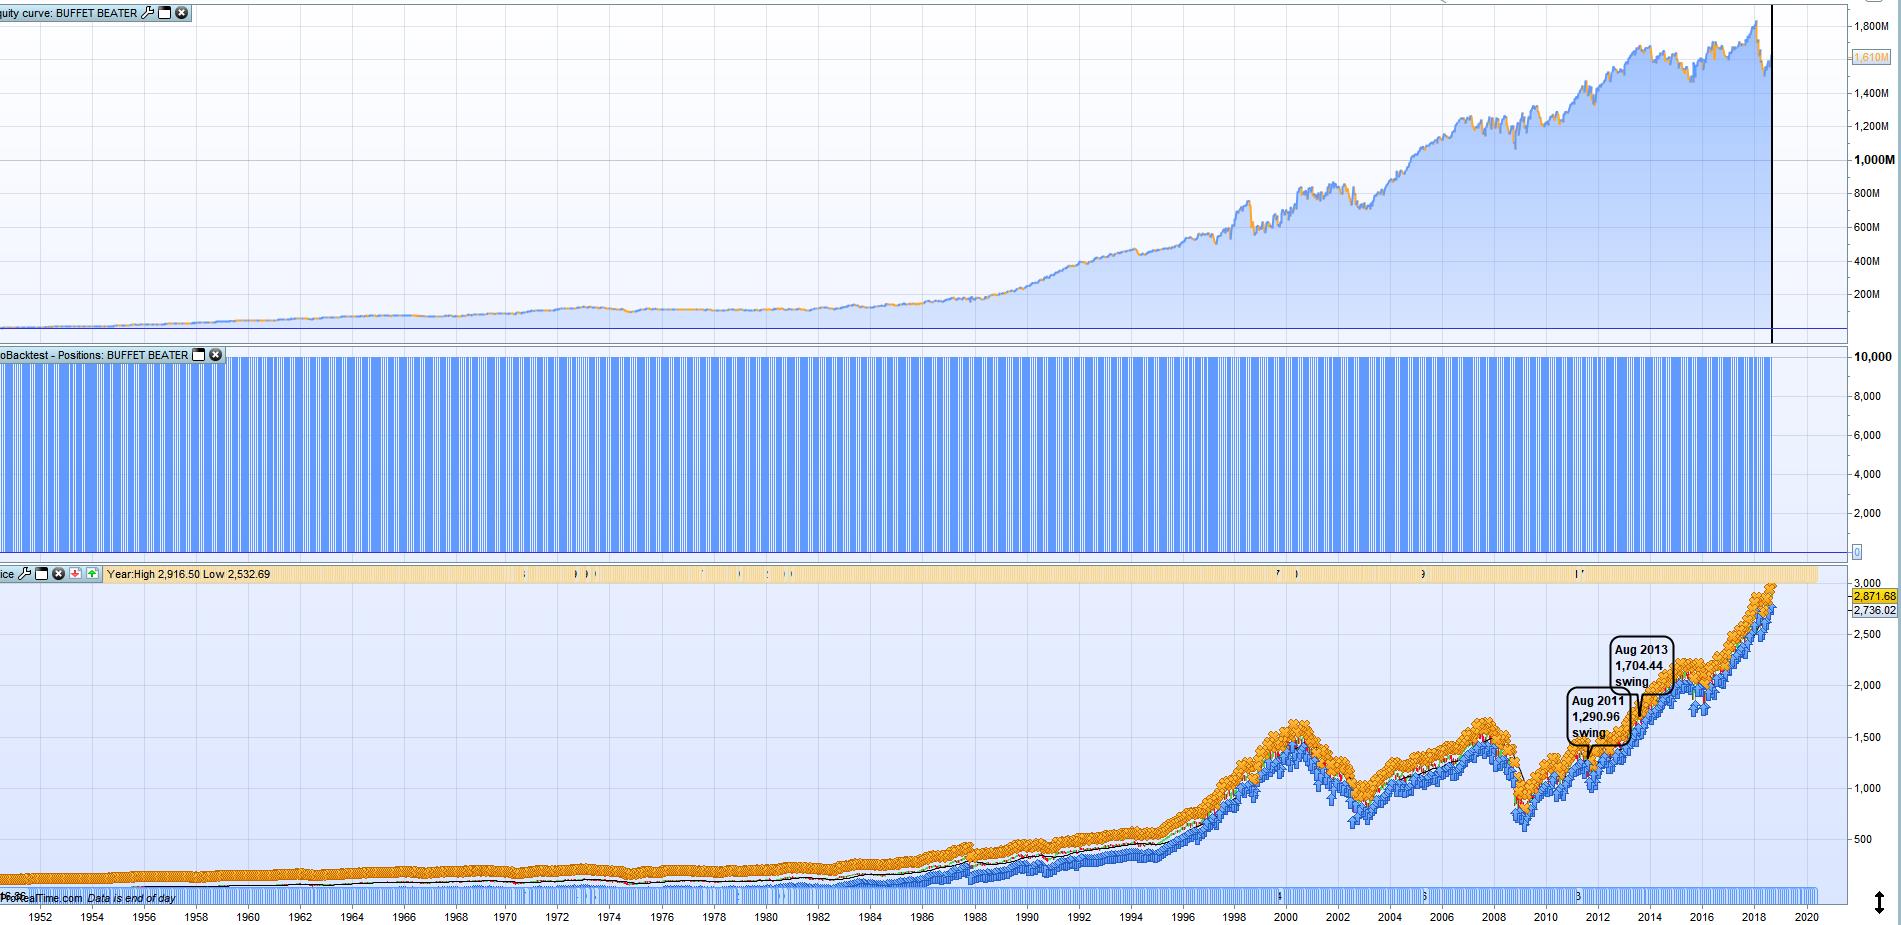
That curve is just from an experiment to prove/disprove a theory i saw one day , bit of practice writing code and a bit of fun , never intended for trading purposes . Interestingly enough the theory was pretty well correct although i dont see it as exploitable in any way
http://www.crossingwallstreet.com/archives/2010/02/seven-days-each-month-beats-the-market-by-a-lot.html
Funnily enough that is something I was playing with earlier this week after reading a similar article on it in TASC magazine.
I came to the same conclusion as you that it appeared to work but wasn’t a theory that I felt happy trading as the recent equity curve was much more volatile and less profitable than the earlier equity curve (I only consider 1995 onwards in my testing) indicating that as a method its effectiveness was reducing with time.
I was about to say the same thing, related to the TOME effect (turn of the month). Data mining at its best! (when it finds something 😆 )
Your statement “years in the making” is the entire purpose of this portion of the ProRealCode forum, clearly a query to the ProRealCode founder.
I have not asked for years of effort for free. Sell it to me if you like. I have set the challenge for 50:50 or better profitable examples that oscilators or price-averages lead to positive results. For me price action does, Oscilators do not (I hypothesised, but did not theorise as to why they do not work over time).
Where the reader may disagree, fine, demonstrate the same.
Should this been seen as anti rules or selfish a query on a strategy sharing forum?