Hello fellow speculators,
Can anyone recommend an indicator that helps to reduce market entries when the market takes a big dip into drawdown over a 7 or 14 day period.
As always any helps or advice appreciated.
Best of luck in your own trading endeavors.
The DrawDown is calculated on trades, so indicators need to simulate trades to be able to calculate it.
I’ll code an example later today.
I remember reading a year or two ago about overlaying your past trading system history performance over the top of your current system to highlight any potential weaknesses or drawdowns.
Apologies I’ve just rejoined the forum is this still viable ?
Many thanks in advance.
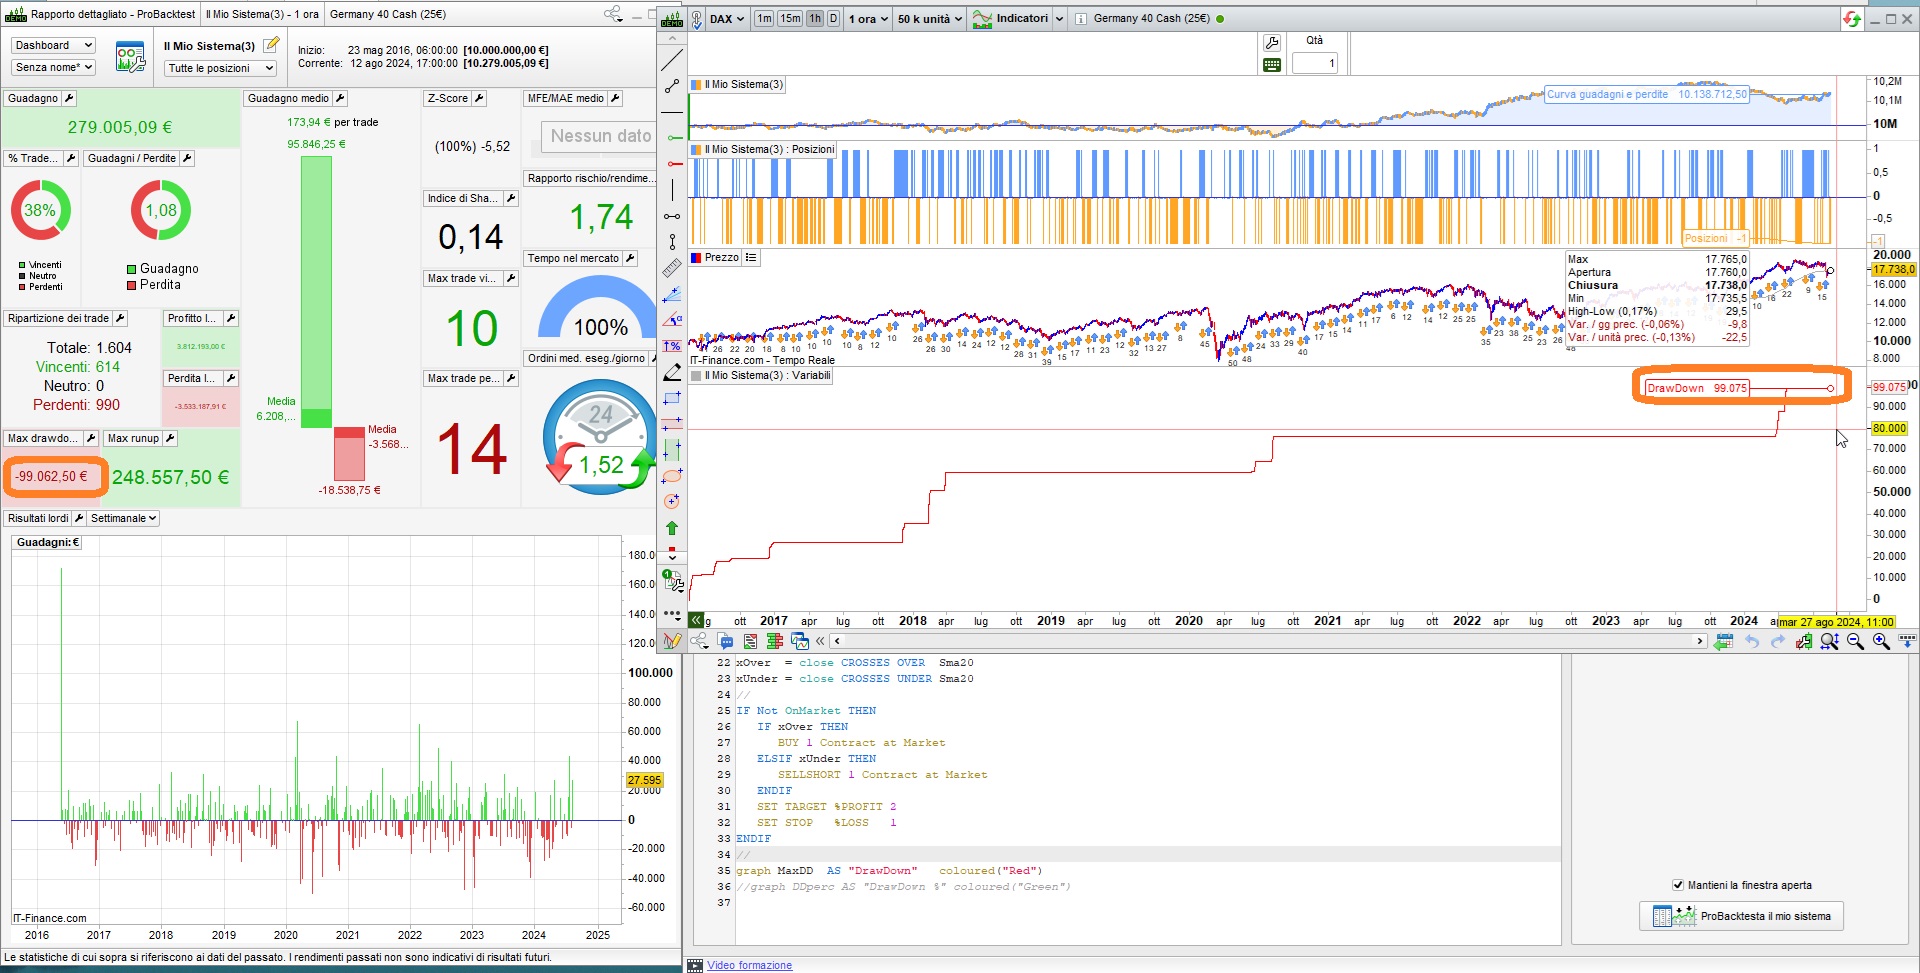
No problem Kovit, this is the code of a strategy that you can backtest and it will show you (with GRAPH) the DrawDown:
// DrawDown
//
ONCE Capital  = 10000
ONCE MinPoint = Capital
ONCE MaxPoint = 0
ONCE MaxDD    = 0
//------------------------------------------
//       EQUITY
Equity        = Capital + StrategyProfit
TempProfit    = PositionPerf * PositionPrice / PipSize * PipValue //   / abs(CountOfPosition)
TempEquity    = Equity + TempProfit
//------------------------------------------
//       DrawDown
MaxPoint      = max(MaxPoint,TempEquity)
DD            = MaxPoint - TempEquity
MaxDD         = max(MaxDD,DD)
DDperc        = MaxDD * 100 / Capital
//
//------------------------------------------
//
Sma20  = average[20,0](close)
xOver  = close CROSSES OVER  Sma20
xUnder = close CROSSES UNDER Sma20
//
IF Not OnMarket THEN
   IF xOver THEN
      BUY 1 Contract at Market
   ELSIF xUnder THEN
      SELLSHORT 1 Contract at Market
   ENDIF
   SET TARGET %PROFIT 2
   SET STOP   %LOSS   1
ENDIF
//
graph MaxDD  AS "DrawDown"   coloured("Red")
//graph DDperc AS "DrawDown %" coloured("Green")
in the strategy you can use MaxDD to make decisions on what to do with your trades. The attached pic X shows that the DrawDown is almost equal to that of the backtest (just a few euros, due to rounding, I guess).
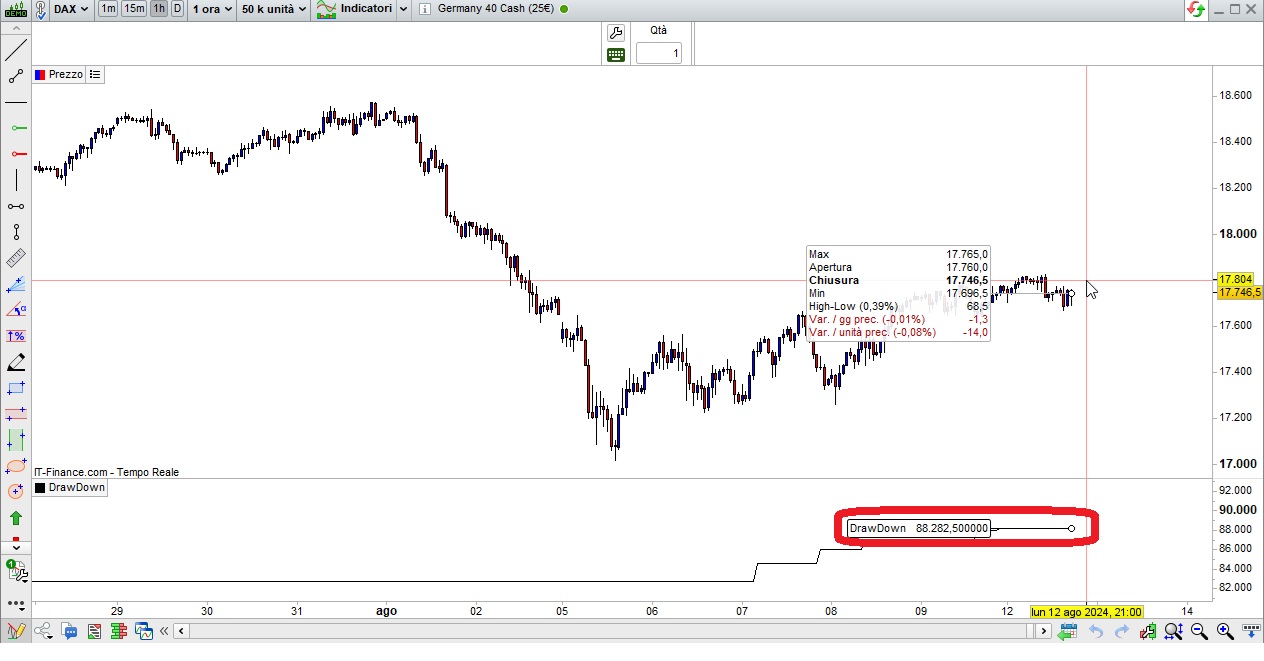
This is the same code (which simulates the same trades) to be used as an indicator:
//------------------------------------------
//
ONCE OnMarketStatus = 0
NotOnMarketStatus   = Not OnMarketStatus
ONCE LongStatus     = 0
ONCE ShortStatus    = 0
//
ONCE SL = 1
ONCE TP = SL * 2
//
IF LongStatus THEN
myProfit       = close - myPositionPrice
myPositionPerf = myProfit / myPositionPrice
IF myProfit >= myPositionPrice THEN
myStrategyProfit  = myStrategyProfit + (myProfit / PipSize * PipValue)
LongStatus        = 0
OnMarketStatus    = 0
NotOnMarketStatus = Not OnMarketStatus
ELSIF myProfit < myPositionPrice THEN
myStrategyProfit = myStrategyProfit - (myProfit / PipSize * PipValue)
LongStatus        = 0
OnMarketStatus    = 0
NotOnMarketStatus = Not OnMarketStatus
ENDIF
ELSIF ShortStatus THEN
myProfit       = myPositionPrice - close
myPositionPerf = myProfit / myPositionPrice
IF myProfit >= myPositionPrice THEN
myStrategyProfit  = myStrategyProfit + (myProfit / PipSize * PipValue)
ShortStatus       = 0
OnMarketStatus    = 0
NotOnMarketStatus = Not OnMarketStatus
ELSIF myProfit < myPositionPrice THEN
myStrategyProfit  = myStrategyProfit - (myProfit / PipSize * PipValue)
ShortStatus       = 0
OnMarketStatus    = 0
NotOnMarketStatus = Not OnMarketStatus
ENDIF
ENDIF
//------------------------------------------
// DrawDown
//
ONCE Capital  = 10000
ONCE MinPoint = Capital
ONCE MaxPoint = 0
ONCE MaxDD    = 0
//------------------------------------------
//       EQUITY
Equity        = Capital + myStrategyProfit
TempProfit    = myPositionPerf * myPositionPrice / PipSize * PipValue //   / abs(CountOfPosition)
TempEquity    = Equity + TempProfit
//------------------------------------------
//       DrawDown
MaxPoint      = max(MaxPoint,TempEquity)
DD            = MaxPoint - TempEquity
MaxDD         = max(MaxDD,DD)
DDperc        = MaxDD * 100 / Capital
//
//------------------------------------------
//
Sma20   = average[20,0](close)
xOver   = close CROSSES OVER  Sma20
xUnder  = close CROSSES UNDER Sma20
//
IF NotOnMarketStatus THEN
LongStatus  = 0
ShortStatus = 0
IF xOver THEN
Entry             = close
myPositionPrice   = Entry
LongStatus        = 1
ShortStatus       = 0
OnMarketStatus    = 1
ELSIF xUnder THEN
Entry             = close
myPositionPrice   = Entry
ShortStatus       = 1
OnMarketStatus    = 1
NotOnMarketStatus = Not OnMarketStatus
myPositionPerf    = 0
ENDIF
NotOnMarketStatus   = Not OnMarketStatus
myPositionPerf      = 0
ENDIF
//
RETURN MaxDD AS "DrawDown"//,DDperc AS "DrawDown %"
in this case the DrawDown shows a significant difference (as from attached pic Y), due to slippage and exit at the closing of a bar.
I am attaching the ITF files for both the Indicator and Strategy.