Dear all,
Please help me to develop the following detection system.
The pattern is based on 4 candles in sequence. Here the requirements/parameters in example:
1)First candle must have a size = *multiplier* of ATR (let’s assume 1,2*ATR(20)) and 60% of his Volume must be constituted by the body.
2)Second candle must have the same direction of the previous one (so, both green or red) and must have the same features with 20% of tolerance (so, 1,2*ATR +/20% and/or 60% +/-20% of body over total). 20% is considered on 60% value (so, equal to +/- 12% in this example)
3)The third Candle has to be “opposite” (so, for 2 green, it must be red or vise versa) and must engulf the previous candle (it must close above or below, i don’t care about high or low)
4)The fourth one needs just to make a new low (if third is red) or new high (if third is green) to validate the pattern. No additional requirements needed.
Please, i need an indicator which allow me to customize the parameters explained without modifying the code (i don’t know coding language). So, parameters customizable for each first 2 candles are:
- ATR period;
- ATR Multiplier (from 0,1 to 3 is enough);
- Body % over total size (i used 60% in this case, but should be customizable as described);
- Tolerance %.
Thanks for help!
This is the code I wrote. I only tested it for syntax errors.
I attach the ITF file to be imported into ProBuilder.
DEFPARAM CalculateOnLastBars = 10000
//AtrMultiplier = 1.20        //1.20   ATR multiplier
//BodySize      = 0.60        //60%    minimum Body size (compared to Range)
//Tolerance     = 0.20        //20%    tolerance
MaxTolerance  = 1 + Tolerance
MinTolerance  = 1 - Tolerance
Body          = abs(close - open)
MaxBody       = BodySize * MaxTolerance
MinBody       = BodySize * MinTolerance
Bullish       = close > open
Bearish       = close < open
MyAtr         = AverageTrueRange[14](close) * AtrMultiplier
MyAtrMax      = MyAtr * MaxTolerance
MyAtrMin      = MyAtr * MinTolerance
Candle1       = (range[3] >= MyAtr[3]) AND (Body[3] >= (range[3] * BodySize))
Candle2       = (Bullish[3] AND Bullish[2]) OR (Bearish[3] AND Bearish[2])
Candle2       = Candle2 AND ((range[2] >= MyAtrMin[2]) AND (range[2] <= MyAtrMax[2]))
Candle2       = Candle2 AND ((Body[2] <= (range[2] * MaxBody)) AND (Body[2] >= (range[2] * MinBody)))
Candle3       = (Bullish[3] AND Bullish[2] AND Bearish[1]) OR  (Bearish[3] AND Bearish[2] AND Bullish[1])
IF Bullish[3] THEN
   Candle3    = (Candle3 AND (close[1] < open[2]))
ELSIF Bearish[3] THEN
   Candle3    = (Candle3 AND (close[1] > open[2]))
ELSE
   Candle3    = 0
ENDIF
Candle3       = (Candle3 AND (range[1] >= MyAtr))
Candle4       = ((Bullish[1]) AND (high > high[1])) OR ((Bearish[1]) AND (low < low[1]))
Result        = Candle1 AND Candle2 AND Candle3 AND Candle4
RETURN Result
When you post your feedback, in case of unexpected results, please post:
- instrument
- TF used
- value set with the indicator properties for the three variables
- opentime/date of the candle when the pattern has incorrectly been reported or when it should have been correctly reported.
Thank you.
Buongiorno Roberto,
Ho importato l’indicatore. Dovrebbe visualizzarmi il pattern anche nei dati storici vero? Non solo su quelli in real time?
Ad un primo acchitto non vedo nessuna segnalazione di pattern conforme. Cmq adesso farò delle prove e le farò saprere. Intanto ringrazio
PS
Come dovrei visualizzare il pattern? Intendo…c’è una colorazione speciale delle quattro candele? Una freccia? Grazie
Good morning Roberto,
I imported the indicator. Should the pattern be displayed in historical data too? Not only on those in real time?
At first glance I do not see any conformal pattern signaling. Anyway now I will do some tests and I will let them know. Meanwhile, thank you
PS
How should I view the pattern? I mean … is there a special coloring of the four candles? An arrow? Thank you
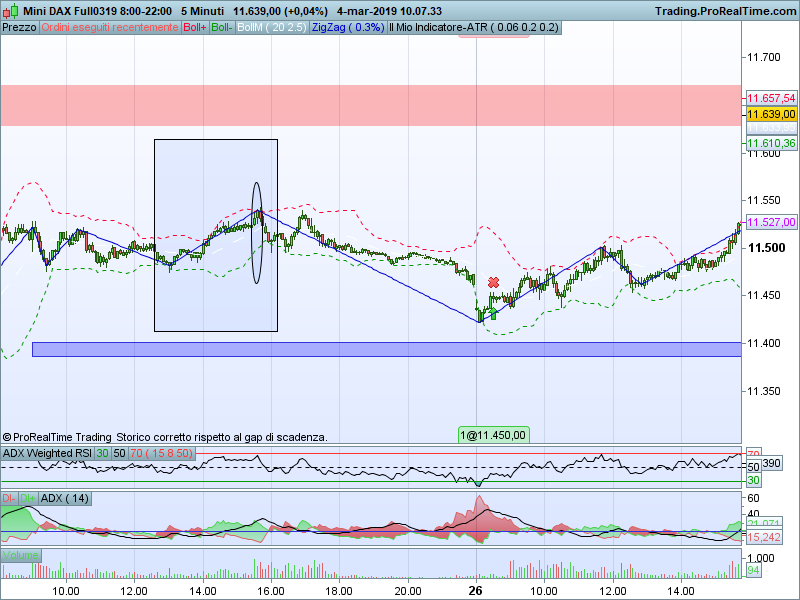
Nel frattempo allego un immagine in cui mi “aspettavo” una segnalazione.
Dax 5 min TF, 25/02/2019 ore 15:30. Ho impostato ATR a 0,01 e Body a 0,2 per ridurre al “minimo” il filtraggio. Tolerance sempre a 0,2.
A me a occhio pare che il pattern rispetti a pieno i requisiti. L’ellisse è disegnata un pò male, taglia la quarta candela che cmq di fatto va sotto la terza, che engulfa perfettamente la seconda.
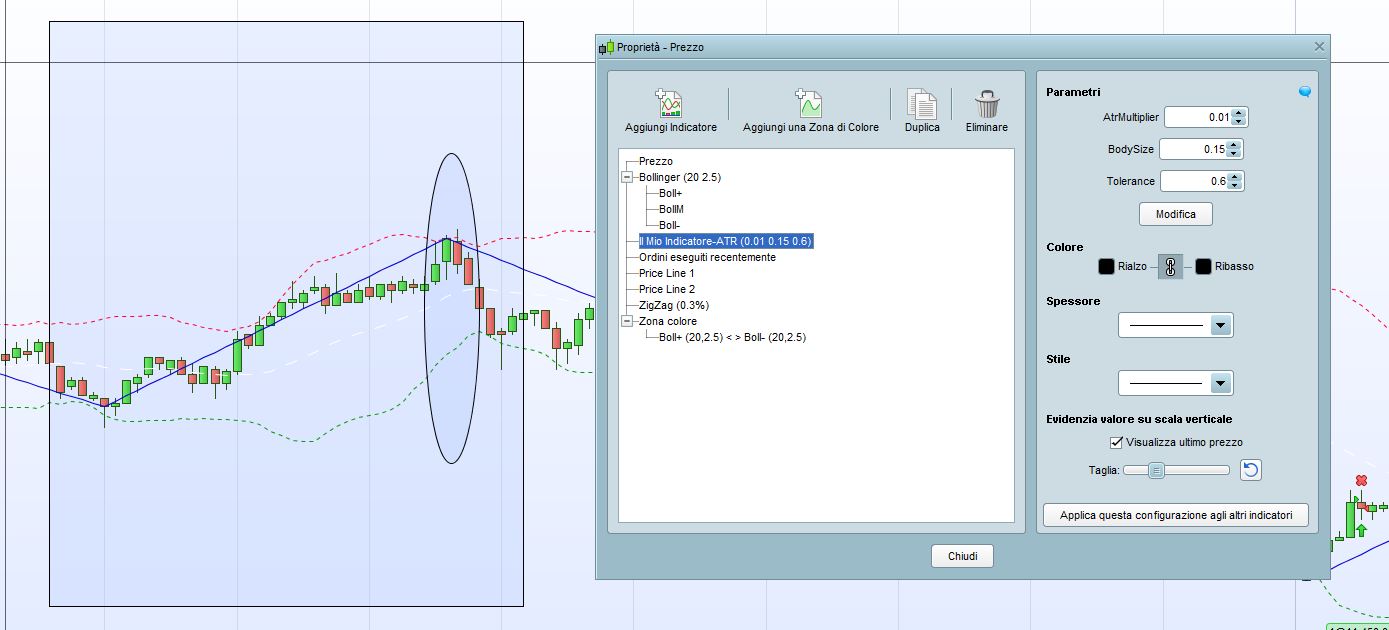
Inoltre mi pare che l’ATR non sia modificabile in periodi (mi serve customizzabile)
Grazie
In the meantime I am attaching an image in which I “expected” a report.
Dax 5 min TF, 25/02/2019 at 15:30. I set ATR to 0.01 and Body to 0.2 to reduce filtering to “minimum”. Tolerance always at 0.2.
It seems to me that the pattern fully complies with the requirements. The ellipse is drawn a little bad, cut the fourth candle that cmq actually goes under the third, which engulfs the second perfectly.
Also I think that the ATR is not editable in periods (I need customizable)
Thank you
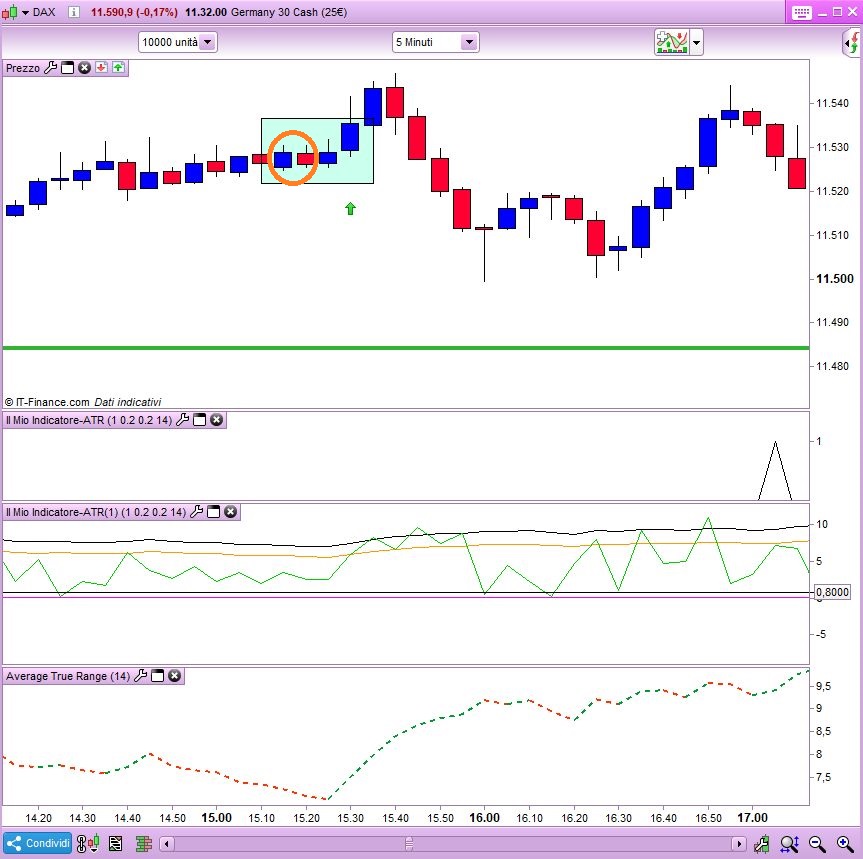
Altra immagine migliorata con parametri abbassati per evitare eccessivo filtraggio
Another image improved with lowered parameters to avoid excessive filtering
Please speak english on the english forum.
The indicator returns a line having values of either 0 or 1, so it will look like a triangle when a pattern is detected.
I can draw arrows on the price chart, if you prefer.
I will add a variable for the ATR.
I will also take a look at your pics later this evening or tomorrow morning.
The triangle is a nice choice, thank you.
Yeah, i need atr parameter. Please check images, they seems to match the requirements.
Thanks
Hello Roberto,
Any news about small fixes for the indicator?
Thanks
This is version 2:
//-----------------------------------------------------------------------------------------------------------------------------------------
//
// Versione 2
//
DEFPARAM CalculateOnLastBars = 5000
//AtrMultiplier = 1.20        //1.20   ATR multiplier
//BodySize      = 0.60        //60%    minimum Body size (compared to Range)
//Tolerance     = 0.20        //20%    tolerance
//AtrPeriods    = 14          //14     periods
MinTolerance  = 1 - Tolerance
Body          = abs(close - open)
MinBody       = BodySize * MinTolerance
Bullish       = close > open
Bearish       = close < open
MyAtr         = AverageTrueRange[AtrPeriods](close) * AtrMultiplier
MyAtrMin      = MyAtr * MinTolerance
Candle1       = (range[3] >= MyAtr[3]) AND (Body[3] >= (range[3] * BodySize))
Candle2       = (Bullish[3] AND Bullish[2]) OR (Bearish[3] AND Bearish[2])
Candle2       = Candle2 AND ((range[2] >= MyAtrMin[2]))
Candle2       = Candle2 AND (Body[2] >= (range[2] * MinBody))
Candle3       = (Bullish[3] AND Bullish[2] AND Bearish[1]) OR  (Bearish[3] AND Bearish[2] AND Bullish[1])
IF Bullish[2] THEN
   Candle3    = (Candle3 AND (close[1] < open[2]))
ELSIF Bearish[2] THEN
   Candle3    = (Candle3 AND (close[1] > open[2]))
ELSE
   Candle3    = 0
ENDIF
Candle4       = ((Bullish[1]) AND (high > high[1])) OR ((Bearish[1]) AND (low < low[1]))
Result        = Candle1 AND Candle2 AND Candle3 AND Candle4
RETURN Result
I added a variable to set ATR periods with the indicator’s properties.
As for Dax 5 min TF, 25/02/2019 at 15:30, candles 4 and 3 were not the same direction. There should be a valid pattern on 25/02/2019 at 17:05.