I just read this article about using the 12:1 theory for trend following and so thought I would try out it out.
https://blog.thinknewfound.com/2018/03/protect-participate-managing-drawdowns-with-trend-following/
Basically you take the return over the last 12 months and subtract the return from the last month. If the result is positive then you should be long and if it is negative then you should be short or in cash.
I added it to a very simple long time frame long only strategy and it seemed to work quite well. Draw down was very low. It seemed to be improved by adding a ‘no trading band’ – so you only go long once the 12:1 result is for example above 200 and then do not sell or short unless it is below -170 for example. I’m imagining that this is best for a major index filter.
I wrote a couple of simple indicators and post them here in case anyone is interested.
Other’s thoughts on this as a trend filter method would be most welcome.
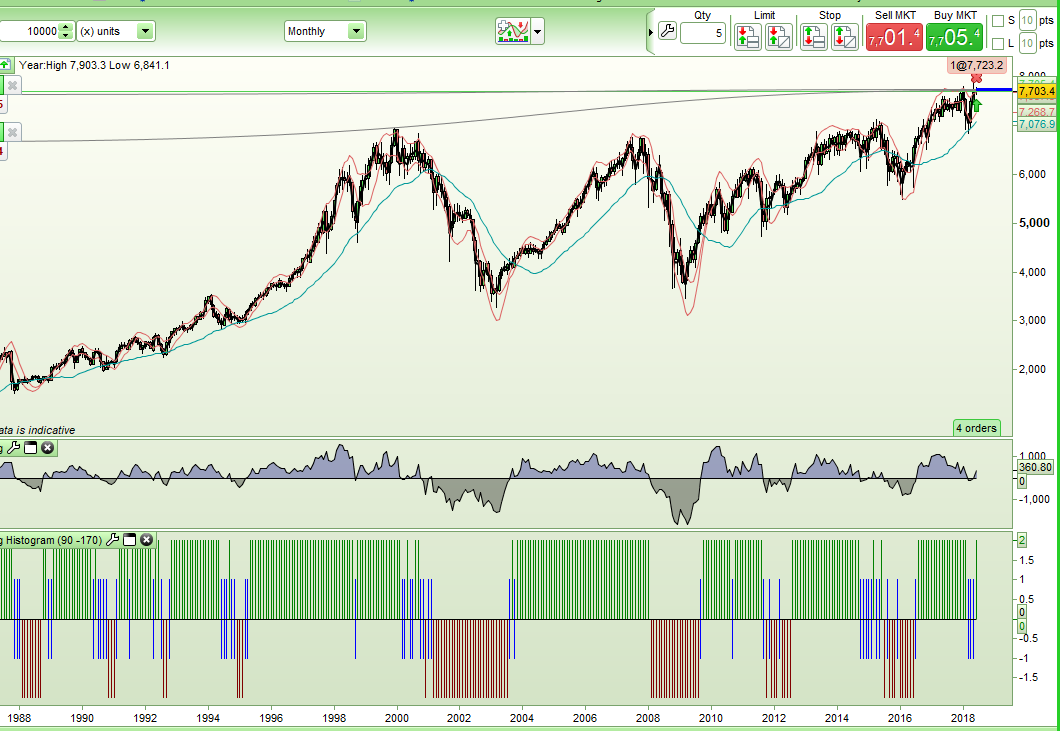
This is an image of the indicators applied to a FTSE100 monthly chart.
[attachment file=72779]
//12:1 Trend Following Graph

a = (close - open[11]) - (close - open)

Return a, 0
//12:1 Trend Following Histogram

LongLevel = 200
ShortLevel = -170

a = (close - open[11]) - (close - open)

UpFlag = 1
DnFlag = -1
R = 0
G = 0
B = 255

if a > LongLevel then
UpFlag = 2
DnFlag = 0
R = 0
G = 128
B = 0
endif

if a < ShortLevel then
UpFlag = 0
DnFlag = -2
R = 128
G = 0
B = 0
endif

Return UpFlag coloured(R,G,B) Style(Histogram, 2) as "Up Trend", DnFlag coloured(R,G,B) Style(Histogram, 2) as "Down Trend", 0
I’m a little surprised that no one is interested in discussing this 12: 1 filter method? I thought that everyone was always looking for that one filter to keep them out of bad trades!
Maybe an example of the filter in action will help. I am working on a long only daily strategy that appears to be very profitable but the draw down can be very big. The worst draw down is obviously likely to occur when markets are falling so I thought that I would apply the 12: 1 filter to it to see what happened. This is just the straight filter with no no-trading band – it is either on or off.
This is the strategy without the filter. Over 16k drawdown at one point!
[attachment file=”Without 12 1 filter.png”]
…and this is with it filtered. Just 4k draw down now. Yes the average gain is down and so is the number of trades and so is the gain/loss ratio but that is because this strategy uses the averaging down idea that I mention in another topic so it now does not have the big added to positions that suddenly become very good when the position goes into profit. The important thing is that by only being long when the 12:1 rule told us trend was in our favour we reduced our exposure to draw down by 75%.
[attachment file=”With 12 1 filter.png”]
Note: As it is a daily strategy and the 12:1 filter was designed for monthly charts I have used the following to try to represent 12 months and 1 month:
Filter = (close - open[288]) - (close - open[24])
 BC
BCParticipant
Master
How about on weekly basis?
The strategy is a “single momentum” ranking system. You can use it to rank a stocks universe and do rebalancing each month. Would be great to make portfolio in ProOrder! 😐
About averaging down, IMO this is a waste of time. Even a random entry strategy should work in this case 😉
Even a random entry strategy should work in this case
Which is pretty much what we are all doing anyway. One man’s sell is another man’s buy – that is pretty random if you ask me.
If we were actually to have an edge with our entry then averaging down should benefit that if done right. I am not suggesting just keep buying and buying as price falls I am suggesting that you take your one set amount that you are willing to risk on that trade and divide it into separate orders and then use averaging down to get a better overall entry point.
Really with this topic I am just trying to work out the best way to average down if one were to use it. So far my calculation shown here seems to be the best that I have come up with so far so some ideas for other ways would be great – even if it is just an idea and not a completed code.
Just realised that I am now discussing averaging down in the 12:1 filter strategy topic!
How about on weekly basis?
The filter is apparently normally used on a monthly chart to assess an overall picture of the markets so that is what I have done in the above strategy. It opens no new trades if the filter says no. Although in the above strategy would open extra positions if it already had one position open as it adds to positions averaging down to get a better entry point.
I guess the theory of working out the gain over a period and then subtracting the gain or loss from the last chosen percentage of the period could be used as a filter for any time frame and with any period and any period subtracted.
So for example you could have 12:2
Period = 12
Divider = 6

Filter = (close - open[Period - 1]) - (close - open[(Period / Divider) - 1])
Above added, as row 40, to here Snippet Link Library
I also added a note to read this whole Topic
GraHal – you are just one big snippet Hoover! 🙂
I am not suggesting just keep buying and buying as price falls I am suggesting that you take your one set amount that you are willing to risk on that trade and divide it into separate orders and then use averaging down to get a better overall entry point.
That’s clever, but in this case why not take your loss on the first trade and wait for another real signal for re-entering? You are just betting that the price will come in your favor .. one day.
What I was pointing to you, is that, when averaging down, it is not necessary to trigger orders on a very elaborated strategy, because averaging down is pretty much like taking a loss and doing a martingale on the next trade, and so on.
You are just betting that the price will come in your favor .. one day.
Which with most major indices it will. You just have to hope that the dips along the way are not too big! Markets have changed over time also. Trading rules have been put into place that prevent shorting when stocks fall too far too quickly and only allow buying at a higher tick. A slow and steady decline in a world wide recession could still happen but I think that the markets are very different beasts today compared to the flash crashes of before. Plus there is now so much money out there that is dependent on the market values going up that I think major sudden declines are hopefully a thing of the past. This is why I am re-checking out averaging down (or getting a better entry as I like to think of it) with testing mainly based on data since 2000.
I am looking at the bigger picture of major indices on daily or weekly charts and would never consider something like this that is close to martingale on short time frame charts – that would be suicide. I am thinking more Buffet than martingale suicide!
Which with most major indices it will.
Yes, by looking at past charts, you know it, but if you don’t want to exit in loss, it is even not necessary to do backtests, because you already know that you’ll always win at the end 🙂 So don’t waste your time doing backtests, because you are already a millionaire.
I hope you are understanding the philosophy of what I’m trying to expose here! 😉
Anyway, we are off topic!
So back on topic and hopefully the naughty Keymaster will not take us off topic again 🙂
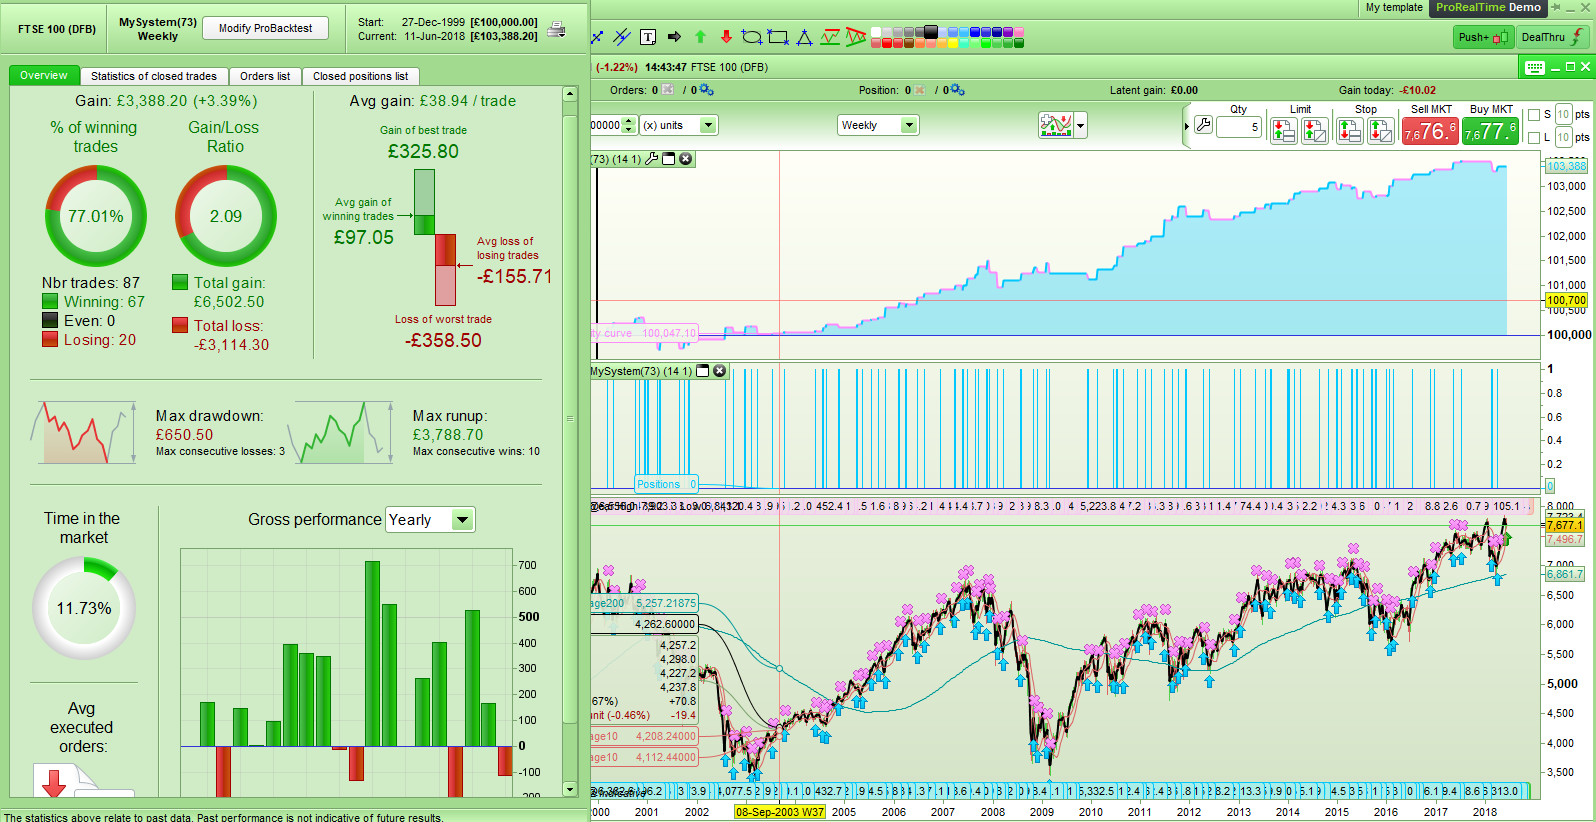
I decided to try the 12:1 filter on another strategy. This is a very simple FTSE100 weekly strategy that does not hang around in the market for very long considering the time frame used. Here is the results since 2000 with no filter:
[attachment file=73357]
Not bad – it is not going to make any one a millionaire at minimum stakes but a gain/loss ratio of 2.09 and 77% winning trades is pretty good. £39 per trade gain and only £650 draw down.
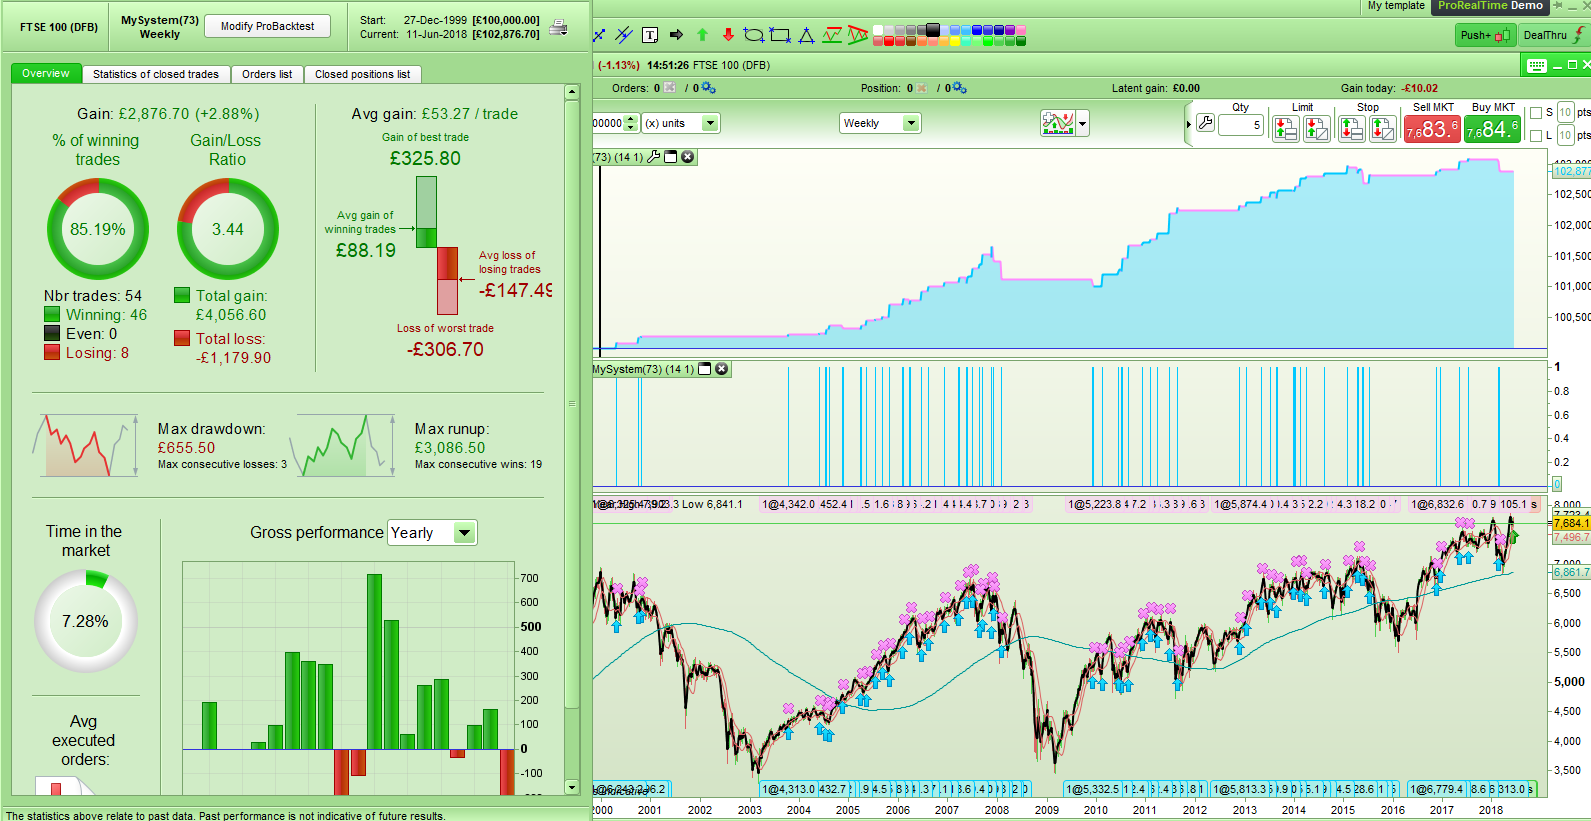
…and now here is the identical strategy with the following filter added:
Filter = (close - open[51]) - (close - open[3])
[attachment file=73358]
The equity curve is not so pretty to look at but the numbers seem to suggest that it is a worthwhile filter. Gain/loss ratio up to 3.44 and win rate up to 85%. £53 per trade gain and still only £655 draw down.
Initial tests seem to show that for at least these longer time frame strategies that it is a filter worth considering although we do have to consider that in this strategy the number of trades is a pretty small sample but we can see that it kept a long only strategy out of the market during the major downturns.
Could be an interesting system with averaging down and markov chains
Really interesting! I have been thinking about similar ways of filtering trends recently.
I can’t contribute with anything as of now as I don’t have access to my computer, but I will dig into it asap. This could come in really handy with the upcoming MTF feature!
Cool topic, I hope it gets more attention.
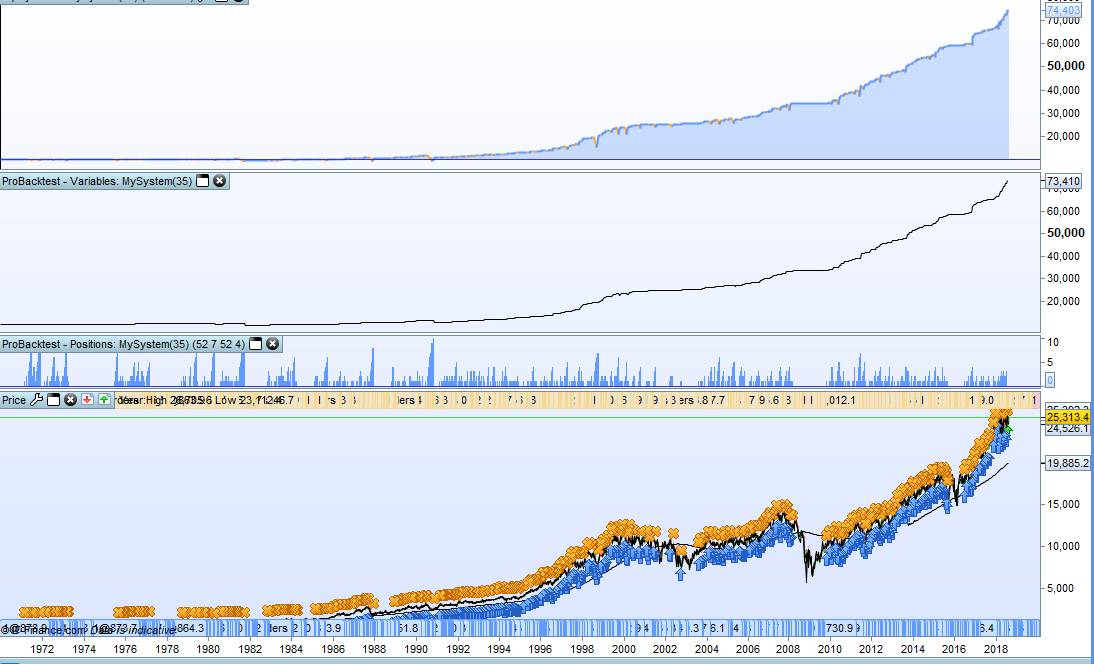
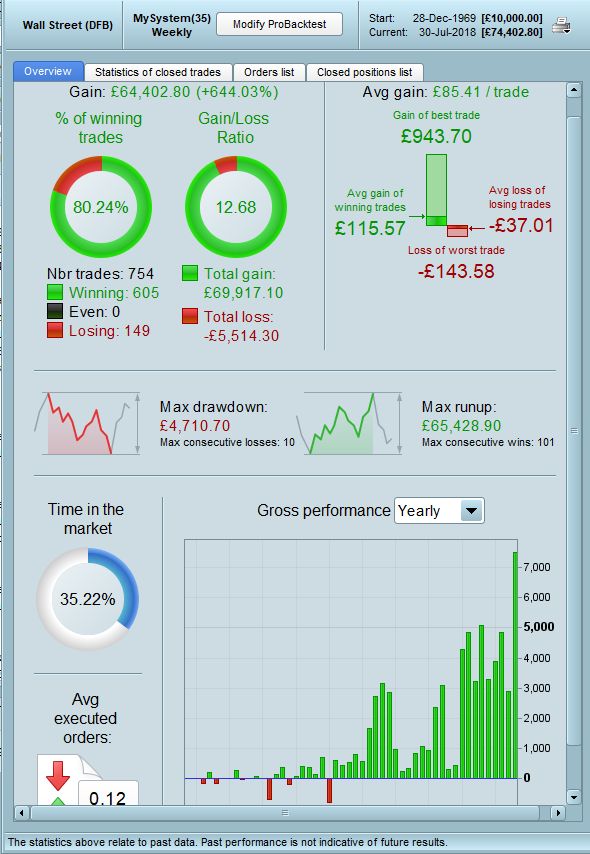
For some strange reason I suddenly decided to return to looking at the 12:1 filter this morning. I wrote a DJI weekly strategy that uses two different ’12:1′ filters to decide on market entry. They are not set to 12: 1 but different ratios obviously as 12:1 is for monthly markets. The exit is probably as important if not more important than the entry but I will keep that as my little secret!
The results were rather pleasing. This is with spread of 3.8 and level stake of 1. The maximum draw down compared to the overall profit is very good in my opinion. I think this sort of filter has great potential from looking at these results and is definitely worth further experimenting with. This strategy is definitely one that I will put on forward test.
[attachment file=77149]
[attachment file=77150]