🤔 Range Bar countdown…

Viewing 5 posts - 1 through 5 (of 5 total)

  • Author
    Posts
  • #248129 quote
    MattMatt
    Participant
    Junior
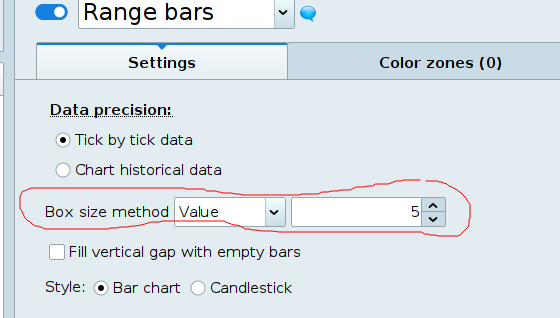
    Hi, Is it possible to get the countdown to bar close for range bars, displayed on the vertical axis as per normal candlesticks? Thanks
    #248142 quote
    Iván GonzálezIván González
    Moderator
    Legend
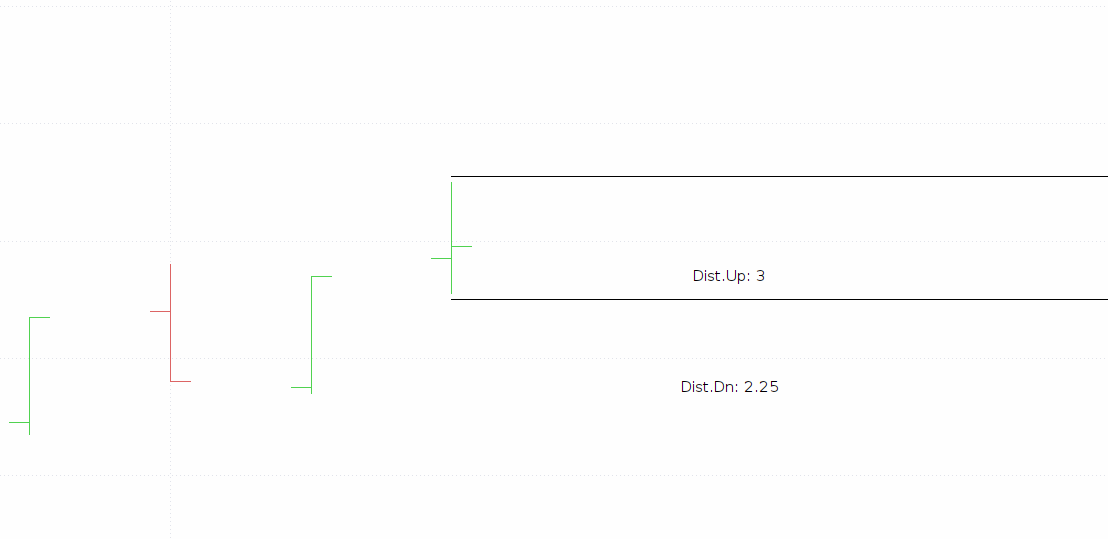
    Hi, here you have:
    defparam drawonlastbaronly=true
    box=5
    
    if islastbarupdate then
    
    rangeNow=high-low
    NextChange=box-rangeNow
    distUp=high-close
    distDn=close-low
    countUp=distUp+NextChange
    countDn=distDn+NextChange
    
    drawtext("Dist.Up: #countUp#",barindex+2,max(open[1],close[1]))
    drawtext("Dist.Dn: #countDn#",barindex+2,min(open[1],close[1]))
    drawsegment(barindex,close+countUp,barindex+5,close+countUp)
    drawsegment(barindex,close-countDn,barindex+5,close-countDn)
    endif
    return 
    robertogozzi and Matt thanked this post
    2025-06-10_10-02.png 2025-06-10_10-02.png 2025-06-10_10-05.png 2025-06-10_10-05.png
    #248158 quote
    MattMatt
    Participant
    Junior
    Thanks Ivan. That’s very clever. My mistake though, I wasn’t specific enough. I’m actually using range bars with:  Box Size Method = Ticks (100) Is there any way to count the ticks and display it counting down from 100, 99, 98, etc? Btw, is it possible to display on the Y-axis or only the chart area? Thanks! 🙌
    #248169 quote
    Iván GonzálezIván González
    Moderator
    Legend
    Ok, so it will be like this:
    defparam drawonlastbaronly=true
    boxTicks=75
    box=boxTicks*ticksize
    
    if islastbarupdate then
       
       rangeNow=high-low
       NextChange=box-rangeNow
       distUp=high-close
       distDn=close-low
       countUp=distUp+NextChange
       countDn=distDn+NextChange
       ticksUp = countUp/ticksize
       ticksDn = countDn/ticksize
       
       drawtext("Dist.Up: #ticksUp#",barindex+2,max(open[1],close[1]))
       drawtext("Dist.Dn: #ticksDn#",barindex+2,min(open[1],close[1]))
       drawsegment(barindex,close+countUp,barindex+5,close+countUp)
       drawsegment(barindex,close-countDn,barindex+5,close-countDn)
    endif
    return
    
    Matt thanked this post
    #248177 quote
    JSJS
    Participant
    Master

    Hi Matty,

    If you are already using the “Countdown to bar Close” setting, this counter will change to a “tick” counter when you use a “tick” graph…

    When using, for example, a 100 tick graph, the counter will count down the ticks from 100 to 0…

    (Right click on the Y-axis and check “Display countdown to bar close”…)

    Matt and Iván González thanked this post
    Scherm­afbeelding-2025-06-11-om-12.29.13.png Scherm­afbeelding-2025-06-11-om-12.29.13.png
Viewing 5 posts - 1 through 5 (of 5 total)

  • You must be logged in to reply to this topic.

ProRealAI ProRealAI New

Stuck on this ProBuilder code?

Describe what this topic is trying to build, in plain English, and ProRealAI writes the ProRealTime™ indicator, screener or system for you.

Available in 7 languages
Try ProRealAI

🤔 Range Bar countdown…


ProBuilder: Indicators & Custom Tools

New Reply
Author
author-avatar
Matt @matty Participant
Summary

This topic contains 4 replies,
has 3 voices, and was last updated by JSJS

1 year, 3 months ago.

Topic Details
Forum: ProBuilder: Indicators & Custom Tools
Language: English
Started: 06/10/2025
Status: Active
Attachments: 3 files
ProRealCode ProRealCode
Loading...