To use GRAPH and GRAPHONPRICE, especially when you have to monitor many variables, please follow the steps I am suggesting you with the attached pics.
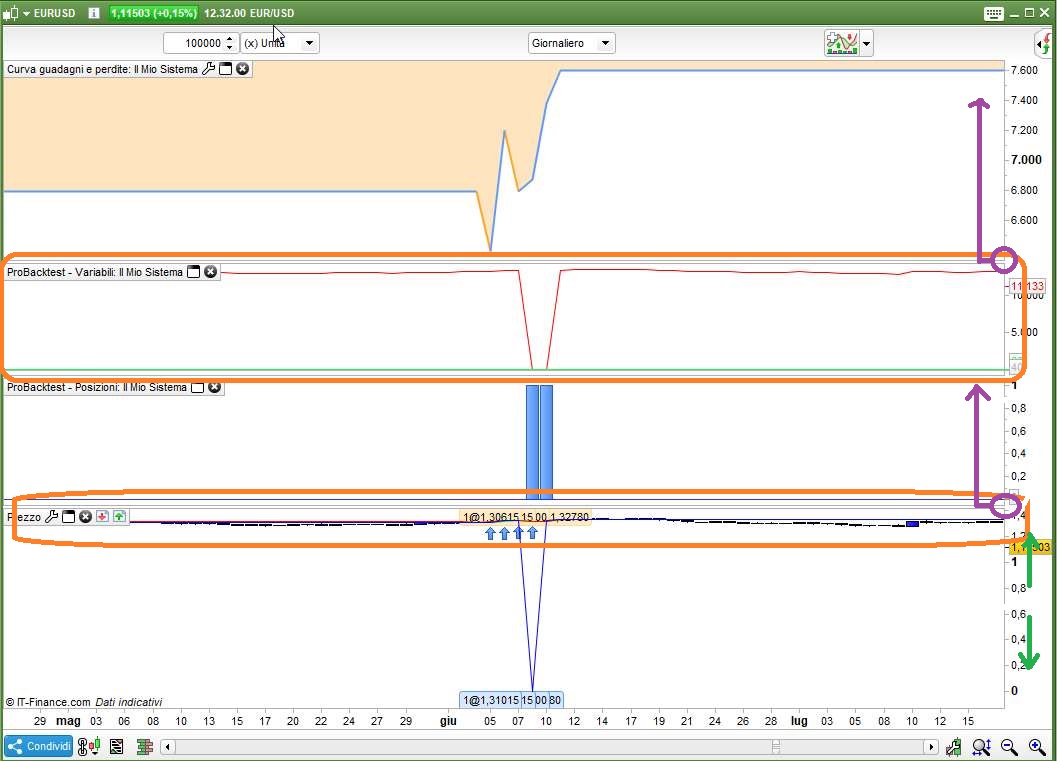
Pic1 – that’s what your chart looks like after ProBackTest has finished processing, you’ll have to:
-
- make price (candlesticks) and variables visible by stretching the scale (my green arrows on the scale) to a great extent
- get (almost) rid of the performance curve windows by picking its lower rightmost angle and pushing it upwards till you are allowed to, in order to make room for GRAPHed variables
- do the same with the windows where trades are plotted, you don’t need them now, but you need more space for the price chart where GRAPHONPRICE plots its data
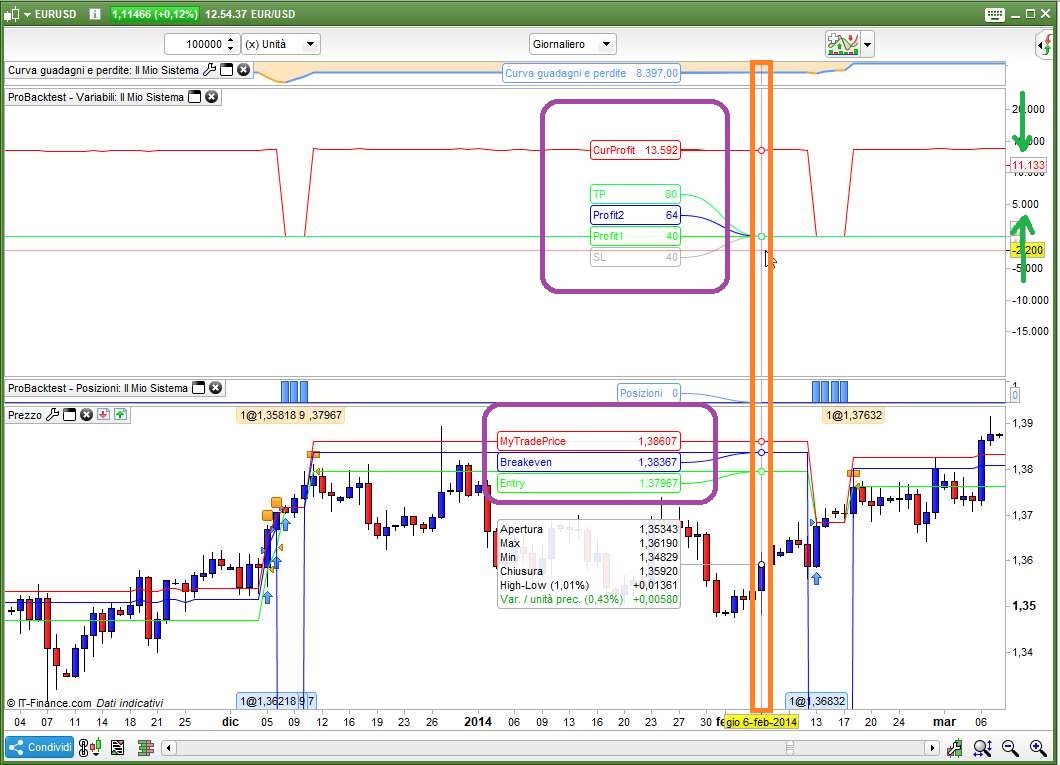
Pic2 – that’s what your chart looks like after completing the above steps:
-
- you might need to compress the scale of the VARIABLES’windows (the opposite of what you did with the price scale), to make GRAPHed variables more visible
- you’ll be able to see the variables GRAPHed ON PRICE as they sit on the price chart at runtime
You can just let your mouse hover the desired candlestick you want to monitor and you’ll get a clear, detailed insight of what’s going on with your code. If some data are not what you expected to see, try to figure out what you need to change to achieve your goals and start the backtest all over and over until everything works as expected.
Don’t panic about the time it takes… ProRealTime keep their platform open 24/7 🙂
Hi everyone, I spent the night checking the trades produced by the code with the latest changes kindly provided by Roberto. Everything works great!
I modified the entry criteria using the fractals and the stop and target values using the ATR.
Currently I do not yet have real-time data to be able to control the trailing movement with a 1 minute time frame, but I will soon ask for it to be enabled.
However, from all the checks I’ve done, the system goes really well.
I only noticed a very small problem, which I may know how to solve, but I would like your advice.
Whenever the ATR value is too small or the entry bar has a very wide range, the trade opens and closes on the same day and the next day the system performs a purchase trade again (at the open price because the price is greater than the fractal line).
To avoid repeating the purchase I could add a condition like “if positionperf (1) <> positionperf” so if the previous day an operation was performed I will not repeat it the next day (even if the fractal conditions exist) .
I don’t know how to set the function and where to put it in the code.
Please tell me if this solution is correct and how can I add it to my code.
Soon I will show you the updated version of my code with the hope of being able to share the results and any advice with you. GRAZIE !!
You should check STRATEGYPROFIT, instead:
IF StrategyProfit[1] <> StrategyProfit THEN
  TradeON = 0
ELSE
   TradeON = 1
ENDIF
insert it at the beginning, or at least BEFORE any trade is entered.
Make sure to add “AND TradeON” to your conditions.
hello Roberto, thank you very much for the quick reply.
Tonight I will try to change the code following your instructions and I will compare the results before and after the change.
I think this is the problem, but I will add some screenshots to share the results with you and verify the true origin of the problem.
GRAZIE !
Hi Roberto, hello everyone.
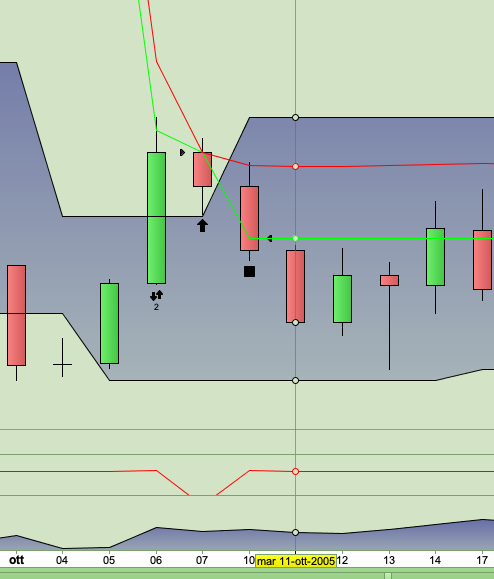
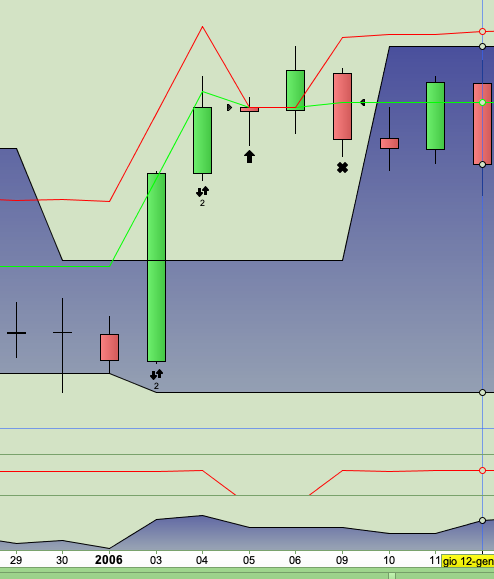
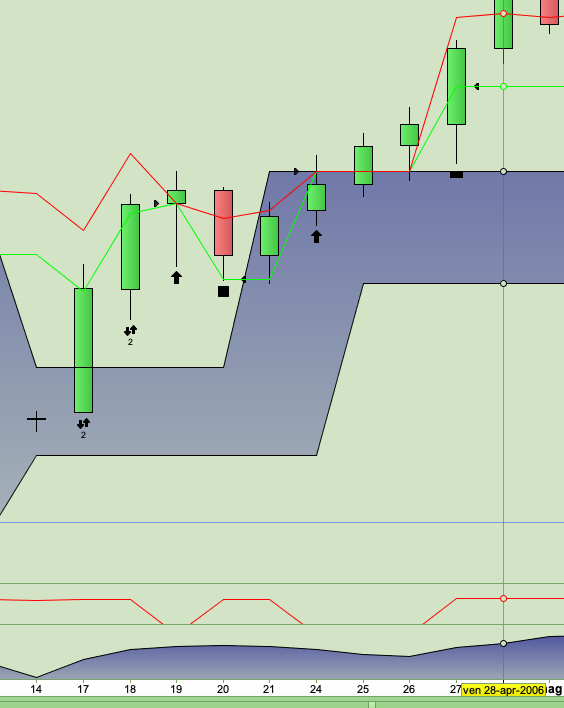
As promised, I am attaching some images that show how the code repeats the operations even the next day if the first operation was opened and closed in the same candle.
Very probably with the 1 minute time frame and the fast trailing movement we remain in the operation and there is no need to block the subsequent operations.
however, it is necessary to have a filter to avoid this type of problem.
Soon I’ll fix the code with the addition suggested by Roberto and then we’ll see what happens.
I suppose I will have to put an AND function to block operations between [0] and [1] but also between [1] and [2] since in the examples I have attached there is the possibility that the problem can be repeated for two consecutive days.
Now I try and let you know as soon as the changes work.
GRAZIE !!
Hi Roberto, I tried to follow your suggestions carefully.
I added “StrategyProfit” from line 25 to line 29 and added “TradeON” as a new condition on line 31 but unfortunately nothing changes and double operations continue to exist.
I kindly ask you when you have a few minutes to try the code I have attached, or tell me where you think the programming error may be.
I continue with the tests because when we fix this last problem, I can finally start the real tests with the multi time frame.
Thanks as always for your great advice.
DEFPARAM CumulateOrders = False
MioRischio = 100  //importo massimo euro che voglio rischiare per ogni singola operazione
PercStop1  = 0.50 //attiva il pareggio al 50% del profitto
PercStop2  = 0.80 //attiva lo SL a metà del profitto quanto questo ragguinge la seconda %
PagoSpese  = 5 * pipsize //numero pips che aggiungo a breakeven per ripagarmi delle spese
MyStep     = 5 * pipsize //5 pip step after PercSTop2 is hit
indicator1, ignored = CALL "Fracta linee"
MyATR = AverageTrueRange[14](close)
ATRperSTOP = 1
ATRperTARGET = 1
IF Not OnMarket THEN
BreakEven    = 0
MyTradePrice = 0
ENDIF
IF OnMarket AND Not OnMarket[1] THEN
MyTradePrice = TRADEPRICE
BreakEven    = 0
Flag         = 0
SET STOP   pLOSS   StopLoss
SET TARGET pPROFIT TargetProfit
ENDIF
ONCE Flag = 0
//IF OnMarket OR LOW < MinimoPat THEN //?????
//ENDIF
IF StrategyProfit[1] <> StrategyProfit THEN
TradeON = 0
ELSE
TradeON = 1
ENDIF
Cond1 = HIGH<=indicator1
CondTOT = Cond1 AND TradeON          //Condizione globale da tradare
IF CondTOT THEN
Flag = 1
ENDIF
IF CondTOT AND Not LongOnMarket THEN
TargetProfit    = ((MyATR * ATRperTARGET)/pipsize) //VALORE in PIPS del mio TARGET INIZIALE
Prezzo          =  indicator1                //VALORE al quale si entra in posizione
//   se vengono soddisfatte TUTTE le CONDIZIONI
StopLoss        = ((MyATR * ATRperSTOP)/pipsize) //VALORE in PIPS dello STOP LOSS INIZIALE
MinimoPat       =  LOW
//TargetProfit    = max(80,TargetProfit)
//StopLoss        = TargetProfit * 0.5
Profitto1       = (TargetProfit * PercStop1)
Profitto2       = (TargetProfit * PercStop2)
ENDIF
//Moltiplicatore = (MioRischio/(StopLoss/Prezzo)/pipsize)
IF not onmarket AND Flag THEN
Moltiplicatore = (MioRischio/(StopLoss/Prezzo)/pipsize)
BUY Moltiplicatore lots AT (Prezzo+0*pipsize) STOP
SET STOP   pLOSS   StopLoss
SET TARGET pPROFIT TargetProfit
ENDIF
//------------------------------------------------------------------
CurrentProfit = (high - MyTradePrice) / pipsize
IF CurrentProfit > Profitto2 AND MyTradePrice < (TRADEPRICE + Profitto2 * pipsize) THEN
MyTradePrice = TRADEPRICE + Profitto2 * pipsize
BreakEven    = TRADEPRICE + Profitto1 * pipsize
ELSIF CurrentProfit > Profitto1 AND BreakEven = 0 THEN
BreakEven = MyTradePrice + PagoSpese
ENDIF
IF BreakEven > 0 AND CurrentProfit > 0 AND MyTradePrice > (TRADEPRICE + PagoSpese) THEN
IF close - MyTradePrice >= MyStep THEN
BreakEven    = BreakEven + MyStep
MyTradePrice = MyTradePrice + MyStep
ENDIF
ENDIF
IF BreakEven AND OnMarket THEN
SELL AT BreakEven STOP
ENDIF
graphonprice tradeprice    coloured(0,255,0,255)     AS "Entry"
graphonprice MyTradePrice  coloured(255,0,0,255)     AS "MyTradePrice"
//graphonprice BreakEven     coloured(0,0,255,255)     AS "Breakeven"
graph        CurrentProfit coloured(255,0,0,255)     AS "CurProfit"
graph        Profitto1     coloured(0,255,0,255)     AS "Profit1"
graph        Profitto2     coloured(0,0,255,255)     AS "Profit2"
graph        StopLoss      coloured(181,181,181,255) AS "SL"
graph        TargetProfit  coloured(18,255,81,255)   AS "TP"
The condition to enter a trade is FLAG, not CONDTOT, so you should place the additional condition at line 47.
Do not add it to line 33 since it’ not always executed.
DEFPARAM CumulateOrders = False
MioRischio = 100  //importo massimo euro che voglio rischiare per ogni singola operazione
PercStop1  = 0.50 //attiva il pareggio al 50% del profitto
PercStop2  = 0.80 //attiva lo SL a metà del profitto quanto questo ragguinge la seconda %
PagoSpese  = 5 * pipsize //numero pips che aggiungo a breakeven per ripagarmi delle spese
MyStep     = 5 * pipsize //5 pip step after PercSTop2 is hit
indicator1, ignored = CALL "Fracta linee"
MyATR = AverageTrueRange[14](close)
ATRperSTOP = 1
ATRperTARGET = 1
IF Not OnMarket THEN
BreakEven    = 0
MyTradePrice = 0
ENDIF
IF OnMarket AND Not OnMarket[1] THEN
MyTradePrice = TRADEPRICE
BreakEven    = 0
Flag         = 0
SET STOP   pLOSS   StopLoss
SET TARGET pPROFIT TargetProfit
ENDIF
ONCE Flag = 0
//IF OnMarket OR LOW < MinimoPat THEN //?????
//ENDIF
IF StrategyProfit[1] <> StrategyProfit THEN
TradeON = 0
ELSE
TradeON = 1
ENDIF
Cond1 = HIGH<=indicator1
CondTOT = Cond1        //Condizione globale da tradare
IF CondTOT THEN
Flag = 1
ENDIF
IF CondTOT AND Not LongOnMarket THEN
TargetProfit    = ((MyATR * ATRperTARGET)/pipsize) //VALORE in PIPS del mio TARGET INIZIALE
Prezzo          =  indicator1                //VALORE al quale si entra in posizione
//   se vengono soddisfatte TUTTE le CONDIZIONI
StopLoss        = ((MyATR * ATRperSTOP)/pipsize) //VALORE in PIPS dello STOP LOSS INIZIALE
MinimoPat       =  LOW
//TargetProfit    = max(80,TargetProfit)
//StopLoss        = TargetProfit * 0.5
Profitto1       = (TargetProfit * PercStop1)
Profitto2       = (TargetProfit * PercStop2)
ENDIF
//Moltiplicatore = (MioRischio/(StopLoss/Prezzo)/pipsize)
IF not onmarket AND Flag AND TradeON THEN
Moltiplicatore = (MioRischio/(StopLoss/Prezzo)/pipsize)
BUY Moltiplicatore lots AT (Prezzo+0*pipsize) STOP
SET STOP   pLOSS   StopLoss
SET TARGET pPROFIT TargetProfit
ENDIF
//------------------------------------------------------------------
CurrentProfit = (high - MyTradePrice) / pipsize
IF CurrentProfit > Profitto2 AND MyTradePrice < (TRADEPRICE + Profitto2 * pipsize) THEN
MyTradePrice = TRADEPRICE + Profitto2 * pipsize
BreakEven    = TRADEPRICE + Profitto1 * pipsize
ELSIF CurrentProfit > Profitto1 AND BreakEven = 0 THEN
BreakEven = MyTradePrice + PagoSpese
ENDIF
IF BreakEven > 0 AND CurrentProfit > 0 AND MyTradePrice > (TRADEPRICE + PagoSpese) THEN
IF close - MyTradePrice >= MyStep THEN
BreakEven    = BreakEven + MyStep
MyTradePrice = MyTradePrice + MyStep
ENDIF
ENDIF
IF BreakEven AND OnMarket THEN
SELL AT BreakEven STOP
ENDIF
graphonprice tradeprice    coloured(0,255,0,255)     AS "Entry"
graphonprice MyTradePrice  coloured(255,0,0,255)     AS "MyTradePrice"
//graphonprice BreakEven     coloured(0,0,255,255)     AS "Breakeven"
graph        CurrentProfit coloured(255,0,0,255)     AS "CurProfit"
graph        Profitto1     coloured(0,255,0,255)     AS "Profit1"
graph        Profitto2     coloured(0,0,255,255)     AS "Profit2"
graph        StopLoss      coloured(181,181,181,255) AS "SL"
graph        TargetProfit  coloured(18,255,81,255)   AS "TP"
hello Roberto, thank you very much for your suggestion but the solution you proposed does not work effectively.
I entered the IF function in the Flag and not in the Condition and actually produced the desired result, but only for the candle immediately following the candle with an open and closed operation.
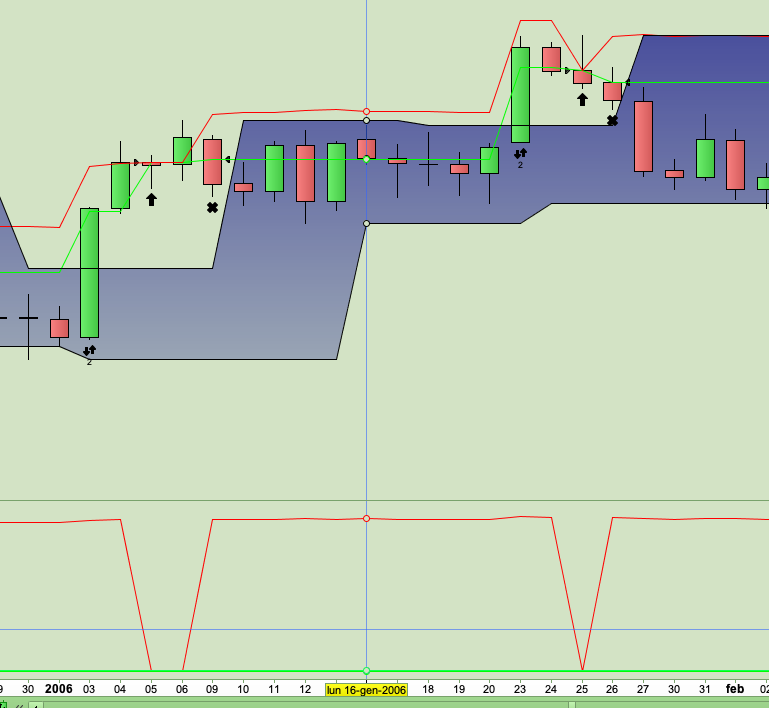
The problem arises again at the next candle (as you can see in the screen that I have attached. Two trades with the same problem).
We should also compare between [1] and [2], between [2] and [3] etc. but I think this is not the best solution.
I noticed that for all the operations that the system should not do, the opening of the candle is always greater than the top line of the fractal.
Operations that have this type of opening should be blocked.
In line 30 to enter correctly I set Cond1 “HIGH <= indicator1”.
Could we use a solution like this to block unwanted operations? (but there is the problem that the opening of the candle is checked only when the candle is finished, ie 4 hours later).
How do you suggest me to proceed?
Thank you very much for the help you are giving me.
You forgot to attach the file for the CALLed indicator.
hello Roberto, I hope I understood correctly and I am attaching the code you were asking for.
this is the code that identifies the fractal lines.
I’m trying to find a solution but with my little experience it will be hard.
I hope to receive your suggestion soon.
what I have noticed is that the candles where a position that should not be opened has all in common the fact that the opening is always greater than the top line of the fractal.
While the correct operations have the opening that is always less than the fractal line and then during the candle the fractal line is exceeded.
We cannot use the “if ON Market” function because opening and closing the operation on the same day the system always sees us as “NOT On Market”.
We could check if the value of the previous high is higher than the previous fractal line which means that certainly an operation has been done.
we could add a condition (or a flag) that says “if Not ON Market AND high [1]> indicator1 [1]” we do not open a new position.
Can you tell me how to write it in the code? (if you think this solution is good).
GRAZIE !!
//----- Highs -----
ONCE HighCount = Undefined
ONCE HighFractal = Undefined


IF (High > High[1]) AND (High > High[2]) THEN
HighLevel = High
ENDIF

IF (High < HighLevel) THEN
HighCount = HighCount - 1
ELSIF (High >= HighLevel) THEN
HighCount = 0
ENDIF

IF HighCount = -2 THEN
HighFractal = HighLevel
ELSE
HighFractal = HighFractal
ENDIF
//----- Lows -----
ONCE LowCount = Undefined
ONCE LowFractal = Undefined

IF (Low < Low[1]) AND (Low < Low[2]) THEN
LowLevel = Low
ENDIF

IF (Low > LowLevel) THEN
LowCount = LowCount + 1
ELSIF (Low <= LowLevel) THEN
LowCount = 0
ENDIF

IF LowCount = 2 THEN
LowFractal = LowLevel
ELSE
LowFractal = LowFractal
ENDIF

RETURN HighFractal as "High Level", LowFractal as "Low Level"
You can just let your mouse hover the desired candlestick you want to monitor and you’ll get a clear, detailed insight of what’s going on with your code
How come I see nothing extra when I hover my mouse over a candlestick??
Is this a setting that I have not got turned on or what??
How come I see nothing extra when I hover
Sorted … I woke up and thought … it’s gotta be Cursor Details with most of the options deselected!
hi GraHal, can I ask you which solution you use to avoid doing new operations after having already done the first one correctly?
I refer to my problem mentioned in my last posts
GRAZIE !!
I refer to my problem mentioned in my last posts
When I said sorted, it was to do with the hoover info displayed and not to do with your problem mentioned in your last posts. I cannot help with the coding / strategy issues sorry.
Apologies for the confusion.
- When backtesting to spot errors, it’s silly to open many positions so that you need several billion $ to complete the test, buying 100 contracts or more does NOT grant you any better way to debug your code, just makes it more difficult (mainly because it’s a slower process)
- Please DO NOT use candle 1, 2,…. (where is candle 1? in your pic I can see only two’s, no one’s!!!). Use dates, instead, you cannot make errors referring dates, while you certainly made errors trying to tag candles with custom numbers!
The problem with trades opened and closed on the same candlestick can be solved by adding another condition to your line 15:
IF OnMarket AND Not OnMarket[1] OR StrategyProfit <> StrategyProfit[1] THEN //the second of these two conditions will tell whether a trade was opened and closed within the previous bar