I was running an optimization on a ProOrder strategy, when I noticed a very strange thing.
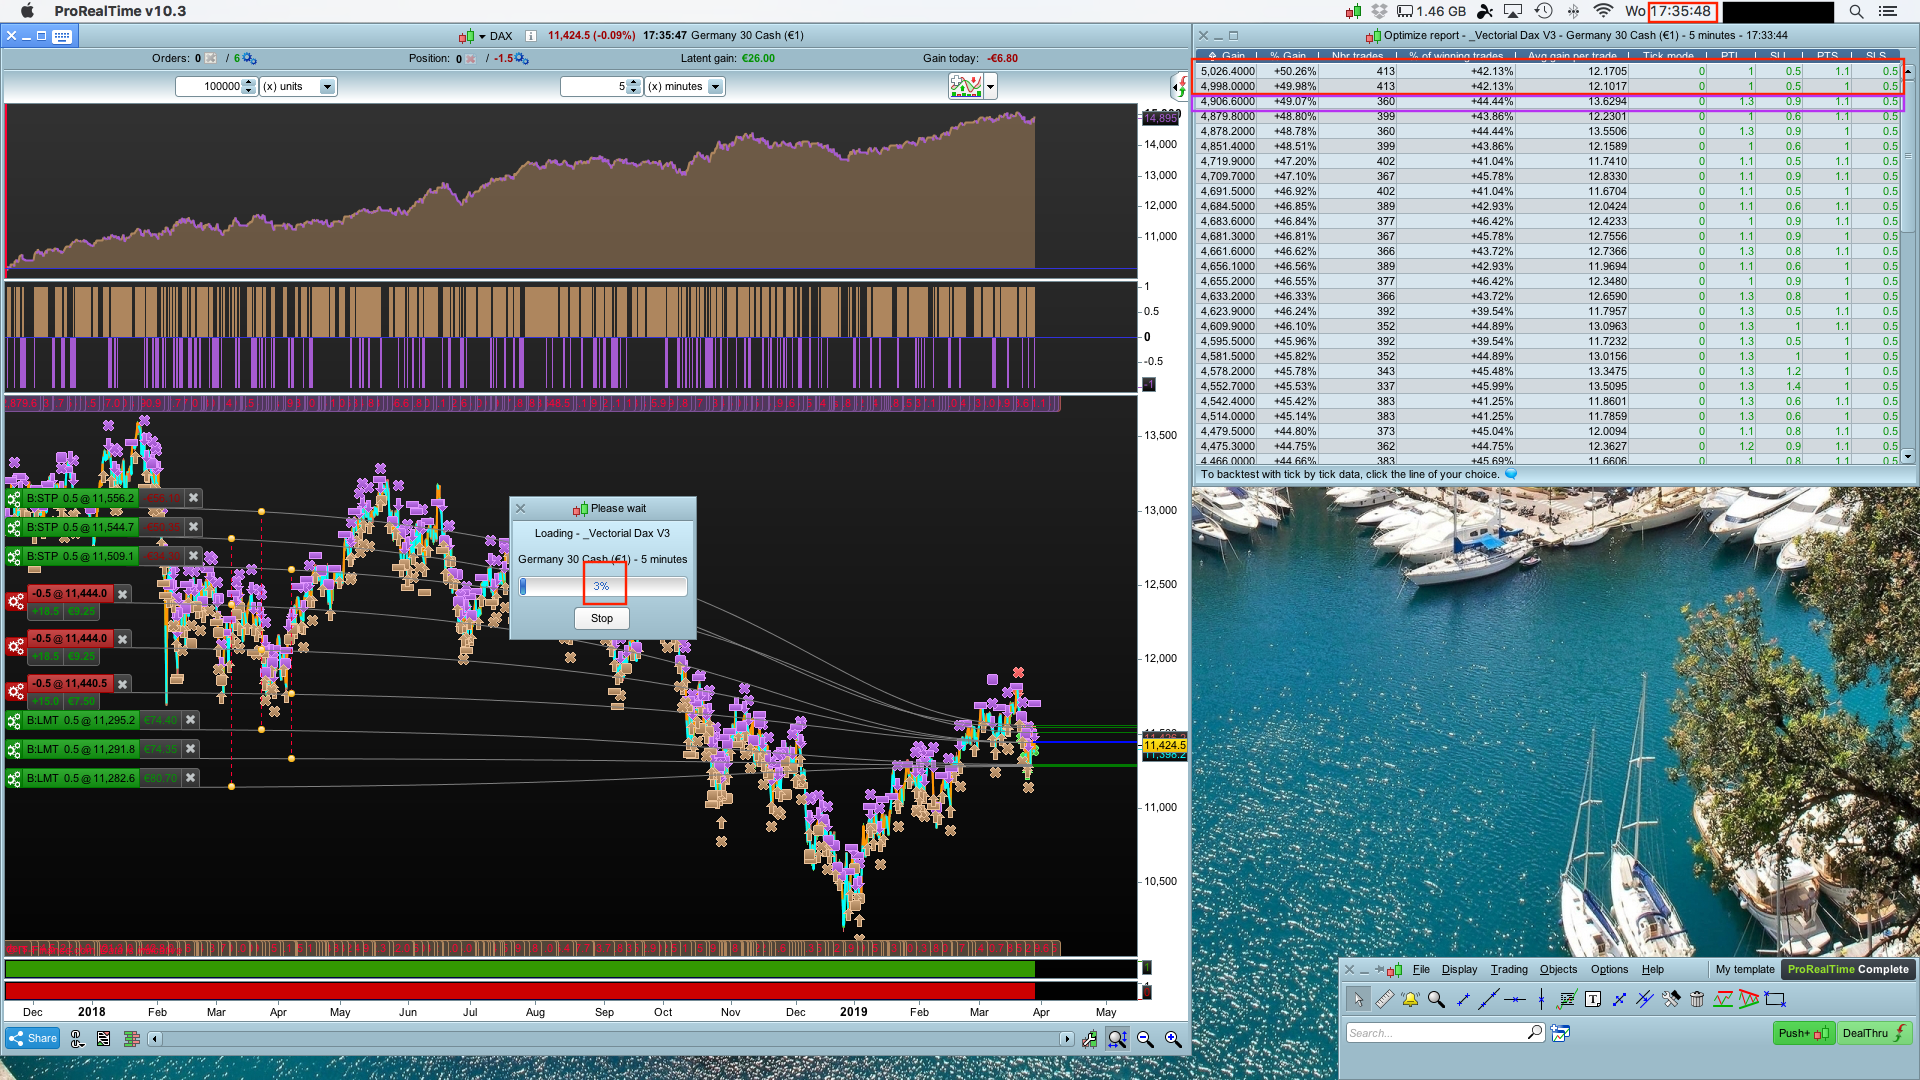
As you can see on printscreen 1, the best gain after 3% was 5026.4 euro, followed by a gain of 4998 euro.
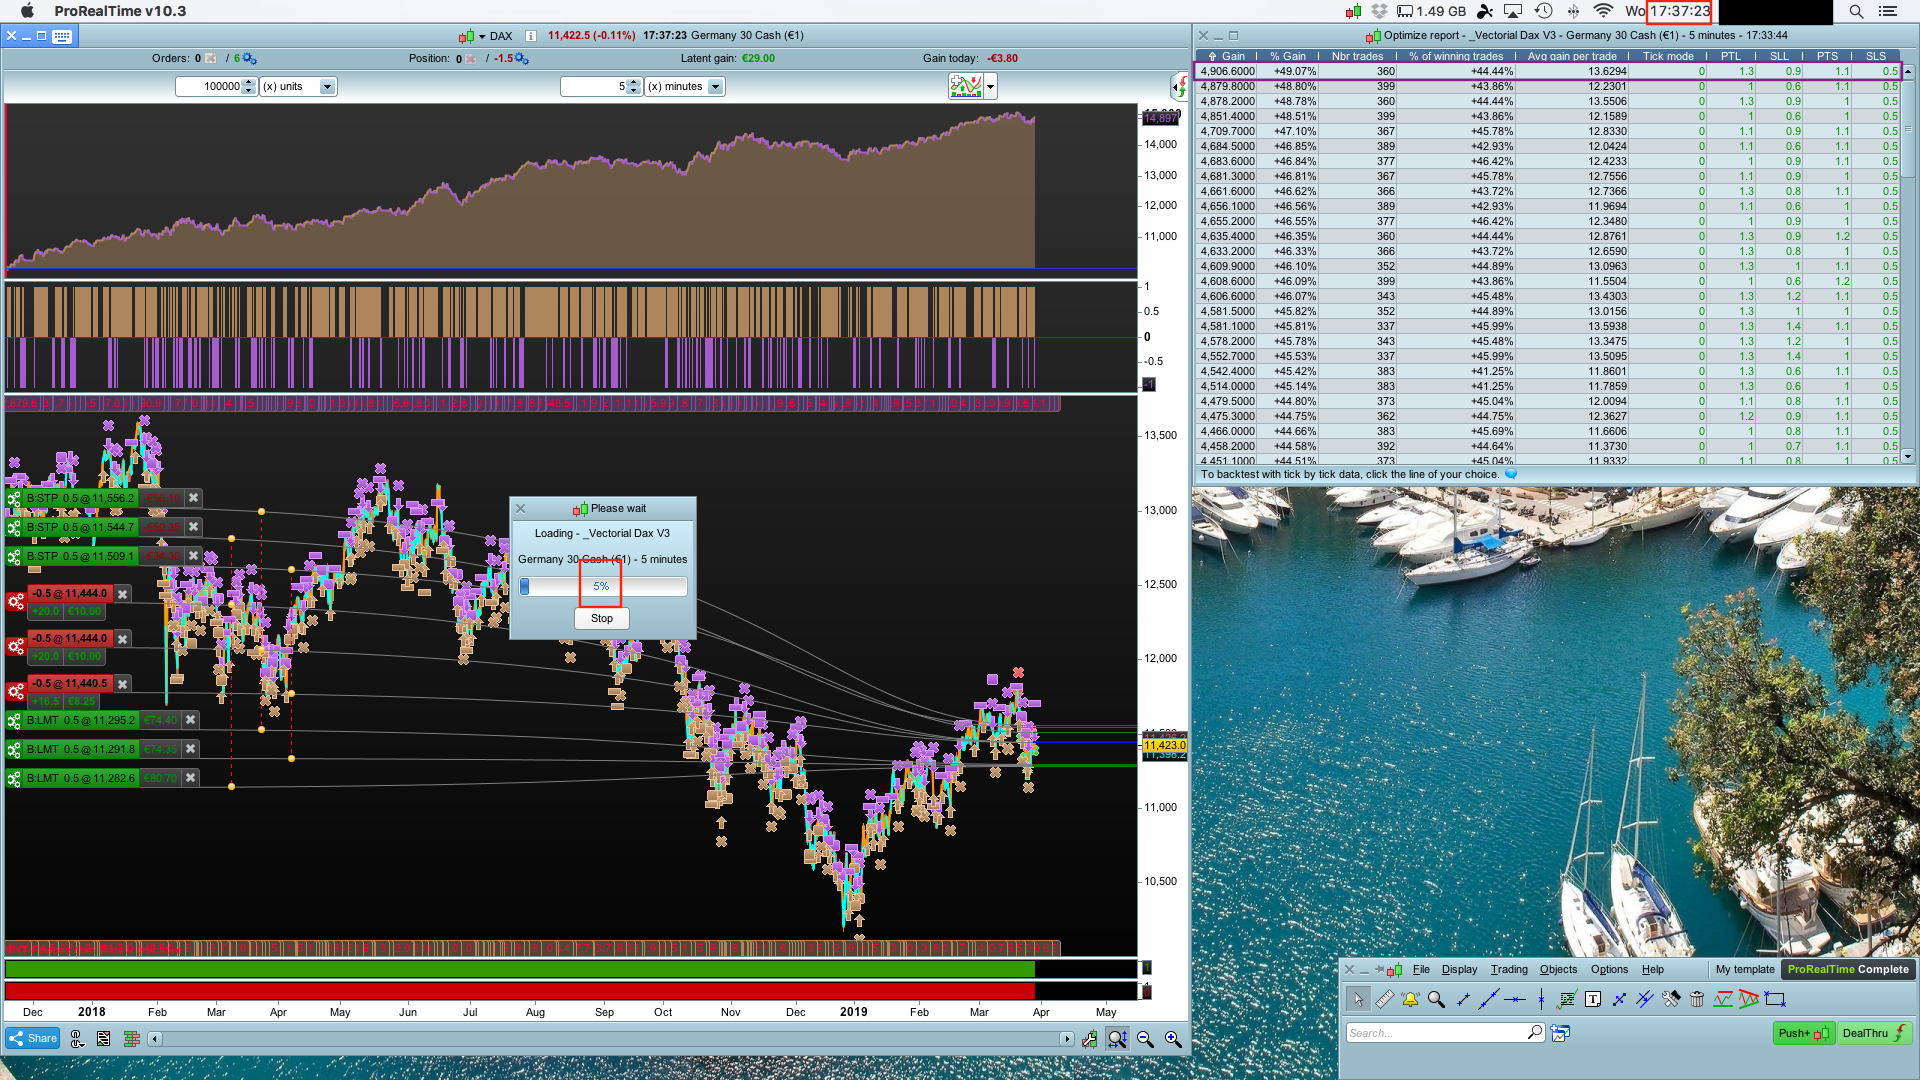
Only a minute later, these results suddenly disappeared from the optimization report as can be seen on printscreen 2.
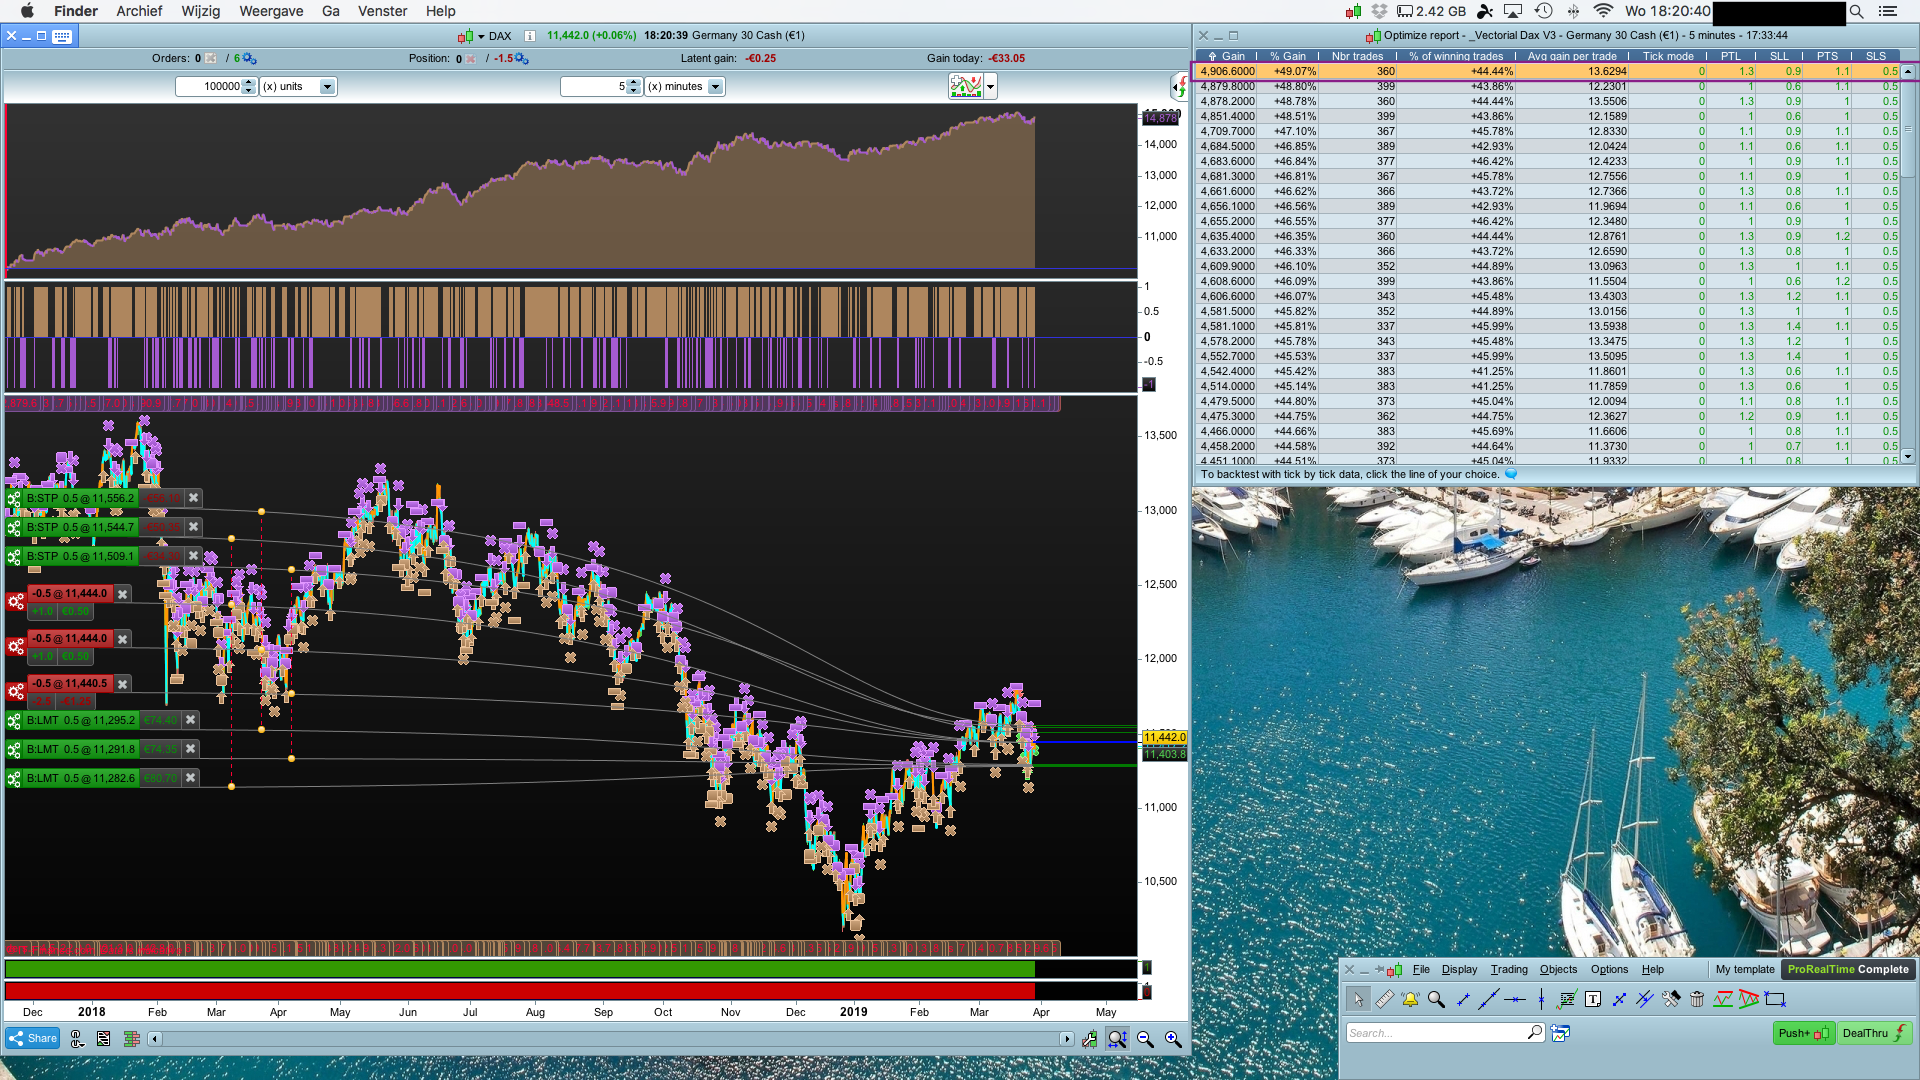
After the optimization was complete, these two 5000 euro results where nowhere to be seen, as can be seen on printscreen 3.
I have attached the itf file of the strategy, but I am afraid the strategy isn’t responsible for the anomoly.
I tried an opitimization on a different strategy and there I encountered the same problem; the current temporary top results just vanishing.
Can someone help me figure out where the problem originates from?
Thanks in advance
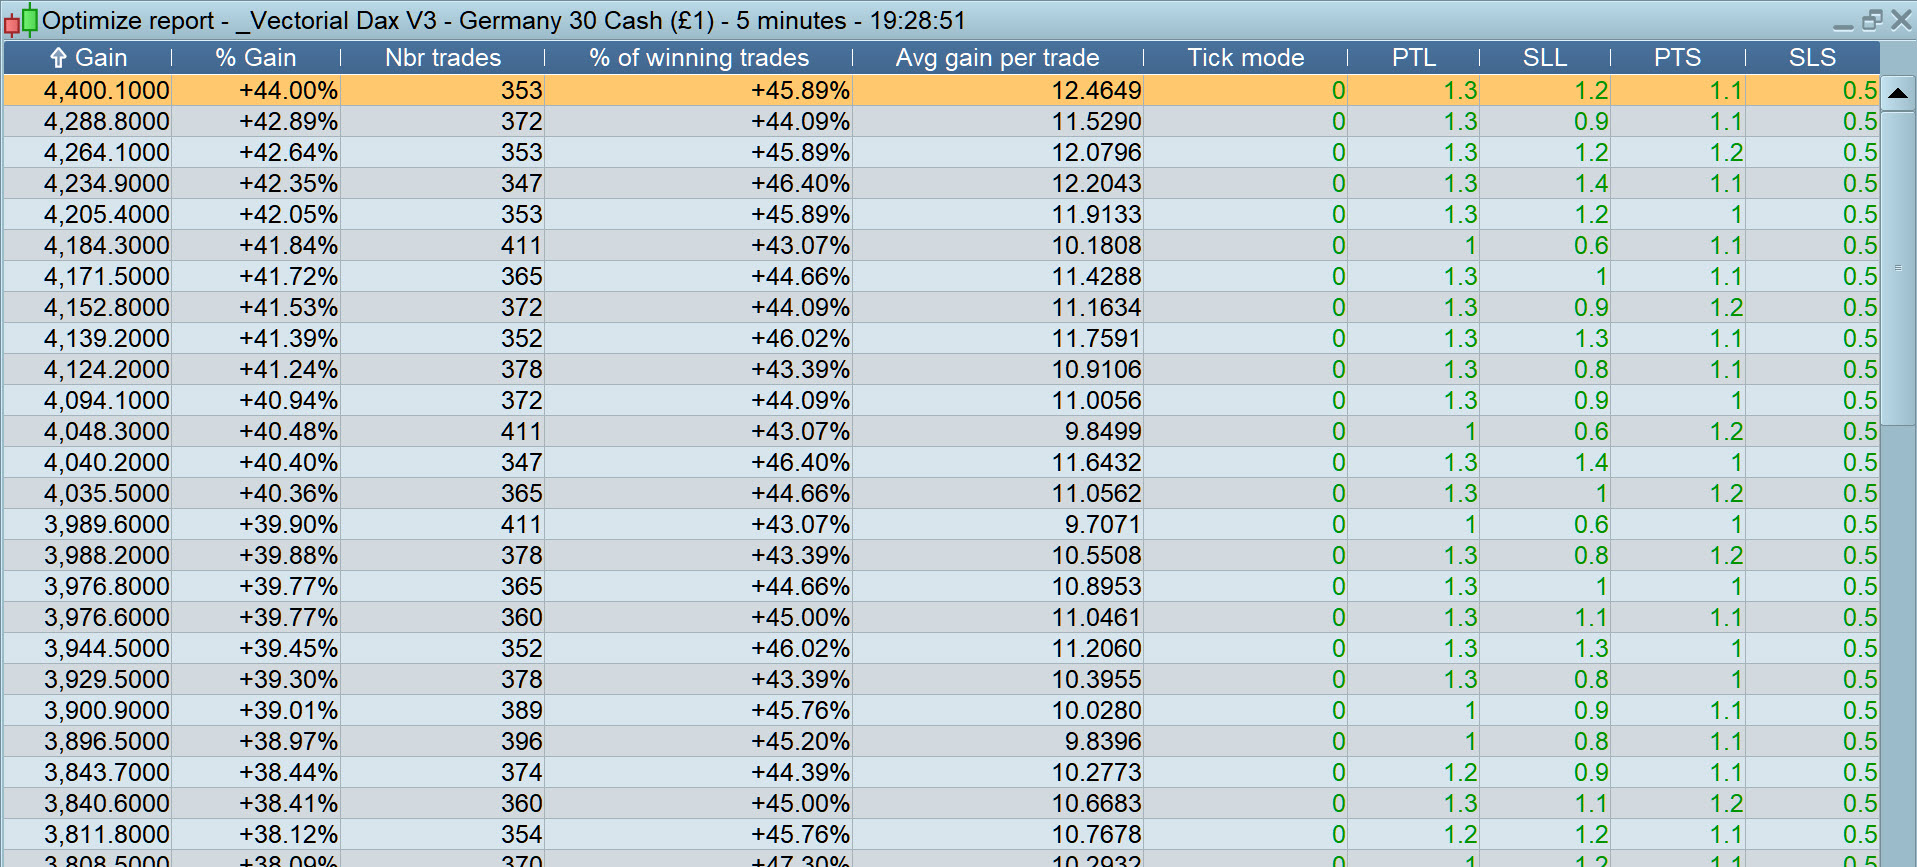
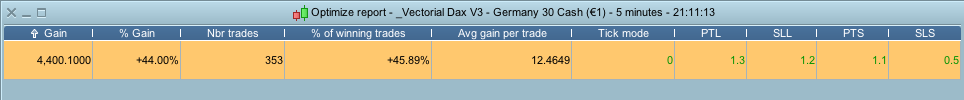
I’m running it now, I may as well let it finish, but I get £4399.7 (€5185).
Also I had no disappearing higher values etc.
I will try on my CFD account also later.
I entered Spread = 2.
What value spread did you enter in the box?
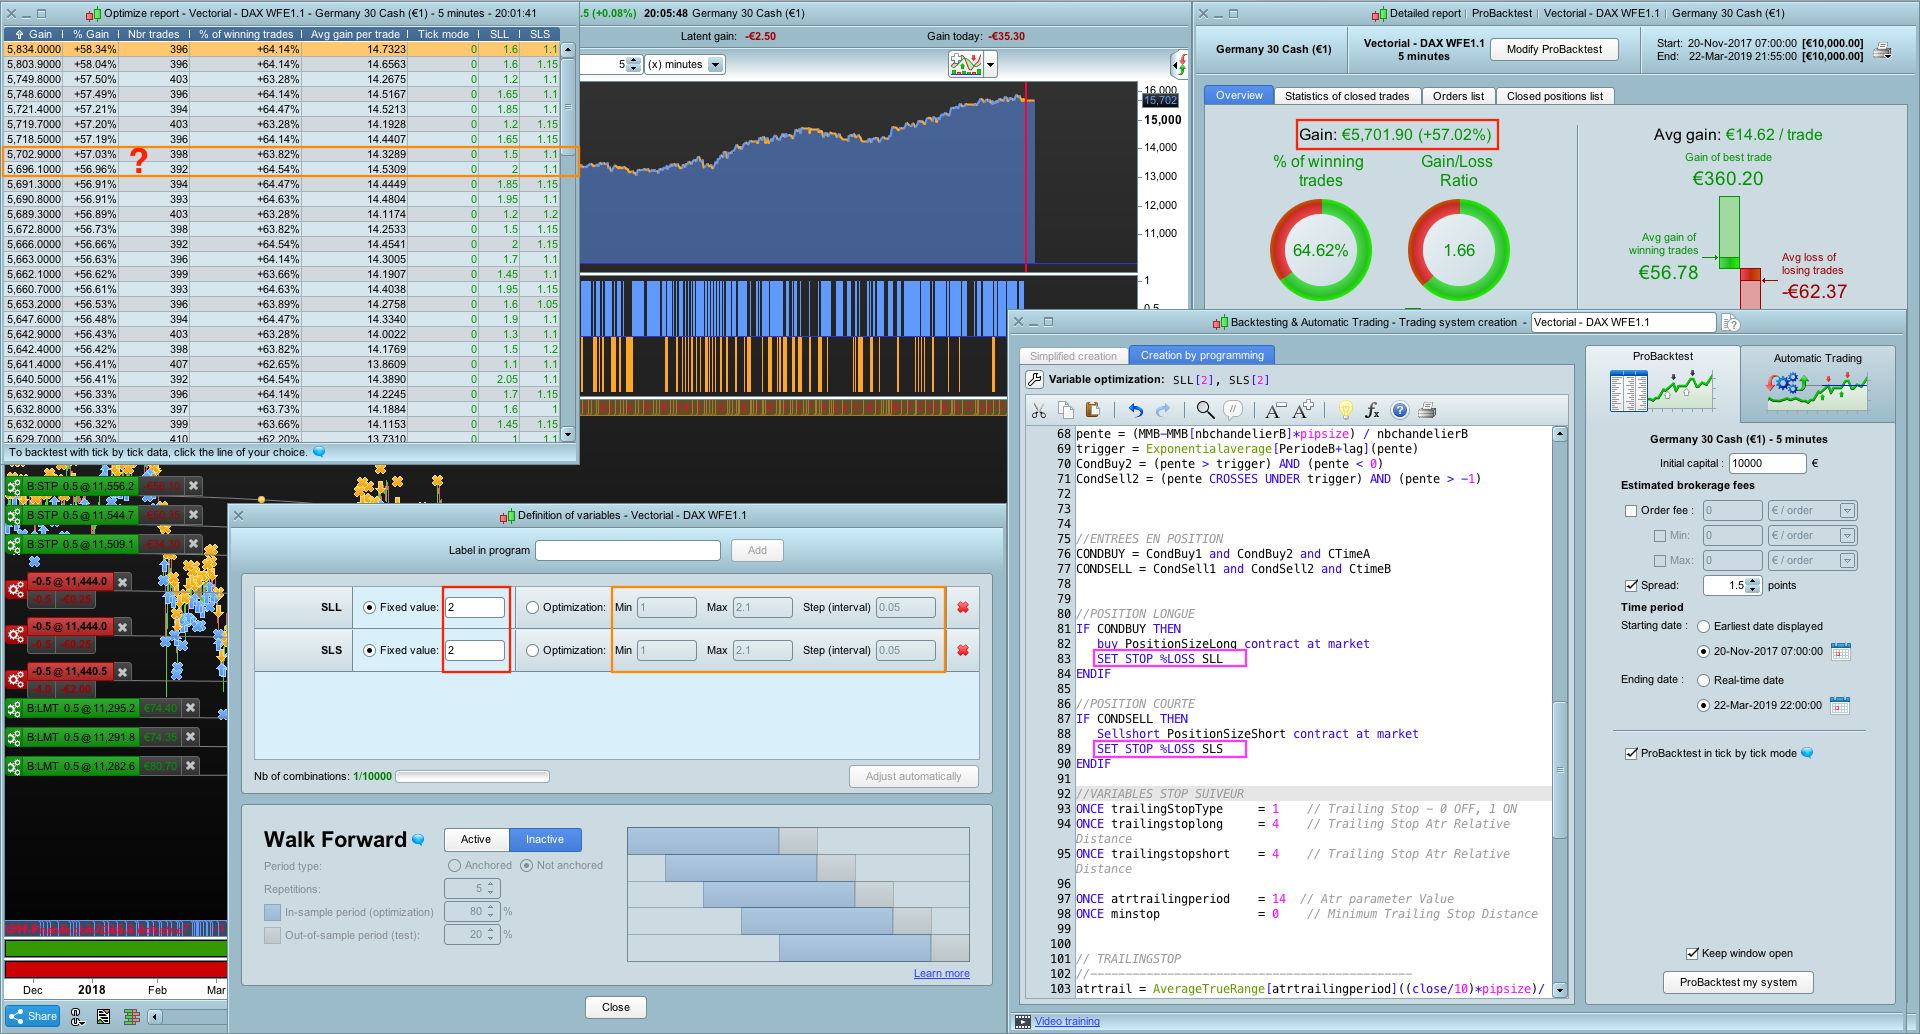
On printscreen 4 you can see another problem regarding an optimization test. (It’s a slightly different variation of the Strategy in my first post – Itf file is attached – Spread = 1.5)
When I set the Stop Loss percentage of the long and short trades at two percent, I get a result of 5701.90 euro.
However, when I run an optimization test, ranging from 1 to 2.1 percent, the 2 percent combination doesn’t appear in the optimization report, even tho it should be if you look at the other results.
I entered Spread = 2.
What value spread did you enter in the box?
For the strategy Vectorial Dax V3, the spread was 1 – Period: 20/11/17_07:00:00 – 22/3/19_22:00:00
Reassuringly I got the same on my CFD Account (allowing for very minor differences).
No disappearing acts either.
Spread = 2 so you can add £353 (£1 for each trade).
However, when I run an optimization test, ranging from 1 to 2.1 percent, the 2 percent combination doesn’t appear in the optimization report, even tho it should be if you look at the other results.
I guess this can be explained by considering that the Optimiser will show the lowest Stop Loss consistent with the highest profit and so a combination of SLL = 1.5% and SLS = 1.1% gives €5703 so why show the SLL = 2% and SLS = 2%?
Also bear in mind the Optimiser only shows the top X results (x = 100 I think?).
EDIT / PS
If you want to force the showing of 2% then reduce the range … to 1.8 to 2.2 maybe?
Only a minute later, these results suddenly disappeared from the optimization report as can be seen on printscreen 2.
Hey PZ maybe you are not seeing things after all! 🙂
If the same or better profit figure (the best gain after 3% was 5026.4 ) can be had at a different / lower set of variable values then the higher set of values may disappear out of view as the Optimiser only shows the top 100 combinations.
Above doesn’t explain why I didn’t see the disappearing act? 🙂
Reassuringly I got the same on my CFD Account (allowing for very minor differences).
No disappearing acts either.
Spread = 2 so you can add £353 (£1 for each trade).
Did you run the complete test, because I’m very curious what the best combination in your optimization report is.
The problem for me however remains, since I know there are combinations of the 4 variables that give a better endresult than the top result in my optimization report.
When I input the values from your test, I am capable of recreating your result (as you can see in printscreen 7 – euros instead of pond ofcourse). Therefore I think we can conclude that the result itself is not wrong, but for some reason it won’t show the best result.
Only a minute later, these results suddenly disappeared from the optimization report as can be seen on printscreen 2.
Hey PZ maybe you are not seeing things after all!
If the same or better profit figure (the best gain after 3% was 5026.4 ) can be had at a different / lower set of variable values then the higher set of values may disappear out of view as the Optimiser only shows the top 100 combinations.
Above doesn’t explain why I didn’t see the disappearing act?
Could be, altough I have been using the optimizer since forever, and I never had the impression that it would favor variables over gains.
There is quite a difference between 5026.4 and 4906.6, so omitting the 5026.4 because the 4906.6 has a better set of variables seems quite strange (even a wrong thing to do)
However, when I run an optimization test, ranging from 1 to 2.1 percent, the 2 percent combination doesn’t appear in the optimization report, even tho it should be if you look at the other results.
I guess this can be explained by considering that the Optimiser will show the lowest Stop Loss consistent with the highest profit and so a combination of SLL = 1.5% and SLS = 1.1% gives €5703 so why show the SLL = 2% and SLS = 2%?
Also bear in mind the Optimiser only shows the top X results (x = 100 I think?).
EDIT / PS
If you want to force the showing of 2% then reduce the range … to 1.8 to 2.2 maybe?
If you keep the number of combinations at 100, you will indeed see the 2/2 combination appear.
If you go higher in number of combinations, it will disappear, which I think is strange since it is a top20 result.
Do you see the 2/2 combination appear in your optimize report when you run a number of combinations higher than 100?
If you go higher in number of combinations, it will disappear, which I think is strange since it is a top20 result.
It might be a top 20 result in terms of Gain, but the Optimiser tries to get us the highest gain at the least risk.
So if that same gain can be had at less risk then the higher risk combo may disappear below the 100th row.
Do you see the 2/2 combination appear in your optimize report when you run a number of combinations higher than 100?
I’ll try again tomorrow.
It might be a top 20 result in terms of Gain, but the Optimiser tries to get us the highest gain at the least risk. So if that same gain can be had at less risk then the higher risk combo may disappear below the 100th row.
I always question myself … is above a load of shite 🙂 and maybe how the Optimiser SHOULD work??
Any comments anyone?
Optimization anomalies have been also reported in this thread: https://www.prorealcode.com/topic/walk-forward-et-multi-time-frame-ko/
I think that it could be related to an update made yesterday, ITF is currently investigating on their side.. I will update once I receive new useful infos.
Do you see the 2/2 combination appear in your optimize report when you run a number of combinations higher than 100?
I tried again today, and the answer is No.
Did you try … input the combo variables 1.0, 0.5, 1.1, o.5 as shown on your Print Screen 1 and for the same date range as you mention? What is the result? Is it near the 5026.4 euro that you quote in your 1st / original post?
When I input a fixed value for the variables, in this case 1.0, 0.5, 1.1, 0.5, I get exactly 5026.4 euro.