I just got to thinking about market sentiment filters. Usually we like to add a filter to our strategies that says only trade long if this condition and only trade short if not this condition – for example go only long if above MA200 and only go short if below MA200…. and I got to thinking that wouldn’t it be nice if we could quantify these filters so as to ensure that we are using a good one for the instrument that we are trading. My initial idea is to count green candles when long filter is valid and count red candles when short filter is valid. This way we can give a ‘quality rating’ to our sentiment filter so as to compare various filters. Another thought is to count median price rises and median price drops compared to the last candle. Maybe even several different types of quality ratings could improve the overall rating?
I’d be interested if anybody has any ideas on how best to decide on quality and also maybe a list of common sentiment filters to test it on. My end idea is to create a simple indicator that can be applied to any chart and any time frame and which then decides which is the best sentiment filter to use to improve a strategy.
Here’s a start of a code to show the sort of thing that I was thinking of:
f1 = close > average[200]
f2 = close > weightedaverage[200]
f3 = ROC[22] > ROC[22][1]
f4 = close > close[300]
up1 = close > open
up2 = medianprice > medianprice[1]
up3 = weightedclose > weightedclose[1]
up4 = typicalprice > typicalprice[1]
up5 = totalprice > totalprice[1]
for a = 1 to 5
if a = 1 then
up = up1
endif
if a = 2 then
up = up2
endif
if a = 3 then
up = up3
endif
if a = 4 then
up = up4
endif
if a = 5 then
up = up5
endif
if (f1 and up) or (not f1 and not up) then
filter1 = filter1 + 1
endif
if (f2 and up) or (not f2 and not up) then
filter2 = filter2 + 1
endif
if (f3 and up) or (not f3 and not up) then
filter3 = filter3 + 1
endif
if (f4 and up) or (not f4 and not up) then
filter4 = filter4 + 1
endif
next
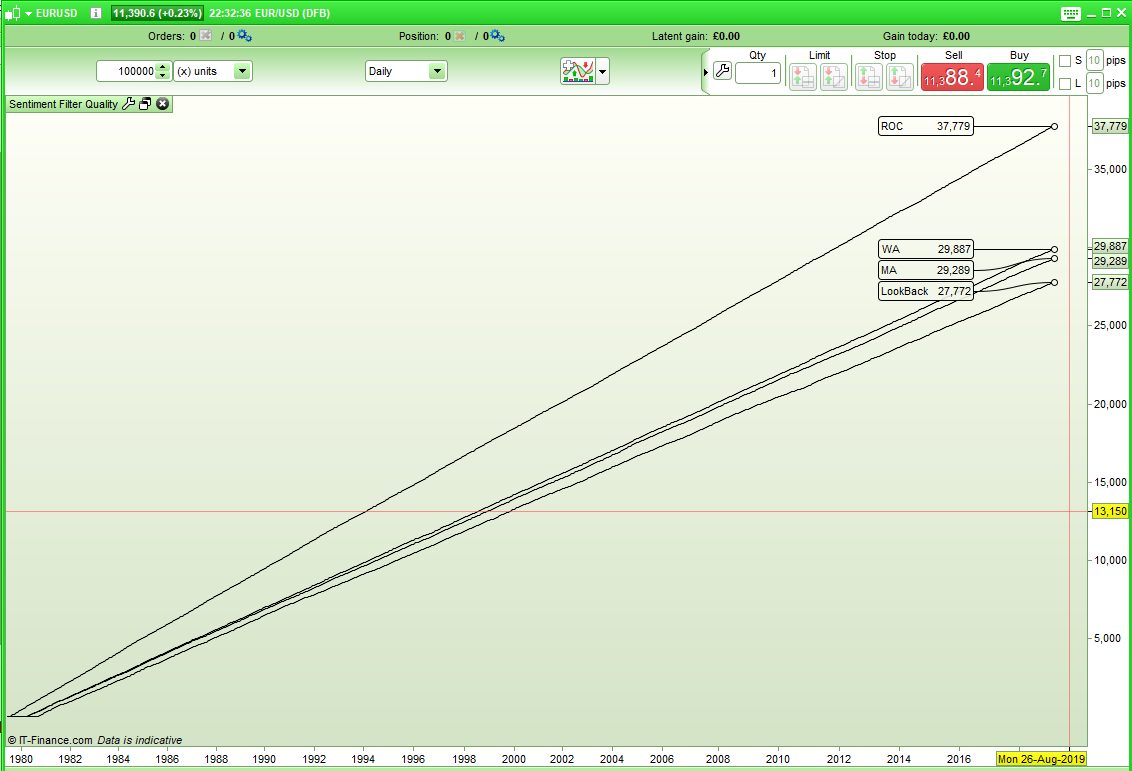
return filter1 as "MA", filter2 as "WA", filter3 as "ROC", filter4 as "LookBack"
[attachment file=92416]
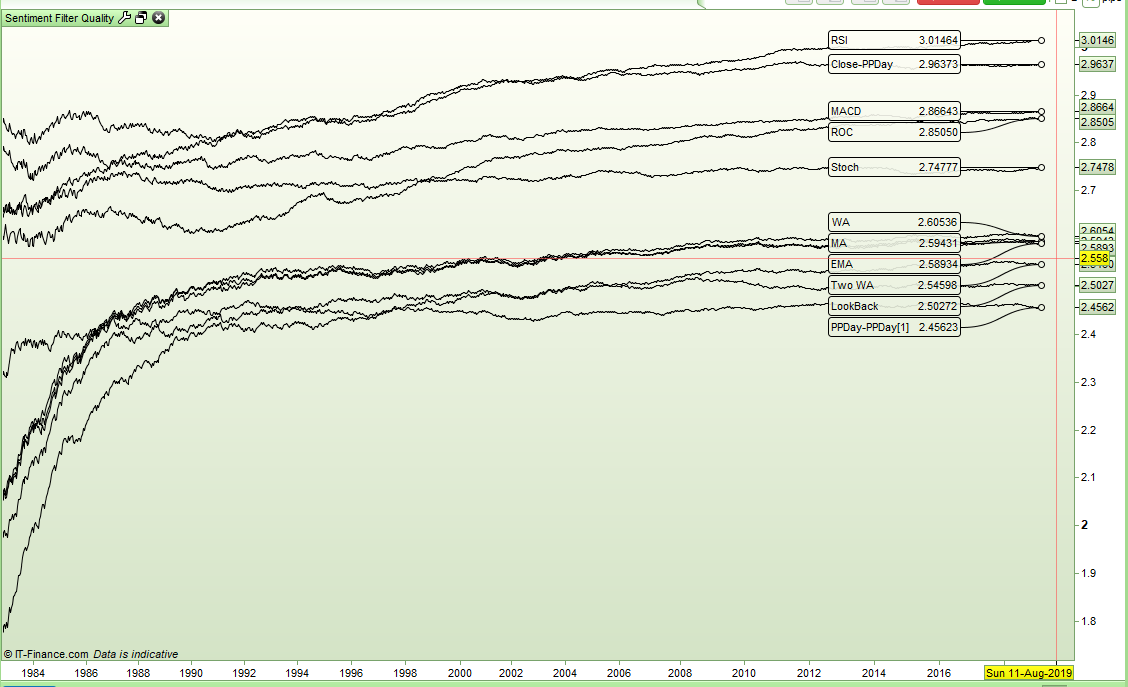
It can be seen that based on five different quality gauges the ROC[22] sentiment filter scores a far higher sentiment filter quality rating than the average filters or the look back filter.
I’m thinking that it might be better to write it as a fake strategy as that way we can optimize a variable so as to see a bigger range of sentiment filters. The other option is another for next loop and some code to identify which filter is the highest scoring of them all. Maybe I am already overcomplicating it!
I realised that there is a flaw in my code as it is recording quality and filter conditions met on the same candle where in reality we need to check filter conditions as being met on the previous candle and then record the quality on the current candle. Here is the modified code so far with some added filters:
f1 = close > average[200]
f2 = close > weightedaverage[200]
f3 = ROC[14] > ROC[14][1]
f4 = close > close[300]
f5 = macd[26,12,9] > macd[26,12,9][1]
f6 = stochastic[10,5] > stochastic[10,5][1]
f7 = rsi[14] > rsi[14][1]
f8 = close > exponentialaverage[200]
up1 = close > open
up2 = medianprice > medianprice[1]
up3 = weightedclose > weightedclose[1]
up4 = typicalprice > typicalprice[1]
up5 = totalprice > totalprice[1]
for a = 1 to 5
if a = 1 then
up = up1
endif
if a = 2 then
up = up2
endif
if a = 3 then
up = up3
endif
if a = 4 then
up = up4
endif
if a = 5 then
up = up5
endif
if (f1[1] and up) or (not f1[1] and not up) then
filter1 = filter1 + 1
endif
if (f2[1] and up) or (not f2[1] and not up) then
filter2 = filter2 + 1
endif
if (f3[1] and up) or (not f3[1] and not up) then
filter3 = filter3 + 1
endif
if (f4[1] and up) or (not f4[1] and not up) then
filter4 = filter4 + 1
endif
if (f5[1] and up) or (not f5[1] and not up) then
filter5 = filter5 + 1
endif
if (f6[1] and up) or (not f6[1] and not up) then
filter6 = filter6 + 1
endif
if (f7[1] and up) or (not f7[1] and not up) then
filter7 = filter7 + 1
endif
if (f8[1] and up) or (not f8[1] and not up) then
filter8 = filter8 + 1
endif
next
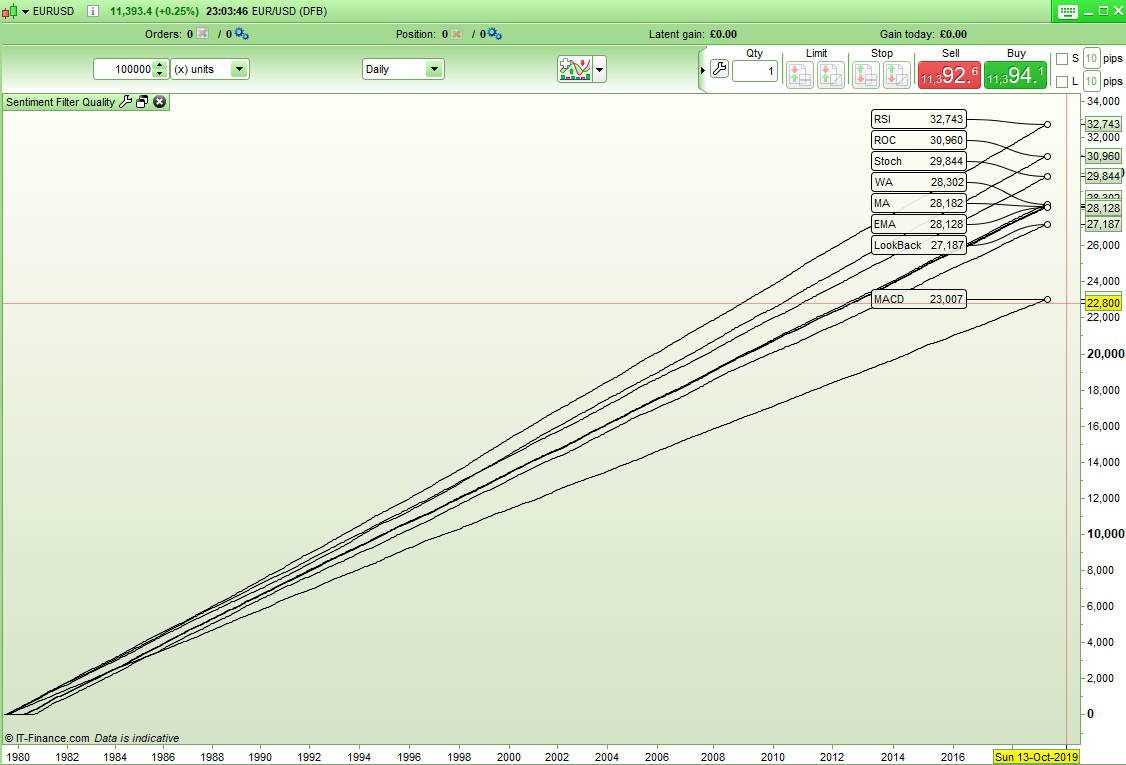
return filter1 as "MA", filter2 as "WA", filter3 as "ROC", filter4 as "LookBack", filter5 as "MACD", filter6 as "Stoch", filter7 as "RSI", filter8 as "EMA"
[attachment file=92423]
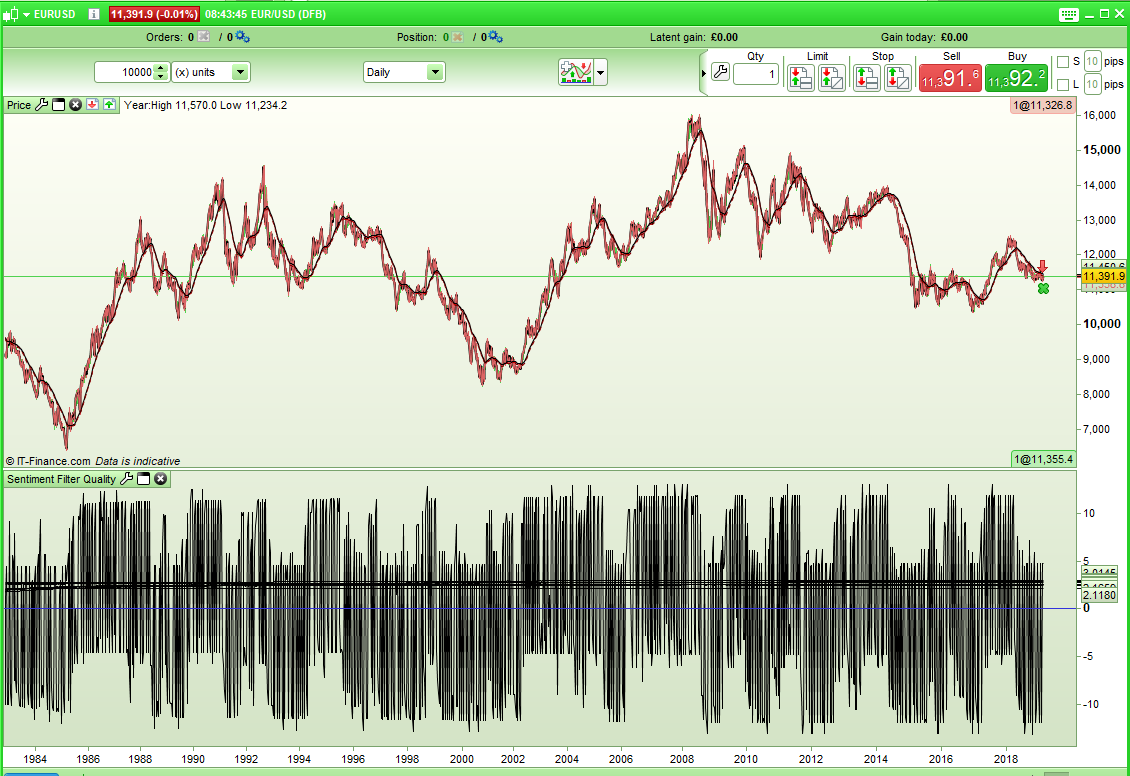
RSI[14] rising or falling is currently showing as the best quality sentiment filter on EURUSD Daily.
Hello Vonasi,
Maybe we can add a Point Pivot filter, so wheter the price is above or below is 1H Pivot?
IF Openhour <> openhour[1]  THEN
myLastHigh = myHigh
myLastLow = myLow
myLastClose = Close[1]
myHigh = High
myLow = Low
myopen=open
ELSE
myHigh = Max(myHigh, High)
myLow = Min(myLow, Low)
ENDIF

PP = (myLastHigh + myLastLow + myLastClose) / 3
At the moment I am trying to stick to daily charts but your code and some other filter ideas that I have had have raised the issue that the way it is coded at the moment only allows for sentiment filters where a condition is either met or not met rather than two slightly different conditions that toggle between bullish and bearish (for example your high and low pivot breaks) – so I may have to rethink the way it is coded.
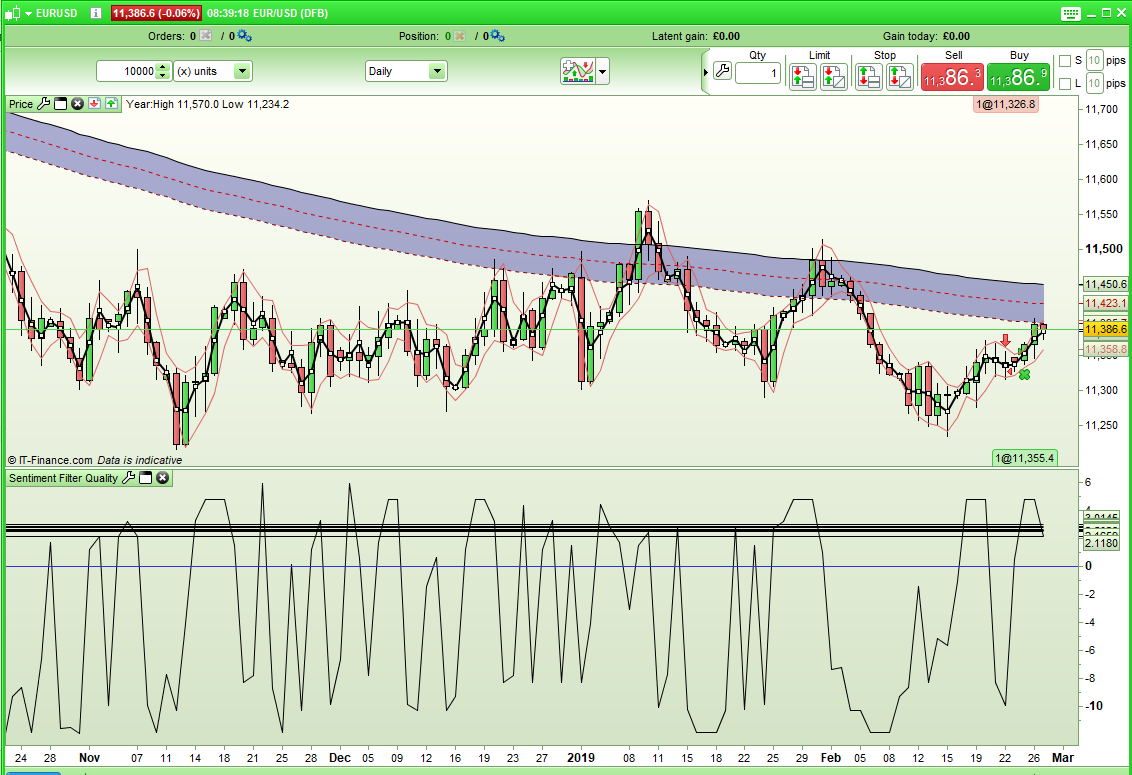
Another thought that I had was that it might make an interesting strategy idea. Quality ratings for each sentiment filter could be recorded and then each new candle checked to see which conditions it meets and given an overall quality rating for bullish or bearish. The quality rating would need to be normalized by dividing the latest result by the number of candles so far so the chart would be more like this:
[attachment file=92443]
Hello, is it possible to plot/graph in what market filter it was during my trades (from backtest)?
Does that make sense?
I would like to see if the majority of my winning trades match with one or more of your filter 1-8
That is an interesting new way of looking at it jebus89! Within your strategy you would need to check what filter conditions are met at each entry order and flag them as being met and then check to see if it is a profit or non profit trade at the exit and score each relevant filter accordingly and then reset the flags. With straight market orders it should be do-able and even possible with pending orders if you check that the levels were hit. It is too difficult to do if there are multiple positions but very possible for single positions.
Here is my first slightly messy attempt to give each filter a rating and then check the current candle to see which filters it meets and give it an overall rating. if the line is below zero then it indicates short and the further below the stronger the signal.
f1 = close > average[200]
f2 = close > weightedaverage[200]
f3 = ROC[14] > ROC[14][1]
f4 = close > close[300]
f5 = macd[26,12,9] > macd[26,12,9][1]
f6 = stochastic[10,5] > stochastic[10,5][1]
f7 = rsi[14] > rsi[14][1]
f8 = close > exponentialaverage[200]
f9 = weightedaverage[100] > weightedaverage[200]
up1 = close > open
up2 = medianprice > medianprice[1]
up3 = weightedclose > weightedclose[1]
up4 = typicalprice > typicalprice[1]
up5 = totalprice > totalprice[1]
thisbar = 0
for a = 1 to 5
if a = 1 then
up = up1
endif
if a = 2 then
up = up2
endif
if a = 3 then
up = up3
endif
if a = 4 then
up = up4
endif
if a = 5 then
up = up5
endif
if (f1[1] and up) then
filter1 = filter1 + 1
thisbar = thisbar + filter1
endif
if (not f1[1] and not up) then
filter1 = filter1 + 1
thisbar = thisbar - filter1
endif
if (f2[1] and up) then
filter2 = filter2 + 1
thisbar = thisbar + filter2
endif
if (not f2[1] and not up) then
filter2 = filter2 + 1
thisbar = thisbar - filter2
endif
if (f3[1] and up) then
filter3 = filter3 + 1
thisbar = thisbar + filter3
endif
if (not f3[1] and not up) then
filter3 = filter3 + 1
thisbar = thisbar - filter3
endif
if (f4[1] and up) then
filter4 = filter4 + 1
thisbar = thisbar + filter4
endif
if (not f4[1] and not up) then
filter4 = filter4 + 1
thisbar = thisbar - filter4
endif
if (f5[1] and up) then
filter5 = filter5 + 1
thisbar = thisbar + filter5
endif
if (not f5[1] and not up) then
filter5 = filter5 + 1
thisbar = thisbar - filter5
endif
if (f6[1] and up) then
filter6 = filter6 + 1
thisbar = thisbar + filter6
endif
if (not f6[1] and not up) then
filter6 = filter6 + 1
thisbar = thisbar - filter6
endif
if (f7[1] and up) then
filter7 = filter7 + 1
thisbar = thisbar + filter7
endif
if (not f7[1] and not up) then
filter7 = filter7 + 1
thisbar = thisbar - filter7
endif
if (f8[1] and up) then
filter8 = filter8 + 1
thisbar = thisbar + filter8
endif
if (not f8[1] and not up) then
filter8 = filter8 + 1
thisbar = thisbar - filter8
endif
if (f9[1] and up) then
filter9 = filter9 + 1
thisbar = thisbar + filter9
endif
if (not f9[1] and not up) then
filter9 = filter9 + 1
thisbar = thisbar - filter9
endif
next
result1 = filter1/barindex
result2 = filter2/barindex
result3 = filter3/barindex
result4 = filter4/barindex
result5 = filter5/barindex
result6 = filter6/barindex
result7 = filter7/barindex
result8 = filter8/barindex
result9 = filter9/barindex
thisbar = (thisbar/barindex)/9
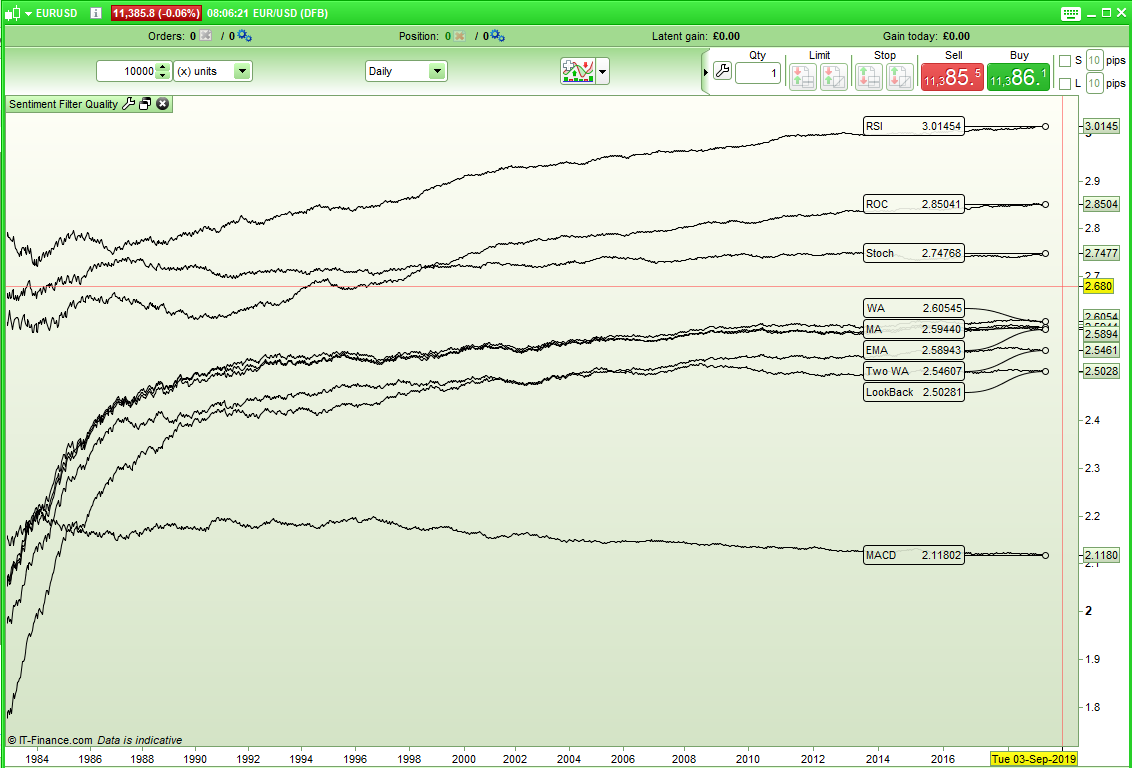
return result1 as "MA", result2 as "WA", result3 as "ROC", result4 as "LookBack", result5 as "MACD", result6 as "Stoch", result7 as "RSI", result8 as "EMA", result9 as "Two WA", thisbar as "This Bar"
[attachment file=92451]
It is quiet interesting to see how clearly the bull and bear periods are highlighted by either overall raised ratings or overall lowered ratings when you zoom out.
[attachment file=92454]
Note: I just realised that my MACD filter has the wrong settings in all the above code – it should be MACD[12,26,9] and not MACD[26,12,9]. I guess this can happen if coding in the early hours after a glass or two of wine!
Sorry I thought it was intraday. But Daily Pivot Point are widely use for trading equity index, so curious on this compares to other indicators.
// POINT PIVOT JOURNALIER
IF dayofweek = 1 THEN
dayhigh = DHigh(2)
daylow = DLow(2)
dayclose = DClose(2)
ENDIF

IF dayofweek >=2 and dayofweek < 6 THEN
dayhigh = DHigh(1)
daylow = DLow(1)
dayclose = DClose(1)
ENDIF

PPDay = (dayhigh + daylow + dayclose) / 3
stefou102 – How would you set the sentiment filter condition? Today’s pivot is higher or lower than yesterdays pivot? The close is higher or lower than the pivot? I feel it would be a bit choppy as a sentiment filter but we can try something.
Here is the code with the two above filters added and the results with the ‘This Bar’ result hidden.
filterqty = 11

//PPDay Calculations
IF dayofweek = 1 THEN
dayhigh = DHigh(2)
daylow = DLow(2)
dayclose = DClose(2)
ENDIF
IF dayofweek >=2 and dayofweek < 6 THEN
dayhigh = DHigh(1)
daylow = DLow(1)
dayclose = DClose(1)
ENDIF
PPDay = (dayhigh + daylow + dayclose) / 3

f1 = close > average[200]
f2 = close > weightedaverage[200]
f3 = ROC[14] > ROC[14][1]
f4 = close > close[300]
f5 = macd[12,26,9] > macd[12,26,9][1]
f6 = stochastic[10,5] > stochastic[10,5][1]
f7 = rsi[14] > rsi[14][1]
f8 = close > exponentialaverage[200]
f9 = weightedaverage[100] > weightedaverage[200]
f10 = ppday > ppday[1]
f11 = close > ppday

up1 = close > open
up2 = medianprice > medianprice[1]
up3 = weightedclose > weightedclose[1]
up4 = typicalprice > typicalprice[1]
up5 = totalprice > totalprice[1]

thisbar = 0

for a = 1 to 5

if a = 1 then
up = up1
endif
if a = 2 then
up = up2
endif
if a = 3 then
up = up3
endif
if a = 4 then
up = up4
endif
if a = 5 then
up = up5
endif

if (f1[1] and up) then
filter1 = filter1 + 1
thisbar = thisbar + filter1
endif
if (not f1[1] and not up) then
filter1 = filter1 + 1
thisbar = thisbar - filter1
endif

if (f2[1] and up) then
filter2 = filter2 + 1
thisbar = thisbar + filter2
endif
if (not f2[1] and not up) then
filter2 = filter2 + 1
thisbar = thisbar - filter2
endif

if (f3[1] and up) then
filter3 = filter3 + 1
thisbar = thisbar + filter3
endif
if (not f3[1] and not up) then
filter3 = filter3 + 1
thisbar = thisbar - filter3
endif

if (f4[1] and up) then
filter4 = filter4 + 1
thisbar = thisbar + filter4
endif
if (not f4[1] and not up) then
filter4 = filter4 + 1
thisbar = thisbar - filter4
endif

if (f5[1] and up) then
filter5 = filter5 + 1
thisbar = thisbar + filter5
endif
if (not f5[1] and not up) then
filter5 = filter5 + 1
thisbar = thisbar - filter5
endif

if (f6[1] and up) then
filter6 = filter6 + 1
thisbar = thisbar + filter6
endif
if (not f6[1] and not up) then
filter6 = filter6 + 1
thisbar = thisbar - filter6
endif

if (f7[1] and up) then
filter7 = filter7 + 1
thisbar = thisbar + filter7
endif
if (not f7[1] and not up) then
filter7 = filter7 + 1
thisbar = thisbar - filter7
endif

if (f8[1] and up) then
filter8 = filter8 + 1
thisbar = thisbar + filter8
endif
if (not f8[1] and not up) then
filter8 = filter8 + 1
thisbar = thisbar - filter8
endif

if (f9[1] and up) then
filter9 = filter9 + 1
thisbar = thisbar + filter9
endif
if (not f9[1] and not up) then
filter9 = filter9 + 1
thisbar = thisbar - filter9
endif

if (f10[1] and up) then
filter10 = filter10 + 1
thisbar = thisbar + filter10
endif
if (not f10[1] and not up) then
filter10 = filter10 + 1
thisbar = thisbar - filter10
endif

if (f11[1] and up) then
filter11 = filter11 + 1
thisbar = thisbar + filter11
endif
if (not f11[1] and not up) then
filter11 = filter11 + 1
thisbar = thisbar - filter11
endif
next

result1 = filter1/barindex
result2 = filter2/barindex
result3 = filter3/barindex
result4 = filter4/barindex
result5 = filter5/barindex
result6 = filter6/barindex
result7 = filter7/barindex
result8 = filter8/barindex
result9 = filter9/barindex
result10 = filter10/barindex
result11 = filter11/barindex

thisbar = (thisbar/barindex)/filterqty

return result1 as "MA", result2 as "WA", result3 as "ROC", result4 as "LookBack", result5 as "MACD", result6 as "Stoch", result7 as "RSI", result8 as "EMA", result9 as "Two WA", result10 as "PPDay-PPDay[1]", result11 as "Close-PPDay", thisbar as "This Bar"
[attachment file=92459]
It appears that comparing close to PPDay is a pretty good sentiment filter on the EURUSD although this is a bit like saying what is the probability of price going up tomorrow if price closes above the pivot point? Not really a market filter but maybe something that improves our chance of being right tomorrow!
Indeed the simple theory around Pivot Point is if price is above daily pivot point, this is bullish and vice versa. For traders, Pivot Points and their extention S1/S2/S3 R1/R1/R3 give support and resistance level, which in conjunction with more classical resistance/support drawing (previous high/low, bollinger bands, etc), can confirm some strong inflexion price, certainly when the market is not in “one direction” mode.
So if I understand well your work, pivot point and RSI both stand out as quality filter so far?
So if I understand well your work, pivot point and RSI both stand out as quality filter so far?
The whole concept of giving a quality rating to filter conditions is still a work in progress in its early stages. I have only so far tested on one instrument and I have not even really gone through the code with a fine tooth comb to make sure that it is doing what I think it is doing so I would not use any of the results as the basis for deciding on a filter for a strategy just yet!
Unfortunately I am busy at the moment with other non trading related projects and so I am really only giving this a few minutes at a time when I get a chance to.