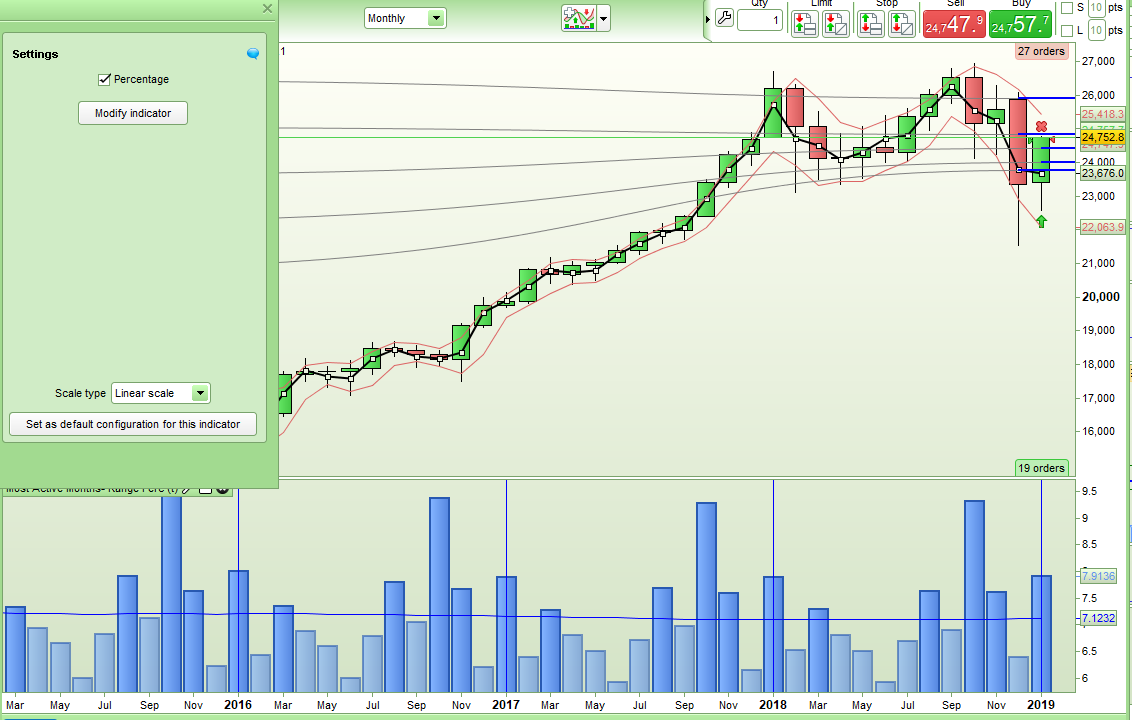
Manel suggested that basing my Most Active Months – Range indicator on range as a percentage of opening price would give a more useful output – especially when applied on indices where range and price historically increase with time so I have modified it slightly to do this.
You can now toggle between the original output and an output shown as a percentage of price by ticking or unticking the Percentage box.
Here is the ITF to download and import:
[attachment file=”Most Active Months – Range v2.itf”]
…and the code:
//Most Active Months - Range v2
//By Vonasi
//20012019

//Percentage = 1

if percentage then
IF openmonth = 1 THEN
H1 = (H1 + (((High - Low) / Open) * 100))
H1Count = (H1Count + 1)
ThisMonth = (H1 / H1Count)
drawvline(barindex) coloured(0,0,255)
ELSIF openmonth = 2 THEN
H2 = (H2 + (((High - Low) / Open) * 100))
H2Count = (H2Count + 1)
ThisMonth = (H2 / H2Count)
ELSIF openmonth = 3 THEN
H3 = (H3 + (((High - Low) / Open) * 100))
H3Count = (H3Count + 1)
ThisMonth = (H3 / H3Count)
ELSIF openmonth = 4 THEN
H4 = (H4 + (((High - Low) / Open) * 100))
H4Count = (H4Count + 1)
ThisMonth = (H4 / H4Count)
ELSIF openmonth = 5 THEN
H5 = (H5 + (((High - Low) / Open) * 100))
H5Count = (H5Count + 1)
ThisMonth = (H5 / H5Count)
ELSIF openmonth = 6 THEN
H6 = (H6 + (((High - Low) / Open) * 100))
H6Count = (H6Count + 1)
ThisMonth = (H6 / H6Count)
ELSIF openmonth = 7 THEN
H7 = (H7 + (((High - Low) / Open) * 100))
H7Count = (H7Count + 1)
ThisMonth = (H7 / H7Count)
ELSIF openmonth = 8 THEN
H8 = (H8 + (((High - Low) / Open) * 100))
H8Count = (H8Count + 1)
ThisMonth = (H8 / H8Count)
ELSIF openmonth = 9 THEN
H9 = (H9 + (((High - Low) / Open) * 100))
H9Count = (H9Count + 1)
ThisMonth = (H9 / H9Count)
ELSIF openmonth = 10 THEN
H10 = (H10 + (((High - Low) / Open) * 100))
H10Count = (H10Count + 1)
ThisMonth = (H10 / H10Count)
ELSIF openmonth = 11 THEN
H11 = (H11 + (((High - Low) / Open) * 100))
H11Count = (H11Count + 1)
ThisMonth = (H11 / H11Count)
ELSIF openmonth = 12 THEN
H12 = (H12 + (((High - Low) / Open) * 100))
H12Count = (H12Count + 1)
ThisMonth = (H12 / H12Count)
ENDIF
endif

if not percentage then
IF openmonth = 1 THEN
H1 = (H1 + (High - Low))
H1Count = (H1Count + 1)
ThisMonth = (H1 / H1Count)
drawvline(barindex) coloured(0,0,255)
ELSIF openmonth = 2 THEN
H2 = (H2 + (High - Low))
H2Count = (H2Count + 1)
ThisMonth = (H2 / H2Count)
ELSIF openmonth = 3 THEN
H3 = (H3 + (High - Low))
H3Count = (H3Count + 1)
ThisMonth = (H3 / H3Count)
ELSIF openmonth = 4 THEN
H4 = (H4 + (High - Low))
H4Count = (H4Count + 1)
ThisMonth = (H4 / H4Count)
ELSIF openmonth = 5 THEN
H5 = (H5 + (High - Low))
H5Count = (H5Count + 1)
ThisMonth = (H5 / H5Count)
ELSIF openmonth = 6 THEN
H6 = (H6 + (High - Low))
H6Count = (H6Count + 1)
ThisMonth = (H6 / H6Count)
ELSIF openmonth = 7 THEN
H7 = (H7 + (High - Low))
H7Count = (H7Count + 1)
ThisMonth = (H7 / H7Count)
ELSIF openmonth = 8 THEN
H8 = (H8 + (High - Low))
H8Count = (H8Count + 1)
ThisMonth = (H8 / H8Count)
ELSIF openmonth = 9 THEN
H9 = (H9 + (High - Low))
H9Count = (H9Count + 1)
ThisMonth = (H9 / H9Count)
ELSIF openmonth = 10 THEN
H10 = (H10 + (High - Low))
H10Count = (H10Count + 1)
ThisMonth = (H10 / H10Count)
ELSIF openmonth = 11 THEN
H11 = (H11 + (High - Low))
H11Count = (H11Count + 1)
ThisMonth = (H11 / H11Count)
ELSIF openmonth = 12 THEN
H12 = (H12 + (High - Low))
H12Count = (H12Count + 1)
ThisMonth = (H12 / H12Count)
ENDIF
endif

avg = (h1 + h2 + h3 + h4 + h5 + h6 + h7 + h8 + h9 + h10 + h11 + h12)/(h1count + h2count + h3count + h4count + h5count + h6count + h7count + h8count + h9count + h10count + h11count + h12count)

c = 155
if ThisMonth > Avg then
c = 255
endif

RETURN ThisMonth coloured (100,149,237,c) style(histogram, 2) as "Average Range", avg coloured(0,0,255) style(line,1) as "All Time Average"
[attachment file=89156]
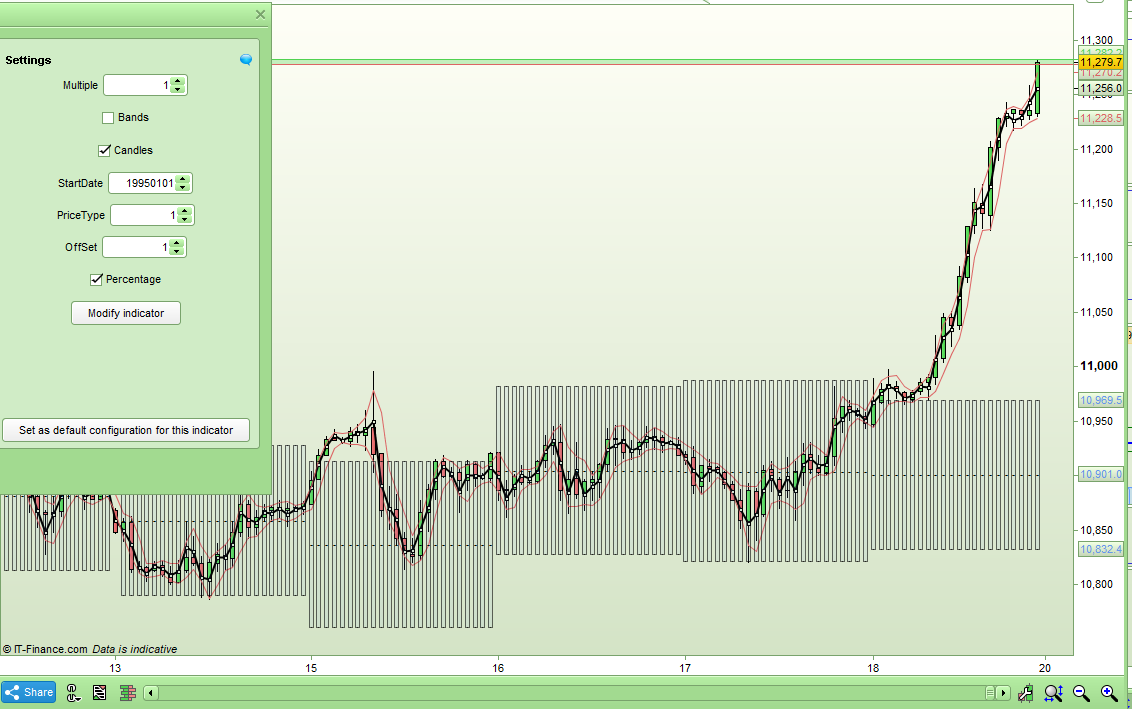
I decided to use Manel’s idea and also modify my DOWAR(OAC) Day Of Week Average Range (On Any Chart) indicator to be able to calculate each days range as a percentage of the opening price each day and then use this percentage value to calculate an average range for each day of the week.
Here is the modified ITF file:
[attachment file=”DOWAR(OAC) Bands v2.itf”]
…and the code:
//DOWAROAC Bands - Day Of Week Average Range (On Any Chart) Bands v2
//By Vonasi
//20012019

//Multiple = 1
//Offset = 1
//Bands = 0
//Candles = 1
//StartDate = 0
//Percentage = 1

if opendate >= StartDate or startdate = 0 then
if opendayofweek[0] <> opendayofweek[1] then
rnge = (dHigh(1) - dLow(1))

//close
if offset = 1 then
if pricetype < 1 or pricetype > 4 then
start = close[1]
endif
//medianprice
if pricetype = 1 then
start = ((rnge)/2) + dlow(1)
endif
//totalprice
if pricetype = 2 then
start = (dopen(1) + close[1] + dHigh(1) + dLow(1))/4
endif
//typicalprice
if pricetype = 3 then
start = (close[1] + dHigh(1) + dLow(1))/3
endif
//weightedprice
if pricetype = 4 then
start = ((2*close[1]) + dHigh(1) + dLow(1))/4
endif
endif

if percentage then
if opendayofweek[1] = 0 THEN
W0 = (W0 + (rnge / Dopen(1)))
W0Count = (W0Count + 1)
endif

IF opendayofweek[1] = 1 THEN
W1 = (W1 + (rnge / Dopen(1)))
W1Count = (W1Count + 1)
endif

IF opendayofweek[1] = 2 THEN
W2 = (W2 + (rnge / Dopen(1)))
W2Count = (W2Count + 1)
endif

IF opendayofweek[1] = 3 THEN
W3 = (W3 + (rnge / Dopen(1)))
W3Count = (W3Count + 1)
endif

IF opendayofweek[1] = 4 THEN
W4 = (W4 + (rnge / Dopen(1)))
W4Count = (W4Count + 1)
endif

IF opendayofweek[1] = 5 THEN
W5 = (W5 + (rnge / Dopen(1)))
W5Count = (W5Count + 1)
endif

if opendayofweek = 0 then
ThisDay = (W0 / W0Count) * start
endif

if opendayofweek = 1 then
ThisDay = (W1 / W1Count) * start
endif

if opendayofweek = 2 then
ThisDay = (W2 / W2Count) * start
endif

if opendayofweek = 3 then
ThisDay = (W3 / W3Count) * start
endif

if opendayofweek = 4 then
ThisDay = (W4 / W4Count) * start
endif

if opendayofweek = 5 then
ThisDay = (W5 / W5Count) * start
endif
endif

if not percentage then
if opendayofweek[1] = 0 THEN
W0 = (W0 + (rnge))
W0Count = (W0Count + 1)
endif

IF opendayofweek[1] = 1 THEN
W1 = (W1 + (rnge))
W1Count = (W1Count + 1)
endif

IF opendayofweek[1] = 2 THEN
W2 = (W2 + (rnge))
W2Count = (W2Count + 1)
endif

IF opendayofweek[1] = 3 THEN
W3 = (W3 + (rnge))
W3Count = (W3Count + 1)
endif

IF opendayofweek[1] = 4 THEN
W4 = (W4 + (rnge))
W4Count = (W4Count + 1)
endif

IF opendayofweek[1] = 5 THEN
W5 = (W5 + (rnge))
W5Count = (W5Count + 1)
endif

if opendayofweek = 0 then
ThisDay = (W0 / W0Count)
endif

if opendayofweek = 1 then
ThisDay = (W1 / W1Count)
endif

if opendayofweek = 2 then
ThisDay = (W2 / W2Count)
endif

if opendayofweek = 3 then
ThisDay = (W3 / W3Count)
endif

if opendayofweek = 4 then
ThisDay = (W4 / W4Count)
endif

if opendayofweek = 5 then
ThisDay = (W5 / W5Count)
endif
endif
endif

if offset <> 1 then
if pricetype < 1 or pricetype > 4 then
start = close[1]
endif
//medianprice
if pricetype = 1 then
start = ((dhigh(0) - dlow(0))/2) + dlow(0)
endif
//totalprice
if pricetype = 2 then
start = (dopen(0) + close[0] + dHigh(0) + dLow(0))/4
endif
//typicalprice
if pricetype = 3 then
start = (close[0] + dHigh(0) + dLow(0))/3
endif
//weightedprice
if pricetype = 4 then
start = ((2*close[0]) + dHigh(0) + dLow(0))/4
endif
endif

upper = start + ((ThisDay * multiple)/2)
lower = start - ((ThisDay * multiple)/2)
middle = ((upper -lower)/2) + lower

if candles then
drawcandle(lower,upper,lower,upper) COLOURED(100,149,237,20) BORDERCOLOR(0,0,0,150)
drawtext("-",barindex,middle) COLOURED(0,0,0)
endif

c = 0
if bands then
c = 255
endif
else
upper = close
lower = close
middle = close
c = 0
endif

RETURN upper coloured (100,149,237,c) style(line, 1) as "Upper Band", lower coloured (100,149,237,c) style(line, 1) as "Lower Band", middle coloured (100,149,237,c) style(line, 1) as "Middle Band"
[attachment file=89163]
Thanks for the update Vonasi ! Much appreciated. Interesting to note that although the average and absolute vales have been increasing over the past 10 years, the %’s have been falling – as you would expect in a bull market as volatility subsides. Also highlights last October was in keeping with others historically and actually less, so helps keep perspective. In fact Feb and Dec were the actual outliers at >2x the average.
Is there a way of easily annotating what the actual current % value of each bar was in the current month on the histogram below ? That way you can visualise the outlier months in the past better.
Edit – actually there probably isn’t as it would mess up the scaling etc on the rhs
Is there a way of easily annotating what the actual current % value of each bar was in the current month on the histogram below ? That way you can visualise the outlier months in the past better.
That should be simple to do. I’m a bit busy at the moment with other things but I’ll try and look at it when I get some time.
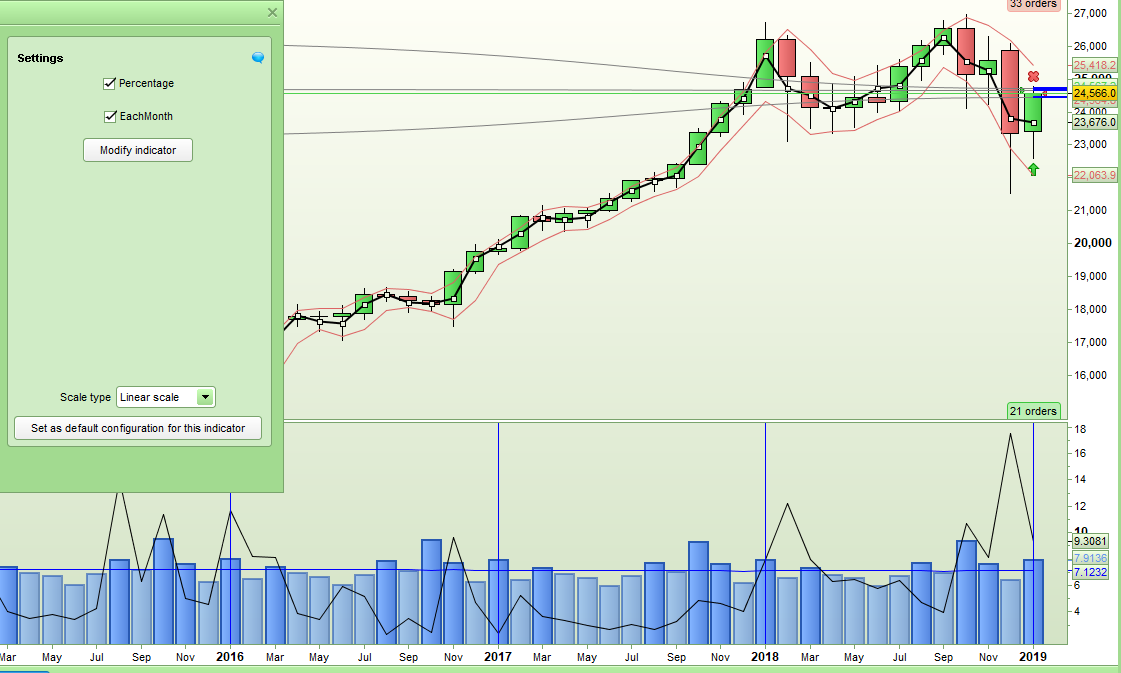
Here you go manel – it was very simple to do but I think gives some interesting output. Tick or untick ‘EachMonth’ to turn on and off the current or historical closing range for each individual month. It works better in percentage.
[attachment file=”Most Active Months – Range v3.itf”]
//Most Active Months - Range v3
//By Vonasi
//20190122

//Percentage = 1
//EachMonth = 1

if percentage then
IF openmonth = 1 THEN
H1 = (H1 + (((High - Low) / Open) * 100))
H1Count = (H1Count + 1)
ThisMonth = (H1 / H1Count)
drawvline(barindex) coloured(0,0,255)
ELSIF openmonth = 2 THEN
H2 = (H2 + (((High - Low) / Open) * 100))
H2Count = (H2Count + 1)
ThisMonth = (H2 / H2Count)
ELSIF openmonth = 3 THEN
H3 = (H3 + (((High - Low) / Open) * 100))
H3Count = (H3Count + 1)
ThisMonth = (H3 / H3Count)
ELSIF openmonth = 4 THEN
H4 = (H4 + (((High - Low) / Open) * 100))
H4Count = (H4Count + 1)
ThisMonth = (H4 / H4Count)
ELSIF openmonth = 5 THEN
H5 = (H5 + (((High - Low) / Open) * 100))
H5Count = (H5Count + 1)
ThisMonth = (H5 / H5Count)
ELSIF openmonth = 6 THEN
H6 = (H6 + (((High - Low) / Open) * 100))
H6Count = (H6Count + 1)
ThisMonth = (H6 / H6Count)
ELSIF openmonth = 7 THEN
H7 = (H7 + (((High - Low) / Open) * 100))
H7Count = (H7Count + 1)
ThisMonth = (H7 / H7Count)
ELSIF openmonth = 8 THEN
H8 = (H8 + (((High - Low) / Open) * 100))
H8Count = (H8Count + 1)
ThisMonth = (H8 / H8Count)
ELSIF openmonth = 9 THEN
H9 = (H9 + (((High - Low) / Open) * 100))
H9Count = (H9Count + 1)
ThisMonth = (H9 / H9Count)
ELSIF openmonth = 10 THEN
H10 = (H10 + (((High - Low) / Open) * 100))
H10Count = (H10Count + 1)
ThisMonth = (H10 / H10Count)
ELSIF openmonth = 11 THEN
H11 = (H11 + (((High - Low) / Open) * 100))
H11Count = (H11Count + 1)
ThisMonth = (H11 / H11Count)
ELSIF openmonth = 12 THEN
H12 = (H12 + (((High - Low) / Open) * 100))
H12Count = (H12Count + 1)
ThisMonth = (H12 / H12Count)
ENDIF
Now = ((High - Low) / Open) * 100
endif

if not percentage then
IF openmonth = 1 THEN
H1 = (H1 + (High - Low))
H1Count = (H1Count + 1)
ThisMonth = (H1 / H1Count)
drawvline(barindex) coloured(0,0,255)
ELSIF openmonth = 2 THEN
H2 = (H2 + (High - Low))
H2Count = (H2Count + 1)
ThisMonth = (H2 / H2Count)
ELSIF openmonth = 3 THEN
H3 = (H3 + (High - Low))
H3Count = (H3Count + 1)
ThisMonth = (H3 / H3Count)
ELSIF openmonth = 4 THEN
H4 = (H4 + (High - Low))
H4Count = (H4Count + 1)
ThisMonth = (H4 / H4Count)
ELSIF openmonth = 5 THEN
H5 = (H5 + (High - Low))
H5Count = (H5Count + 1)
ThisMonth = (H5 / H5Count)
ELSIF openmonth = 6 THEN
H6 = (H6 + (High - Low))
H6Count = (H6Count + 1)
ThisMonth = (H6 / H6Count)
ELSIF openmonth = 7 THEN
H7 = (H7 + (High - Low))
H7Count = (H7Count + 1)
ThisMonth = (H7 / H7Count)
ELSIF openmonth = 8 THEN
H8 = (H8 + (High - Low))
H8Count = (H8Count + 1)
ThisMonth = (H8 / H8Count)
ELSIF openmonth = 9 THEN
H9 = (H9 + (High - Low))
H9Count = (H9Count + 1)
ThisMonth = (H9 / H9Count)
ELSIF openmonth = 10 THEN
H10 = (H10 + (High - Low))
H10Count = (H10Count + 1)
ThisMonth = (H10 / H10Count)
ELSIF openmonth = 11 THEN
H11 = (H11 + (High - Low))
H11Count = (H11Count + 1)
ThisMonth = (H11 / H11Count)
ELSIF openmonth = 12 THEN
H12 = (H12 + (High - Low))
H12Count = (H12Count + 1)
ThisMonth = (H12 / H12Count)
ENDIF
Now = High - Low
endif

avg = (h1 + h2 + h3 + h4 + h5 + h6 + h7 + h8 + h9 + h10 + h11 + h12)/(h1count + h2count + h3count + h4count + h5count + h6count + h7count + h8count + h9count + h10count + h11count + h12count)

c = 155
if ThisMonth > Avg then
c = 255
endif

c2 = 0
if EachMonth then
c2 = 255
endif

RETURN ThisMonth coloured (100,149,237,c) style(histogram, 2) as "Average Range", avg coloured(0,0,255) style(line,1) as "All Time Average", now coloured(0,0,0,c2) style(line,1) as "This Month"
[attachment file=89333]
Excellent ! Thanks. Interesting info here, am thinking more from a macro view and longer term strategies and use as a filter. Just need to figure out how best to interpret or if a shorter tf is better. Cheers.
Interesting info here, am thinking more from a macro view and longer term strategies and use as a filter.
It is always a good idea to have a finger on the pulse of the bigger picture.
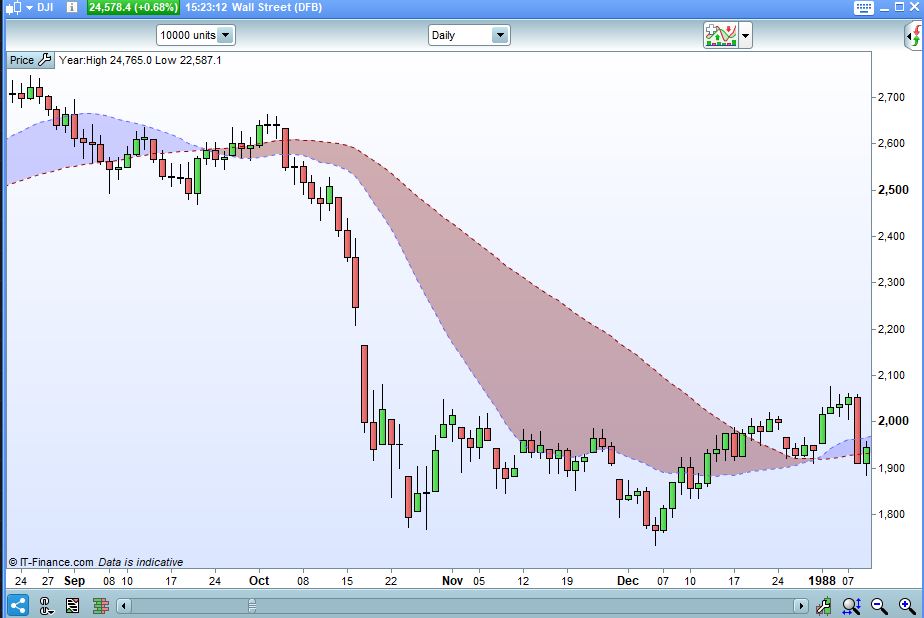
So, looking at the data in more detail for periods of exceptional vol especially, I encountered an issue with the data series. I specifically was looking for big market events at first and so chose the Dow but there is an error with the PRT chart data for the 87 crash. More specifically the intraday ranges for 19/20/21 Oct are all incorrect. People may know that on Monday the market fell 20%+ but the PRT chart only shows a range less than half that (even accounting for the opening gap from Friday close). This of course will skew any average calculations etc especially due to the magnitude of the move as it filters through and impacts future calculations.
In this particular case coincidentally as the index revisted the Monday lows in the following few days, it didn’t affect what we did here as the month ended up having the correct range – but thats just pure dumb luck (and wouldn’t be the case if we were looking at daily averages). Although granted this period is not especially important in the grand scheme of backtesting, a more important question is that – can the data set in the charts be relied upon with 100% confidence and accuracy ? Because without that, everything that we do here ends up being pretty meaningless. There may be more recent days over the last few years where data is also incorrect.
I have raised a ticket through IG about this data error, and asked them for an explanation and to of course corect it. Will let you know of the response.
The indicator uses HIGH – LOW to calculate range so maybe changing that to RANGE would give a little more accuracy and include any gaps – although gaps on monthly data are not going to be so important as on faster time frames.
The indicator uses HIGH – LOW to calculate range so maybe changing that to RANGE would give a little more accuracy and include any gaps – although gaps on monthly data are not going to be so important as on faster time frames.
Yep, that’s actually a good idea to use range if it includes gaps. But I agree, this is not really an issue on longer timeframes like monthy or even weekly. I’m a bit more concerned about accuracy of the data values in general now.
Sorry I meant TR and not RANGE!
I might change it in my indicators if I can find some time.