Merci, j’ai ajouté l’indicateur à notre bibliothèque, il inspirera certainement beaucoup d’autres utilisateurs 🙂
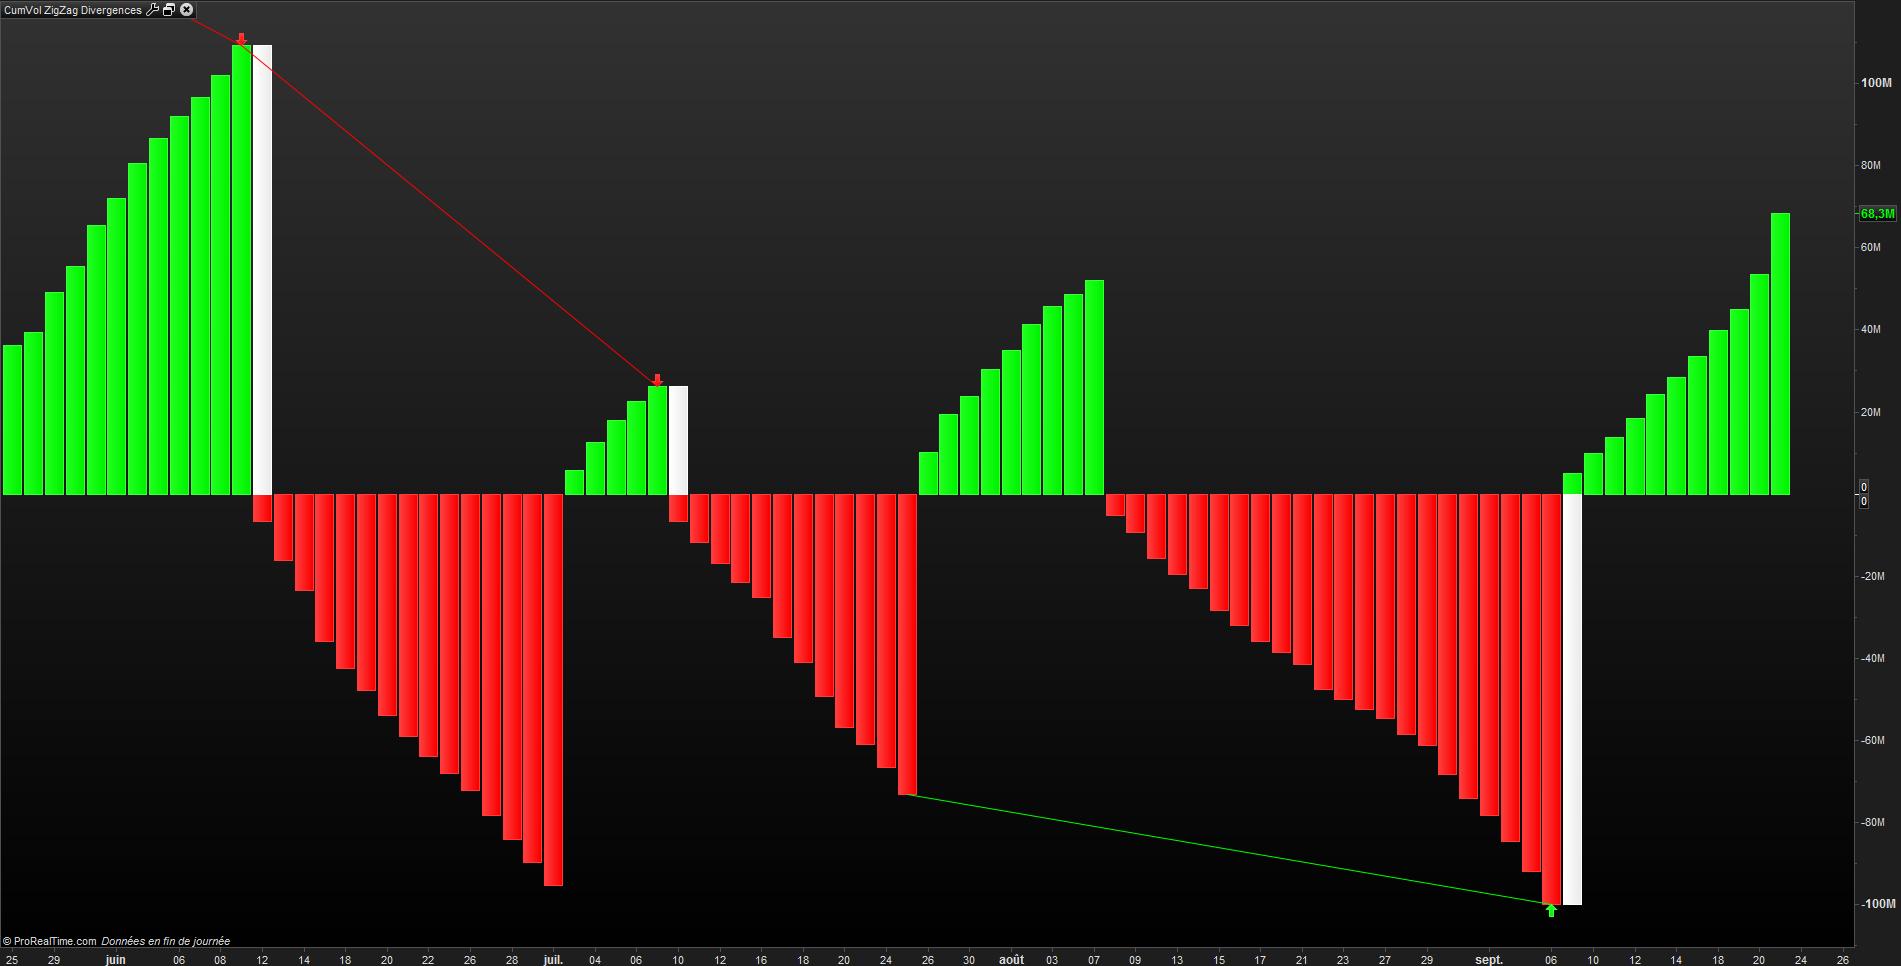
Cumulative volumes zigzag divergences
Hi friends, how could I do a strategy based on this indicator?
I want to open long when tough and open short when peak, but PRT says “Su sistema de trading utiliza instrucciones obsoletas que no son gestionadas por el motor backtest (ZigZag).”
Thanks in advance.
Yes, because due to its repainting nature, zigzag indicator is not allowed in automatic trading through PrOrder.
(PLEASE: speak French in french forums!)
//bearish divergence

if(peak) then
if peakhigh>lastpeakhigh and peakvol<lastpeakvol then
divbear = peakvol
drawsegment(lastpeakbar,lastpeakvol,peakbar,peakvol) coloured(r,g,0)
drawarrowdown(peakbar,peakvol) coloured(r,g,0)
endif
endif

//bearish divergence

if(tough) then
if toughlow<lasttoughlow and toughvol<lasttoughvol then
divbull = toughvol
drawsegment(lasttoughbar,lasttoughvol,toughbar,toughvol) coloured(r,g,0)
drawarrowup(toughbar,toughvol) coloured(r,g,0)
endif
endif
2 codes différents pour un même titre ? il doit y avoir une coquille
Il est pas mal cet indicateur, couplé avec un macd platinum ça donne une bonne idée de l’état de la valeur
MACD Platinum
Bonne fête du travail à tous
Bonjour, cet indicateur repaint d’une barre. J’ai du mal à comprendre l’intêret de prendre un signal short par exemple et le lendemain l’indicateur le met en vert…merci pour vos éclaircissements.
Cet indicateur utilise la détection des points hauts et bas par le ZigZag. Modifier ses anciennes valeurs est le propre de cet indicateur. D’autres indicateurs du même type attendent une période de confirmation avant de signaler de nouveaux points haut et bas, mais évidemment ils arrivent plus “tard”. Il n’y a pas de solution intermédiaires soit on fait avec un temps de latence, soit avec une indication qui pourrait être la bonne, mais qui peut aussi changer à la période suivante. Jusqu’à preuve du contraire, je n’ai pas encore trouvé de formules mathématiques pour prédire le futur 🙂
Bonjour à tous , bonjour Nicolas,
A partir du dernier code modifié par Alain ne pourrais tu nous fabriquer le screener qui nous retourne la barre blanche ( à la fois la divergence et l’histogramme qui croise la valeur 0 )
un screener Up et un Down serait le top.
Bon week end
je joins le graphe de Orange que j’ai l’intention d’acheter lundi si tout va bien
Bonsoir à tous
UP ! Alors une idée pour mon screener ?
On peut essayer avec ça pour voir ? ça devrait faire l’affaire pour détecter les divergences sur le Volume:
//PRC_CumVol ZigZag Divergences | indicator
//14.02.2018
//Nicolas @ www.prorealcode.com
//Sharing ProRealTime knowledge

// --- parameters
percentVariation = 3

zz = ZigZag[percentVariation](close)

peak = zz<zz[1] and zz[1]>zz[2]
tough = zz>zz[1] and zz[1]<zz[2]

if color=1 then
cumV = cumV+volume
else
cumV = cumV-volume
endif

if peak then

lastpeakvol = peakvol
lastpeakhigh = peakhigh
//lastpeakbar = peakbar
peakvol = cumV[1]
peakhigh = high[1]
//peakbar = barindex[1]

cumV = -Volume

color = -1
//r=255
//g=0

elsif tough then

lasttoughvol = toughvol
lasttoughlow = toughlow
//lasttoughbar = toughbar
toughvol = cumV[1]
toughlow = low[1]
//toughbar = barindex[1]

cumV = Volume

color = 1
//r=0
//g=255

endif

//divergences finder
divbear=0
divbull=0
//bearish divergence
if(peak) then
if peakhigh>lastpeakhigh and peakvol<lastpeakvol then
divbear = peakvol
//drawsegment(lastpeakbar,lastpeakvol,peakbar,peakvol) coloured(r,g,0)
//drawarrowdown(peakbar,peakvol) coloured(r,g,0)
endif
endif
//bearish divergence
if(tough) then
if toughlow<lasttoughlow and toughvol<lasttoughvol then
divbull = toughvol
//drawsegment(lasttoughbar,lasttoughvol,toughbar,toughvol) coloured(r,g,0)
//drawarrowup(toughbar,toughvol) coloured(r,g,0)
endif
endif

//return cumV coloured(r,g,0) style(histogram), divbear coloured(255,100,0) style(histogram), divbull coloured(100,255,0) style(histogram)
pos =  divbull[0]
neg =  divbear[0]

screener[pos or neg]
Bonsoir Nicolas
J’ai tardé à répondre car mon disque principal a “explosé” , une fois changé j’ai tout remis en ordre et entré ton code, pour autant ce soir vendredi il ne ressort
rien du screener sur le SRD ?
je vais le tester sur quelques séances pour voir …
merci et bon week end
Testé sur d’autres listes il a fonctionné. C’est très restrictif puisqu’il faut tomber pile poile sur une divergence.
Bonsoir Nicolas
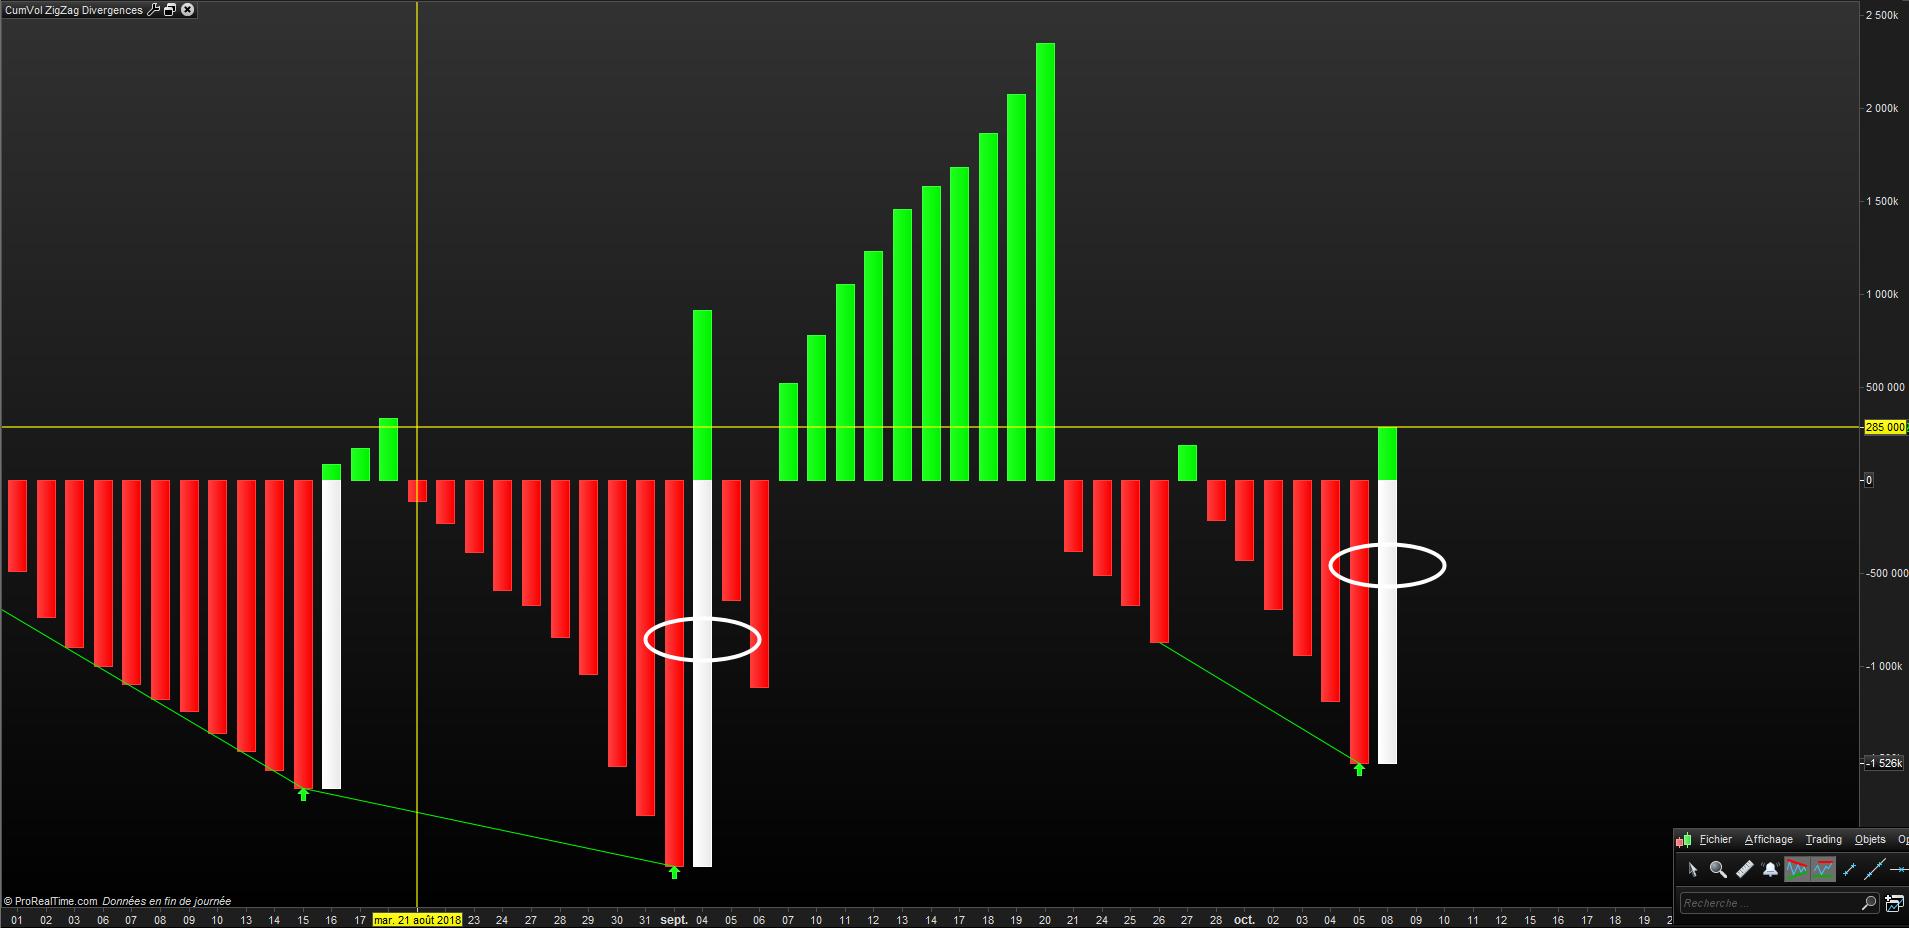
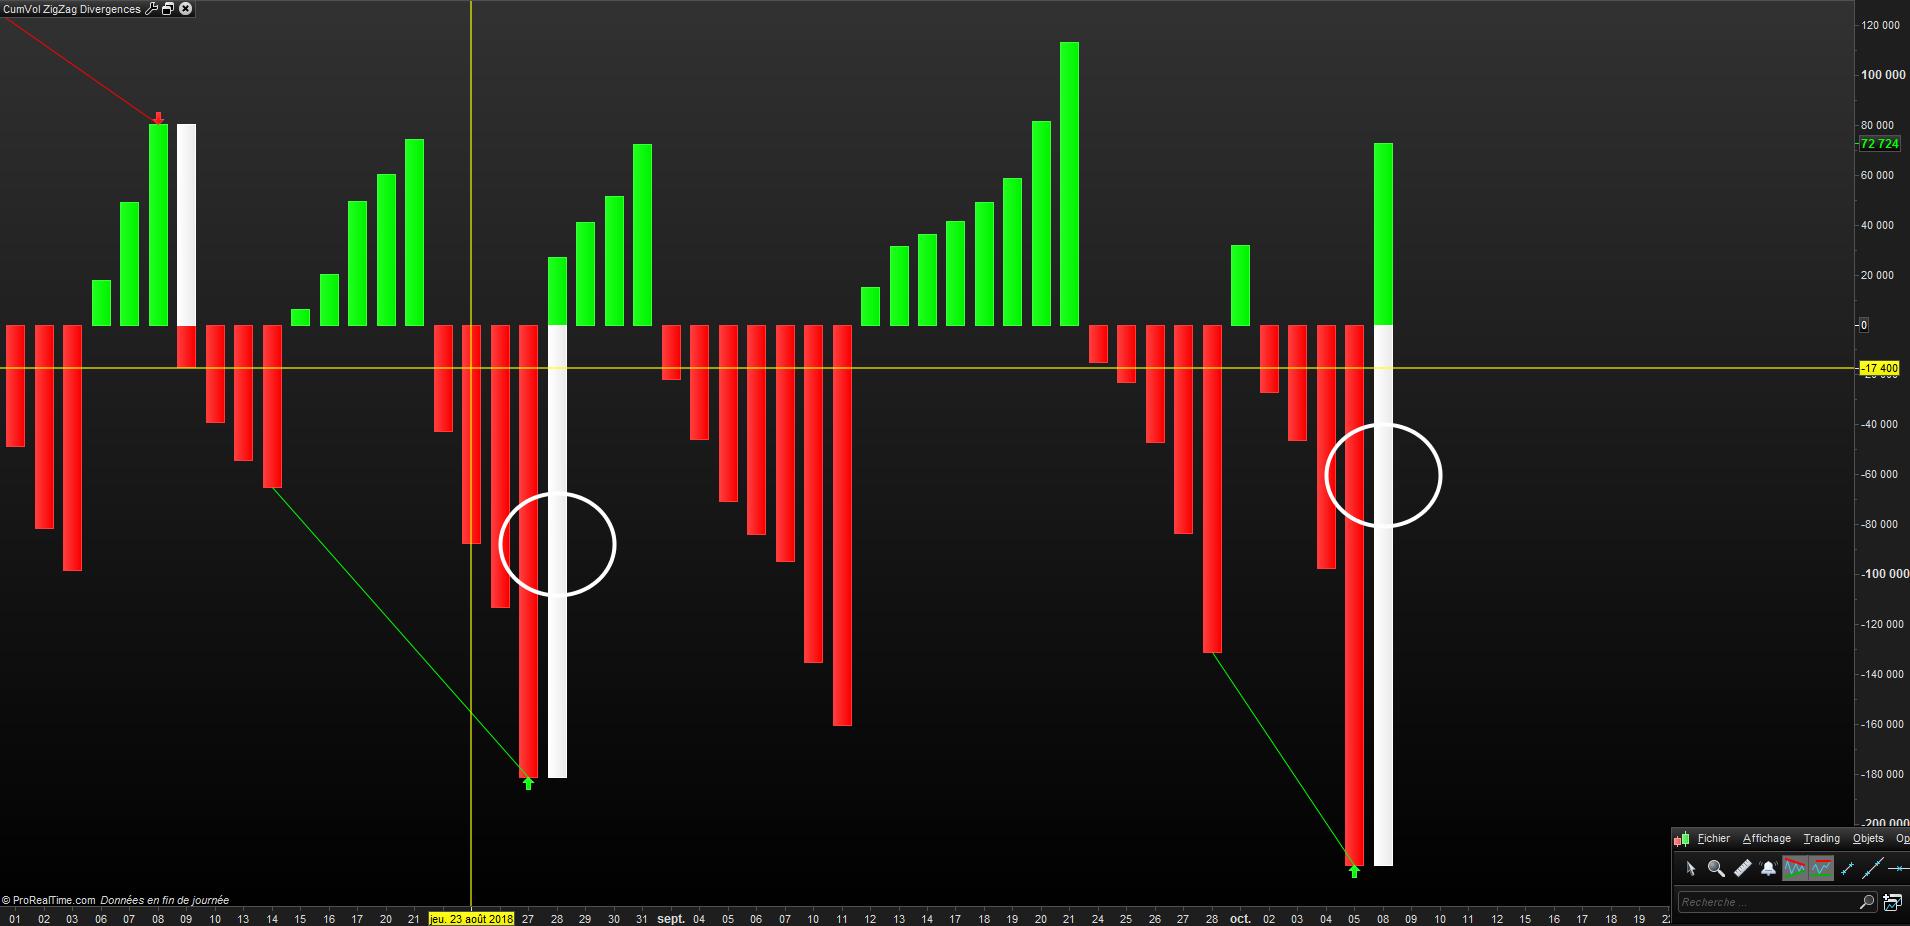
Je viens de passer le screener sur la journée d’aujourd’hui 08.10.18 , sur une liste de valeurs du SRD que je suis ressortent 2 valeurs qui répondent à ce que
je souhaiterais : ILIAD ILd et PLASTIVALOIRE PVL ; images jointes.
Pour autant le screener ne voit rien ?!
à suivre…
nota : tout en sachant que cet indicateur repeint, je l’ai vérifié. Cependant il peut aider à trouver des points d’entrées/sorties.
ce code ne fonctionne pas
ce code ne fonctionne pas
C’est à dire ?
Il peut y avoir plusieurs problèmes:
- être sûr d’avoir l’accès temps réel pour vérifier avec le graphique que la divergence est bien réelle
- avoir le même pourcentage en paramètre pour le ZigZag à la fois sur l’indicateur et le screener pour bien vérifier que la divergence existe
- l’instrument doit avoir du Volume
- ProScreener n’a que 254 bars d’historiques, donc il commence à calculer que 254 bars en arrière, pas l’indicateur qui lui commence dés la première barre affichée (donc données différentes = indications différentes)