Hi,
I encountered some issue regarding the two native functions Lowest and Highest.
After a quick investigation, it seems that these functions are looking on longer periods than the ones that they were asked for.
For example
myHighest = Highest[50] (High)
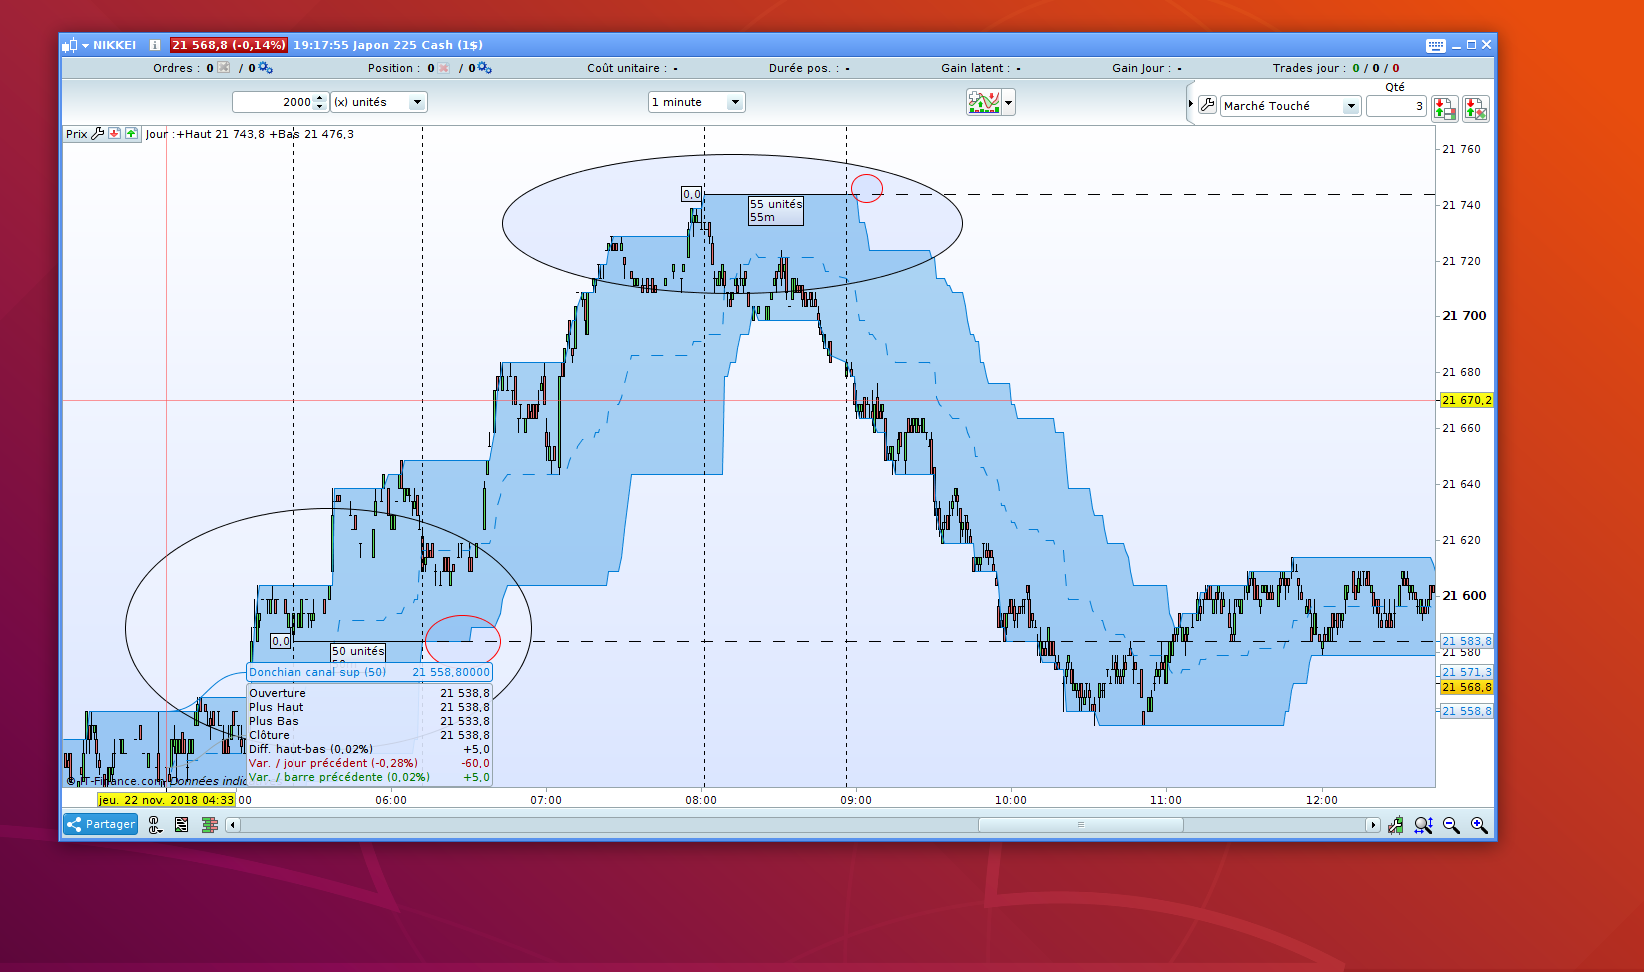
Working on 1 min time frame, the function “Highest” looks up for the highest on more than 55 candles. This seems to be due to undefined candles which are skipped over during calculation, but additional candles are then added…which is wrong.
Impact on widely used indicators:
Donchian indicator suffers from this issue.
Ichimoku : I found some discrepancies between current Ichimoku code (due to Highest and Lowest functions) and the one provided natively as an indicator in PRT. Therefore, when you code Ichimoku, it is not in line with what you see on the charts, which I consider to be an issue.
Any other indicator that uses these functions may be impacted…
I can’t really imagine that this is design choice, if so shouldn’t it be changed?
undefined candles
What do you mean / how are you defining … undefined candles?
Hi GraHal,
not sure how to call them in PRT, but basically when there is no price from the market within the 1min, the candle is not drawn on the chart. In PRT code, you will find out that close, high, open, low are undefined.
Of course, this occurs more often on lower TF, this is a normal and correct behavior regarding what is happening on the market.
The issue I’m pointing at, is not about undefined candles(prices) but the way they are used within standard functions.
for lowest[26](Low), it looks as if PRT finds the lowest on the latest 26 defined Lows. I think this is incorrect, PRT should look at the 26 latest units whether they are defined or not, and just ignore then if they are undefined.
For example, in your code, you want to exit your position when Close crosses the Kijun. If a strong up trend occurs, followed by a long Range possibly containing undefined candles(prices), then the Kijun will be calculated with prices taken before or within the up Trend yielding a Kijun which too low, yielding to an incorrect exit signal.
I spotted the same behaviour on the Donchian channel, yielding possibly to late signals.
Never heard of that before and just realize that this is the case for Highest/Lowest and could impact all indicators based on their calculations.
What about using a loop with Max/Min instructions? Or a continuous test of maximum and minimum values with a reset every X bars (period).
Bonjour Nicolas,
I’ve tried doing the loop with min/max functions, and it works fine, but it is very time-consuming during calculation, specially when you some backtesting. I didn’t understand the second workaround you’re proposing., but for sure it will be much slower than a native function. Still, would you mind explaining your idea?
Moreover, I have multi TF strategies which implement Ichimoku on different TF. Hence, if you consider the SpanB on the 1H TF implemented in PRT on 1min TF, it means you’re looking at 52*60 candles backwards. The effect of this design issue gets worse in such cases.
Worse now, I have some doubts on how undefined prices are dealt with on other functions. I haven’t tested Moving Averages, I thought I could rely on native functions. I think all of them need to be tested regarding this issue.
Yes, there could be a lot of impacts in the indicators.
Hi, this morning I did a test on simple moving average.
Same design issue! You will find that PRT SMA8 = SMA16! The period of observation is doubled due to undefined prices.
I’m providing some data in attachment. Figures are taken from IG, Japon 225 Cash (1$), TF = 1Min,
in PRT : SMA 8 at 23-11-2018 07h16 = 21565.57
in my spreadsheet = 21571.2
conclusion = in PRT when an undefined price is encountered, it is skipped and the period of observation is added 1 unit.
What do you think? Is this a reliable figure?
I had a call with ITF.
This behavior is normal, and once explained, I have a better understanding of the reason of the method used, in fact there are no others.
When no tick is sent by the market, we can’t build candlesticks (even if Open = Close), because that would be like inventing the market itself! For example, if the stock market experiences an interruption, we obviously can’t know it and continue to draw candlesticks, even though the market would have been closed for X or Y reason.
Comparing with other platforms, we notice that they do not draw the holes (no candlesticks), but expect a return of the price to continue to draw the candlesticks. The calculation is therefore identical, since if there were 5 missing candlesticks, the graph is certainly continuous, but they waited well for 55 periods to draw a Donchian channel of 50 periods.
In summary, this behavior is normal, even if we can not aggregate the candlesticks to not see these missing candles in PRT.
Thanks Nicolas,
Yes, that is what I also understood from what I observed in PRT.
Yet another example of something wrong but that becomes true because it’s a convention.
But just to put it straight, I think it’s incorrect. (sorry for this point of view!)
Take a 5 min candlestick, now decompose it in 5 x 1 min candlesticks. Now suppose you want to compute the value of the Low and High of the 5 min candlestick and that a 1 min candlestick is missing. You’re not going to look back in the previous 5 min candlestick for some data. So really, why shouldn’t it be the same for the Highest and Lowest functions?
Couldn’t that choice be left out to the user by providing additional functions or a mode in PRT? I would consider it as a plus for the platform. My signals would be earlier.
Another way to avoid the issue would be to have proOrder accept (x ticks) Time frames. I’m really impatient on that! I also know many people are urging on this feature too. I know that this is a recurring question but do you have any good news on this topic?
It is not too late to ask for new feature to be in the upcoming version 11: https://www.prorealtime.com/en/contact?suggestion=1
Another way to avoid the issue would be to have proOrder accept (x ticks) Time frames. I’m really impatient on that! I also know many people are urging on this feature too. I know that this is a recurring question but do you have any good news on this topic?
I don’t have good news for automatic trading on ticks charts. It is not planned to be possible in a near future… 😐
You’re not going to look back in the previous 5 min candlestick for some data. So really, why shouldn’t it be the same for the Highest and Lowest functions?
I agree. If a bar is missing / undefined then the calculation should miss out the data (lack of) from that bar.
If in MA(50) bars, 5 are missing / undefined then the average would be more accurate (for all the reasons Etienne shows in posts above) if calculated using the data from the 45 bars that are present / available … in my opinion.
That’s different point of view, really.
If you want to make an average on 20 bars, then 20 bars must be present in your chart. It’s a basic understanding of a simple math formula.
In fact, there is no problem, Etienne raises a point of doubt, but that exists according to his point of view, not according to a method of mathematical calculation. If no data exists, then it should not be counted, as simple as that. For this reason, on many other platforms, when no data is sent from the market, no candlesticks are drawn. On PRT, we still decide to advance the time on the scale, but we do not plot the candlestick.
One must resonate as a real candlestick, and not as a passing time when considering a calculation over a given period. This is the conclusion of the “problem” raised by Etienne.
An option to be ticked would be great, so to grant five 1-minute bars don’t span across multiple 5-minute ones!
If you want to make an average on 20 bars, then 20 bars must be present in your chart. It’s a basic understanding of a simple math formula.
This is the key point – on a minute chart the Average[20] is an average of the last 20 actual bars.
If you want an average of the last 20 minutes then you will need to count the barindex and total up the values of all the candles and non candles in the last 20 giving any missing candles the same value as the previous candle and then divide that by 20.
I’ve opened a new feature request on this topic.
Please find the workaround I will be testing today.
DefinedHigh = High
If DefinedHigh = Undefined then
  If High[1] = Undefined then
    DefinedHigh = DefinedHigh[1]
  else
    DefinedHigh = -High[1]  // for large periods
    //DefinedHigh = High[1] // for small periods
   EndIf
Endif

DefinedLow = Low
If DefinedLow = Undefined then
  If Low[1] = Undefined then
   DefinedLow = DefinedLow[1]
  else
   DefinedLow = 8 * Low[1]  // for large periods
   // DefinedLow = Low[1] // for small periods
  EndIf
Endif

Highest50 = highest[50](DefinedHigh)
Lowest50 = lowest[50](DefinedLow)
Hence, the highest and lowest functions can still be used, providing reasonable performance. If the period you are calculating on is small (like a Tenkan) then I would rather use the solution on the commented lines.
For averages, it is similar, but we cannot offset the values to 0 due to the weights.
The code above does not work as expected.
There is a huge side effect on the functions Lowest and Highest.
The functions Lowest and Highest continue skipping undefined bars even when the calculation is done on figures that are always defined.
I then tried using iteration..
aHigh = High
aLow = Low

for i = 1 to (9 * TF) - 1
if High[i] > aHigh then
  aHigh = High[i]
endif
if Low[i] < aLow then
  alow = Low[i]
endif
next

Tenkan = (aHigh + aLow) / 2
return Tenkan as "Tenkan", aHigh as "High" , aLow as "Low"
The result is not as expect. It seems that the operator brackets [] is responsible for this side effect, meaning that when you access A[50], you’re really going to get A[54] if there are 4 undefined bars even if A if always defined…
Am I wrong? Seems that we’re looked in with this side effect. No possible workaround for me on this plateform.
As to concluded with, we really automation “by (x) ticks” to work in ProOrder…. Hey! Aren’t we looping here!
Chears!