I developed / expanded on Roberto code from link below.
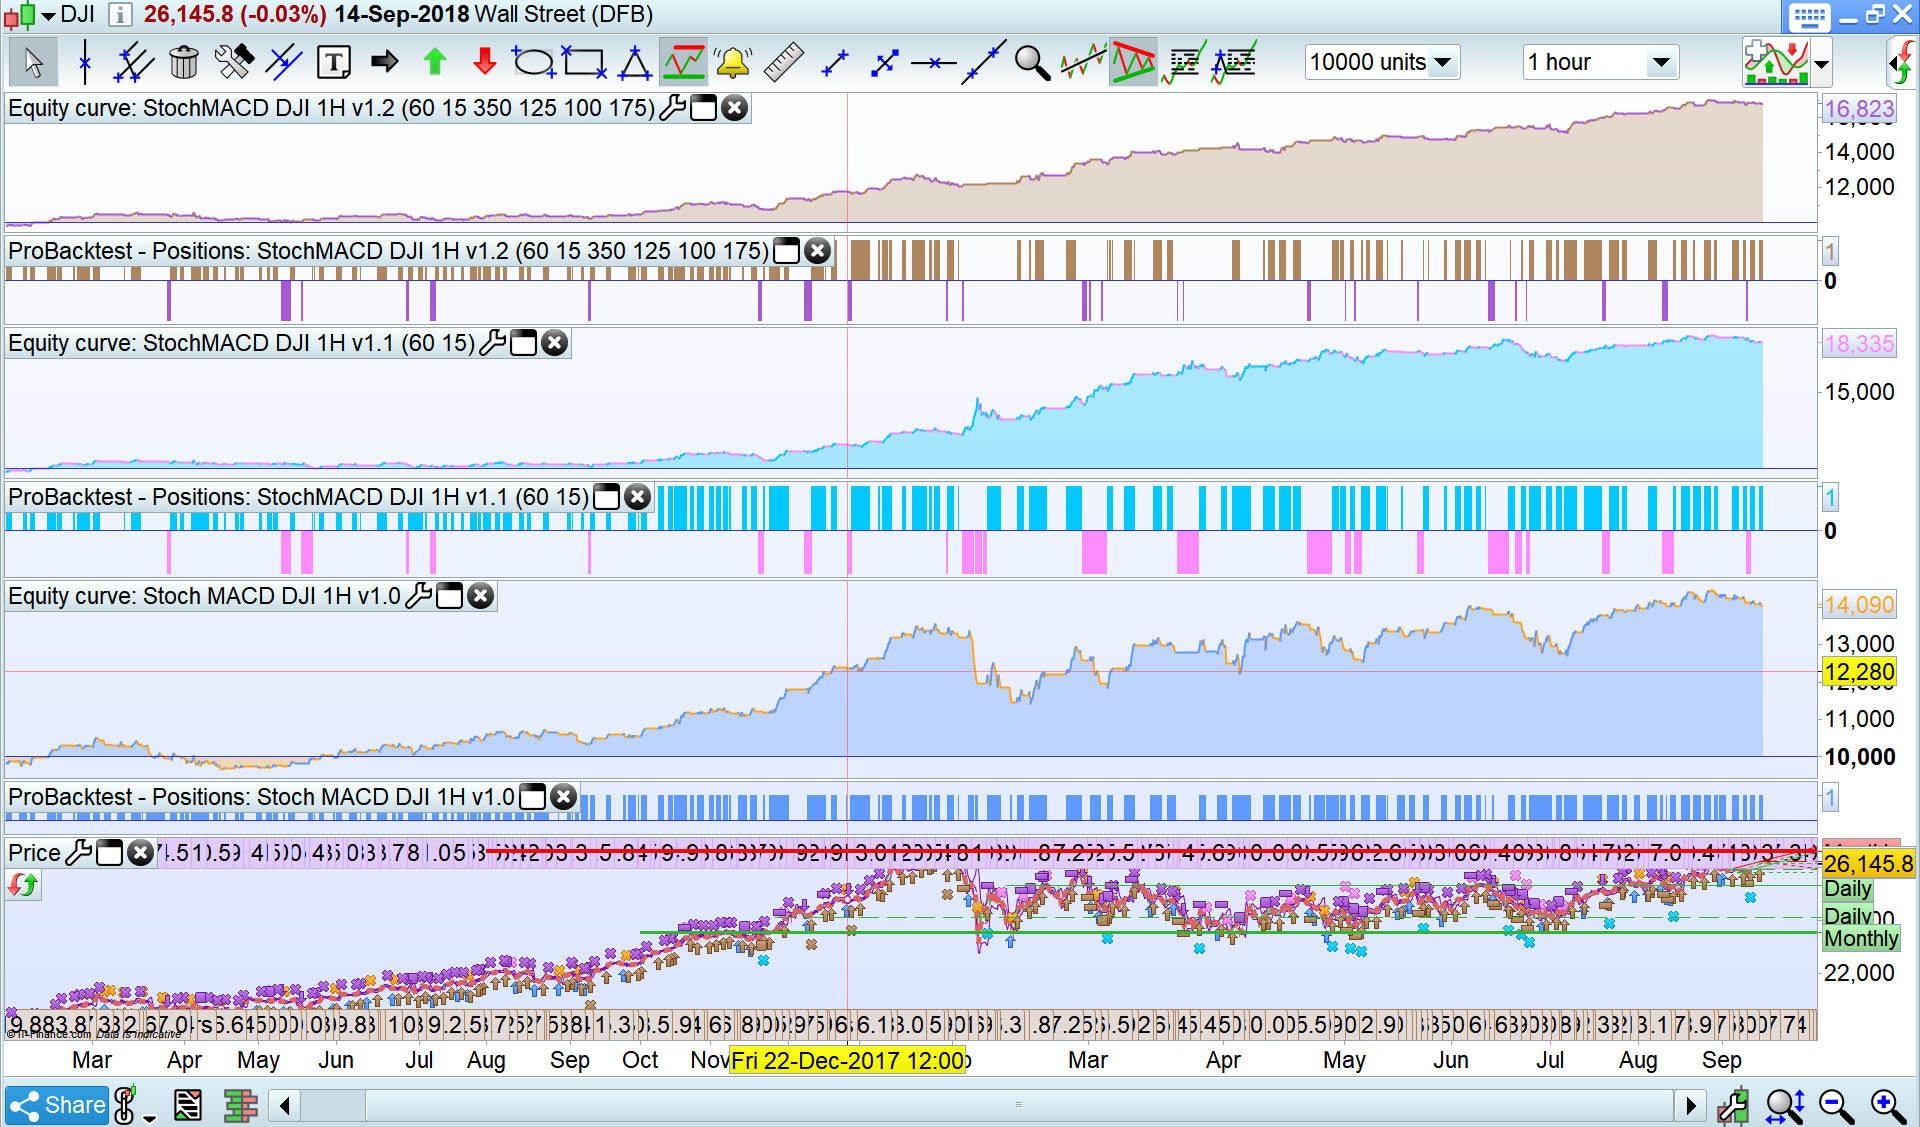
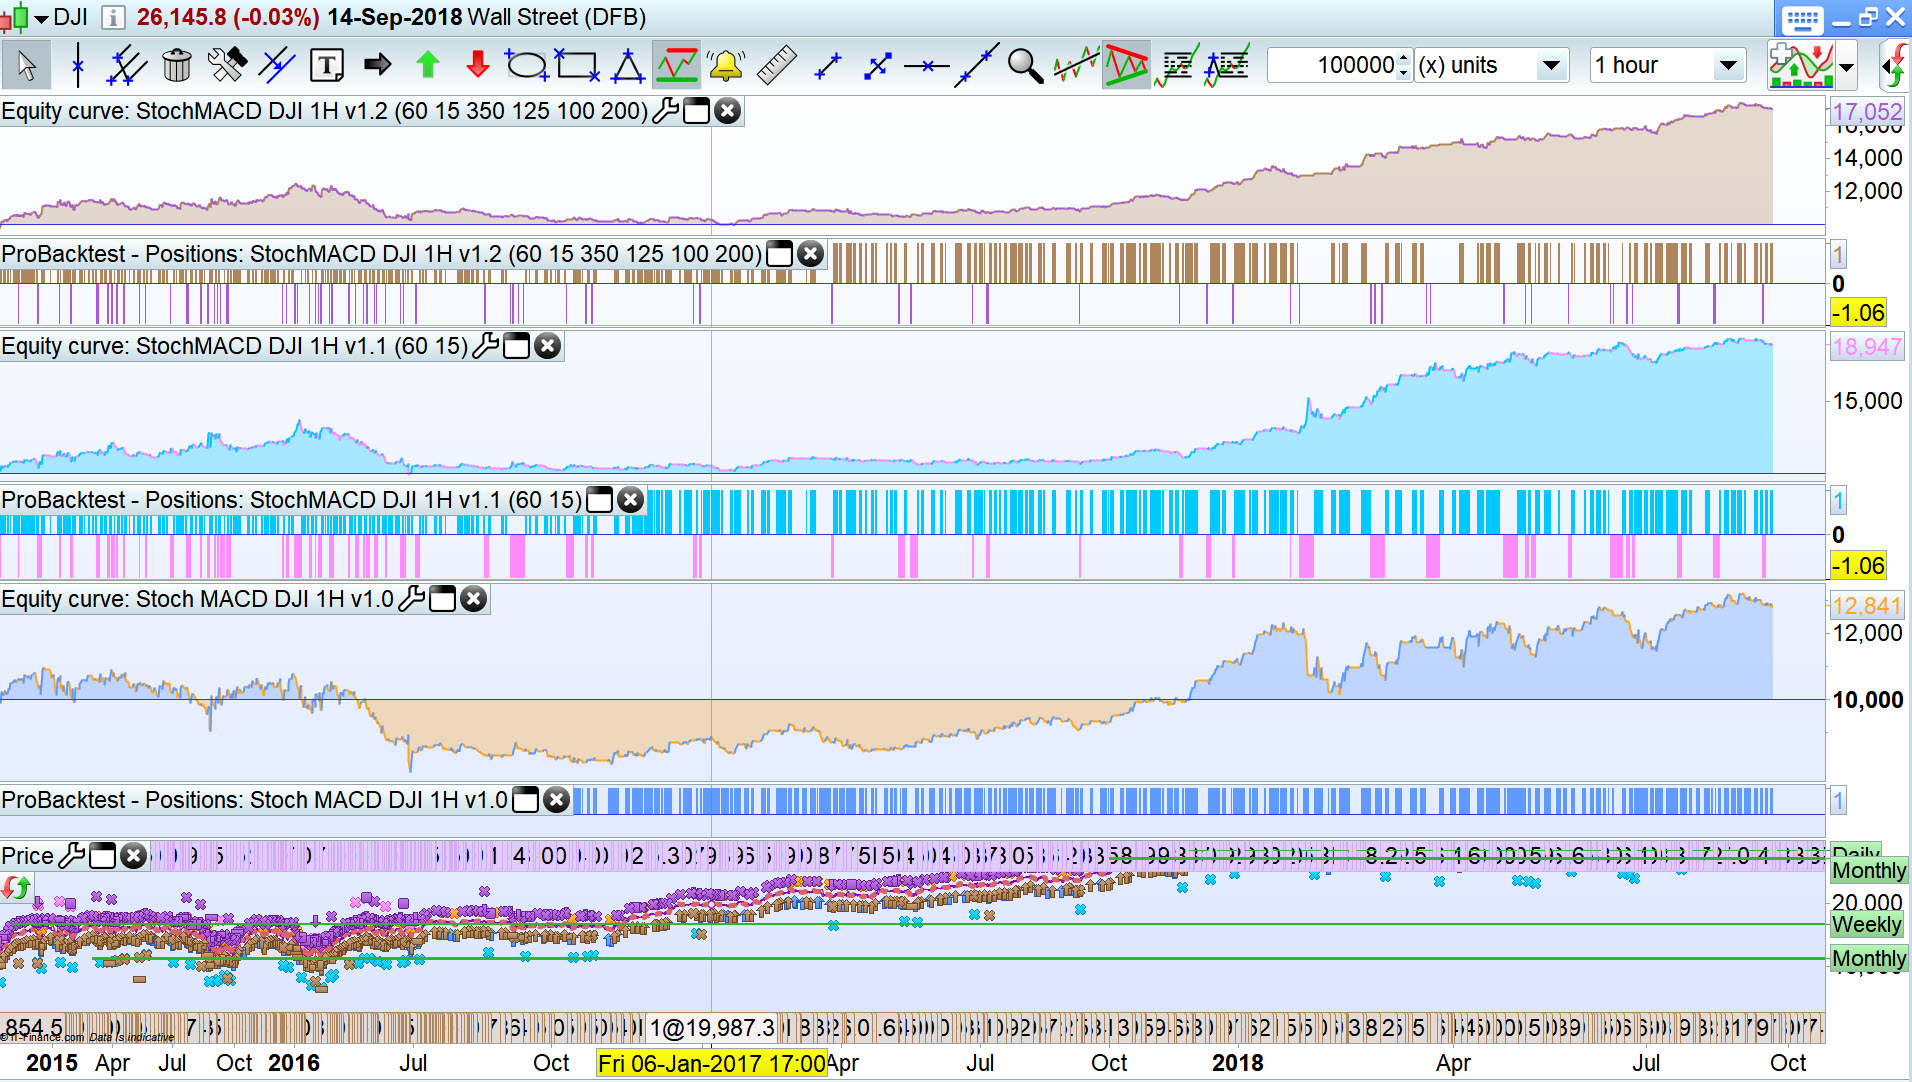
Which Equity Curve / Performance (v1.o, v1.1 or v 1.2) would you set going on Live and why … easy / friendly bit of weekend discussion? 🙂
https://www.prorealcode.com/topic/macd-stochastic-code/#post-76115
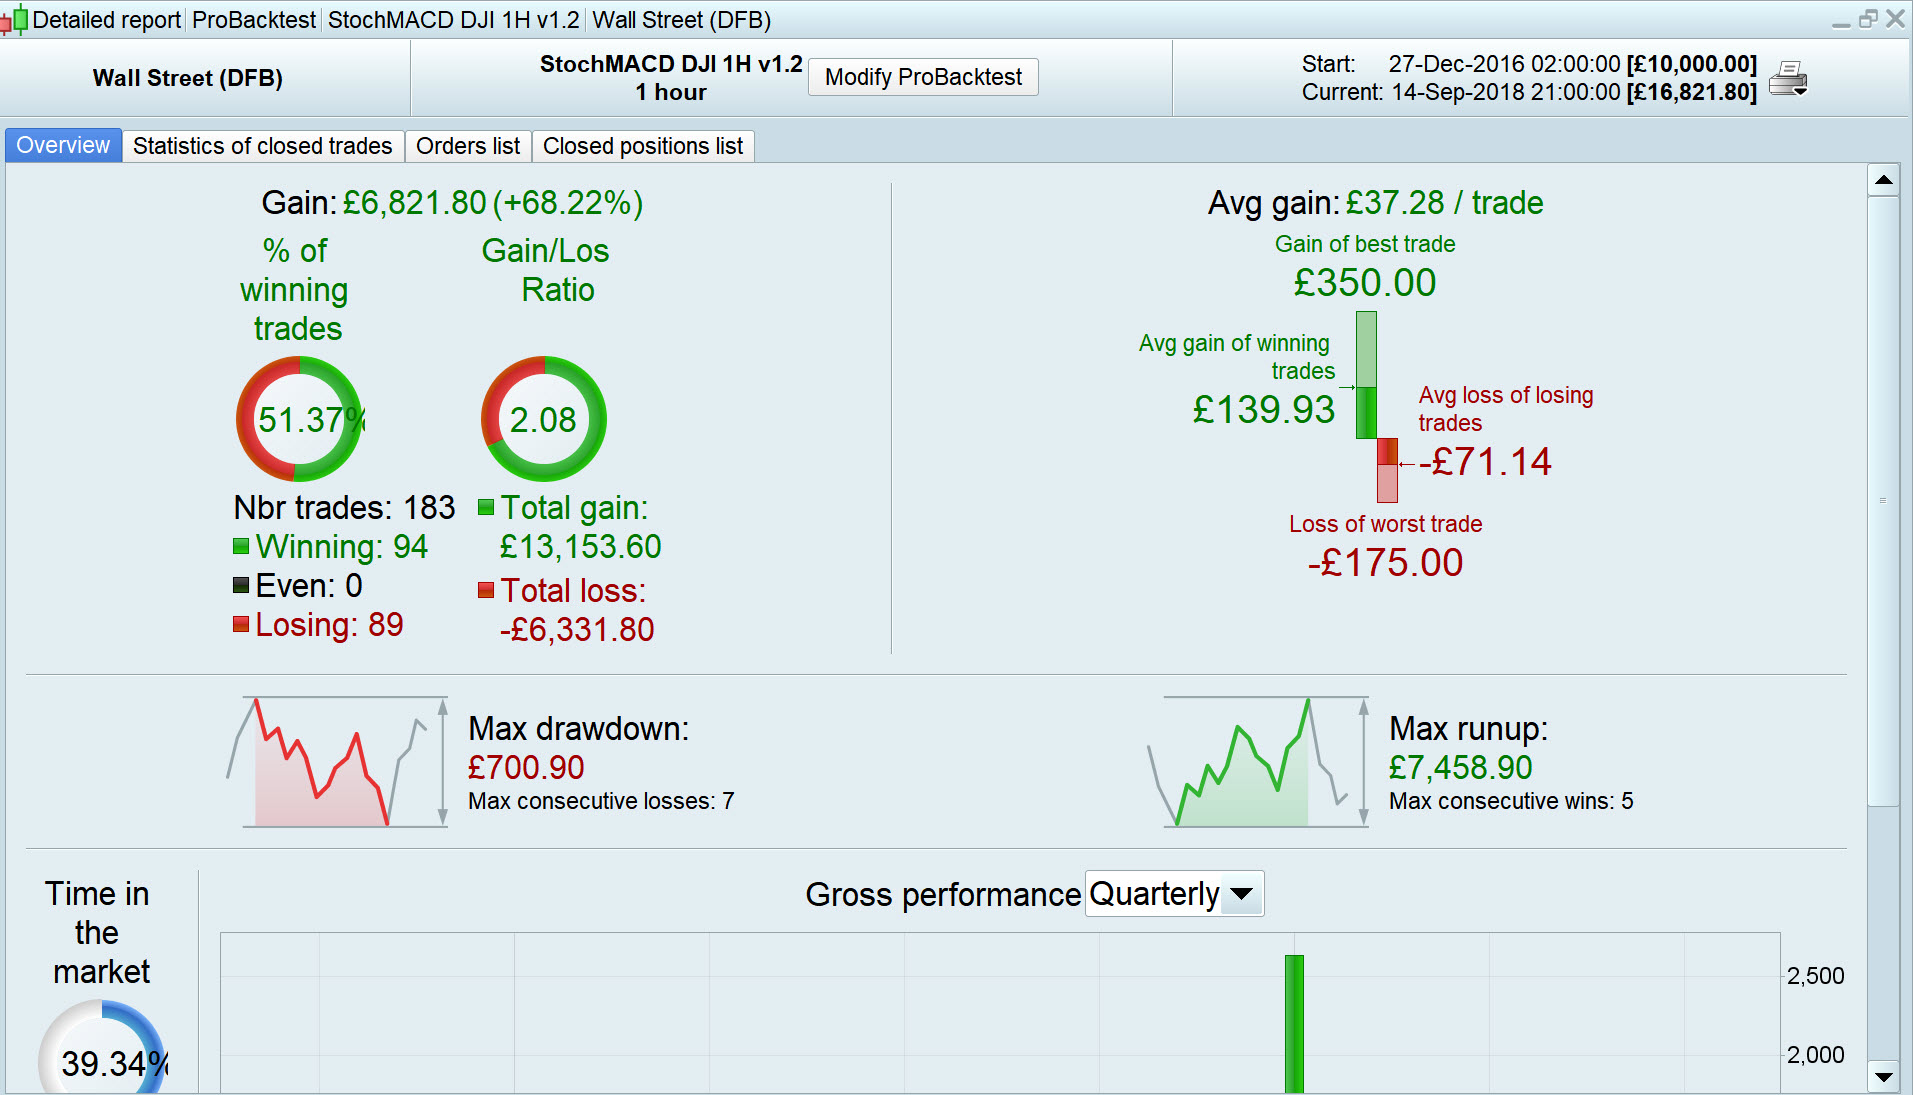
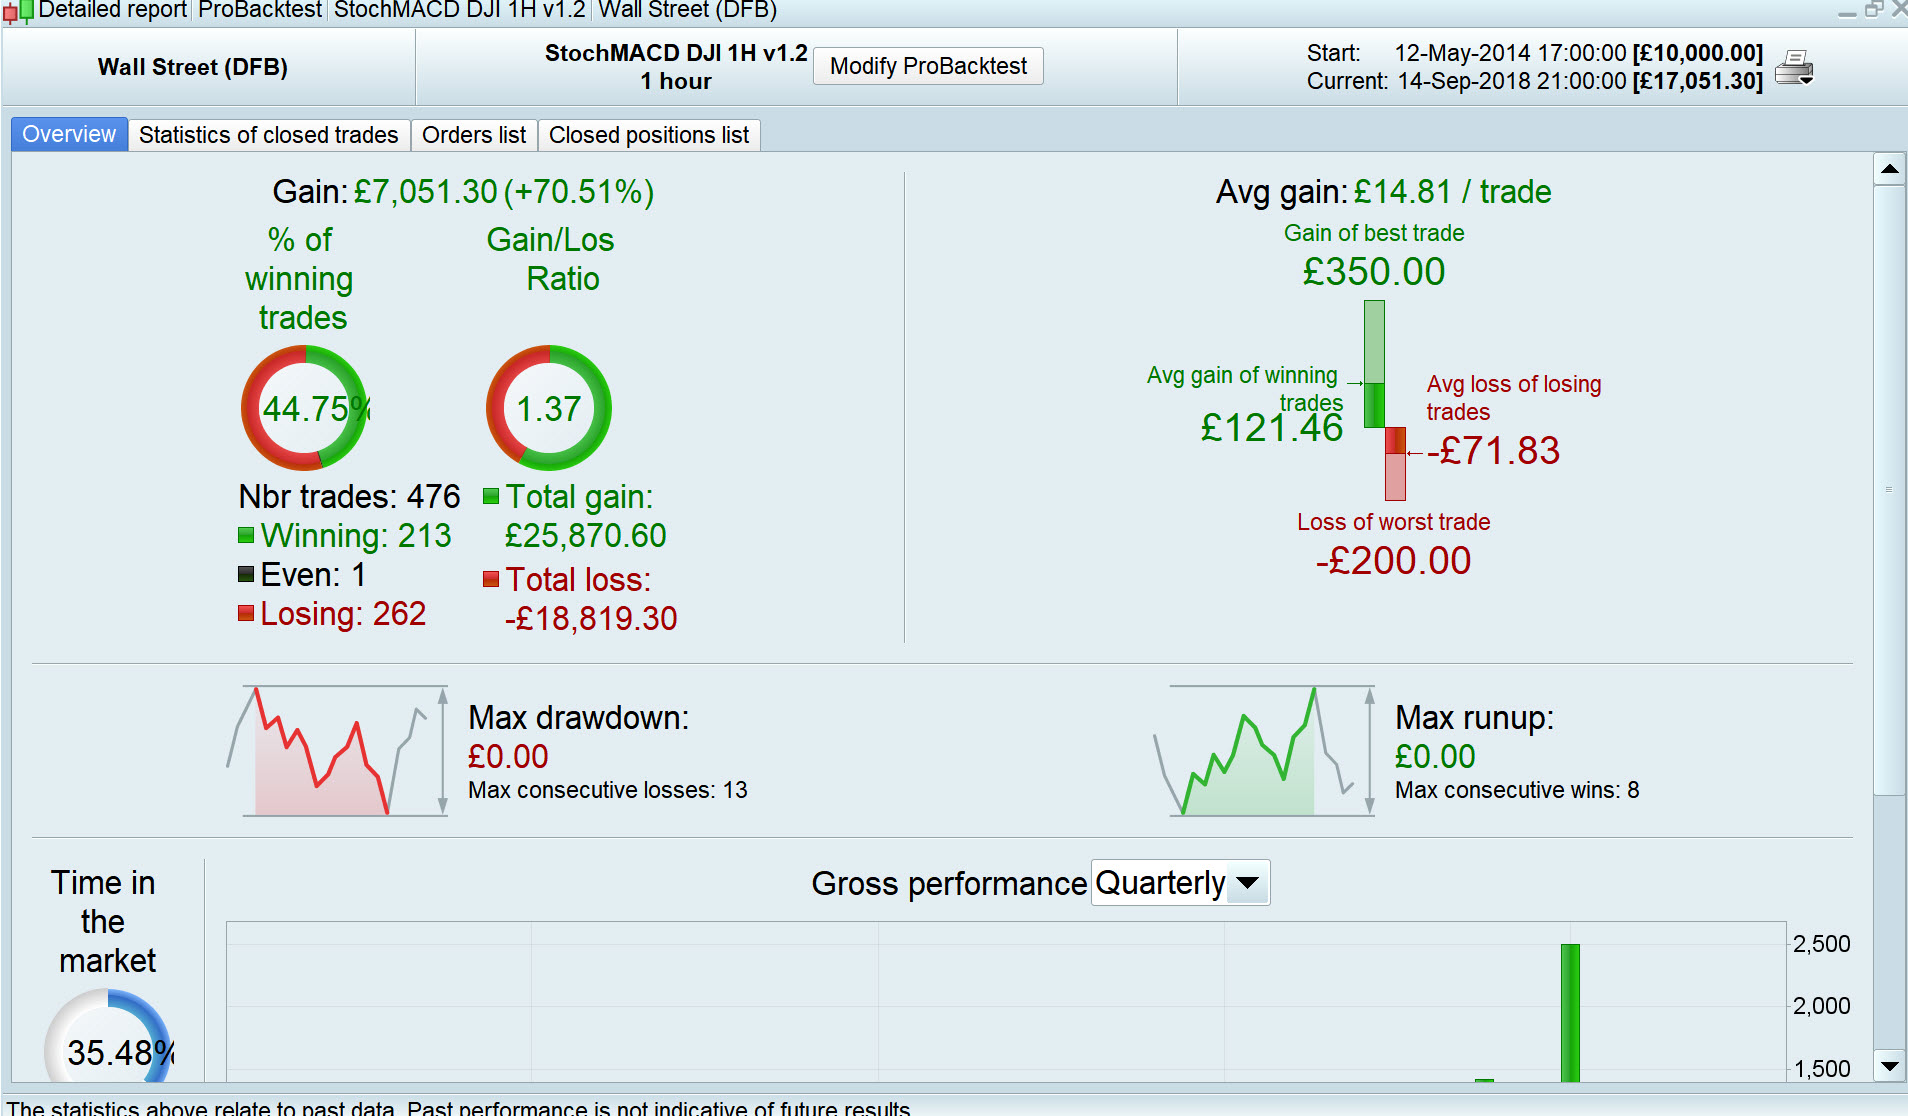
I’d go for version 1.2, since it has the lowest drawdown still having a fairly good gain.
What scares me a bit is that the max consecutive number of losses outperforms max consecutive wins in ALL cases!
Did you demo it for some time?
Did you demo it for some time?
No I just knocked them up while eating my breakfast this morning! 🙂 I’ll work on them more.
If anybody wants the code as a basis for further development together then just shout up … I enjoy a bit of collaboration and light-hearted discussion! 🙂
I think we would need the code for all three to compare what you have added/taken away to smooth out the equity curves and increase the returns. Often the best results are the most curve fitted.
Thanks Guys, sorry for delay … been on my daughter’s house extension since this morning!
Below are the results over 100k bars with spread = 4 (spread = 4 was also used on the 10k screen shots above.
I will post the code and the .itf in a separate post (with opto settings) for each version.
This will be child’s play for you two guys to improve the results!? 🙂
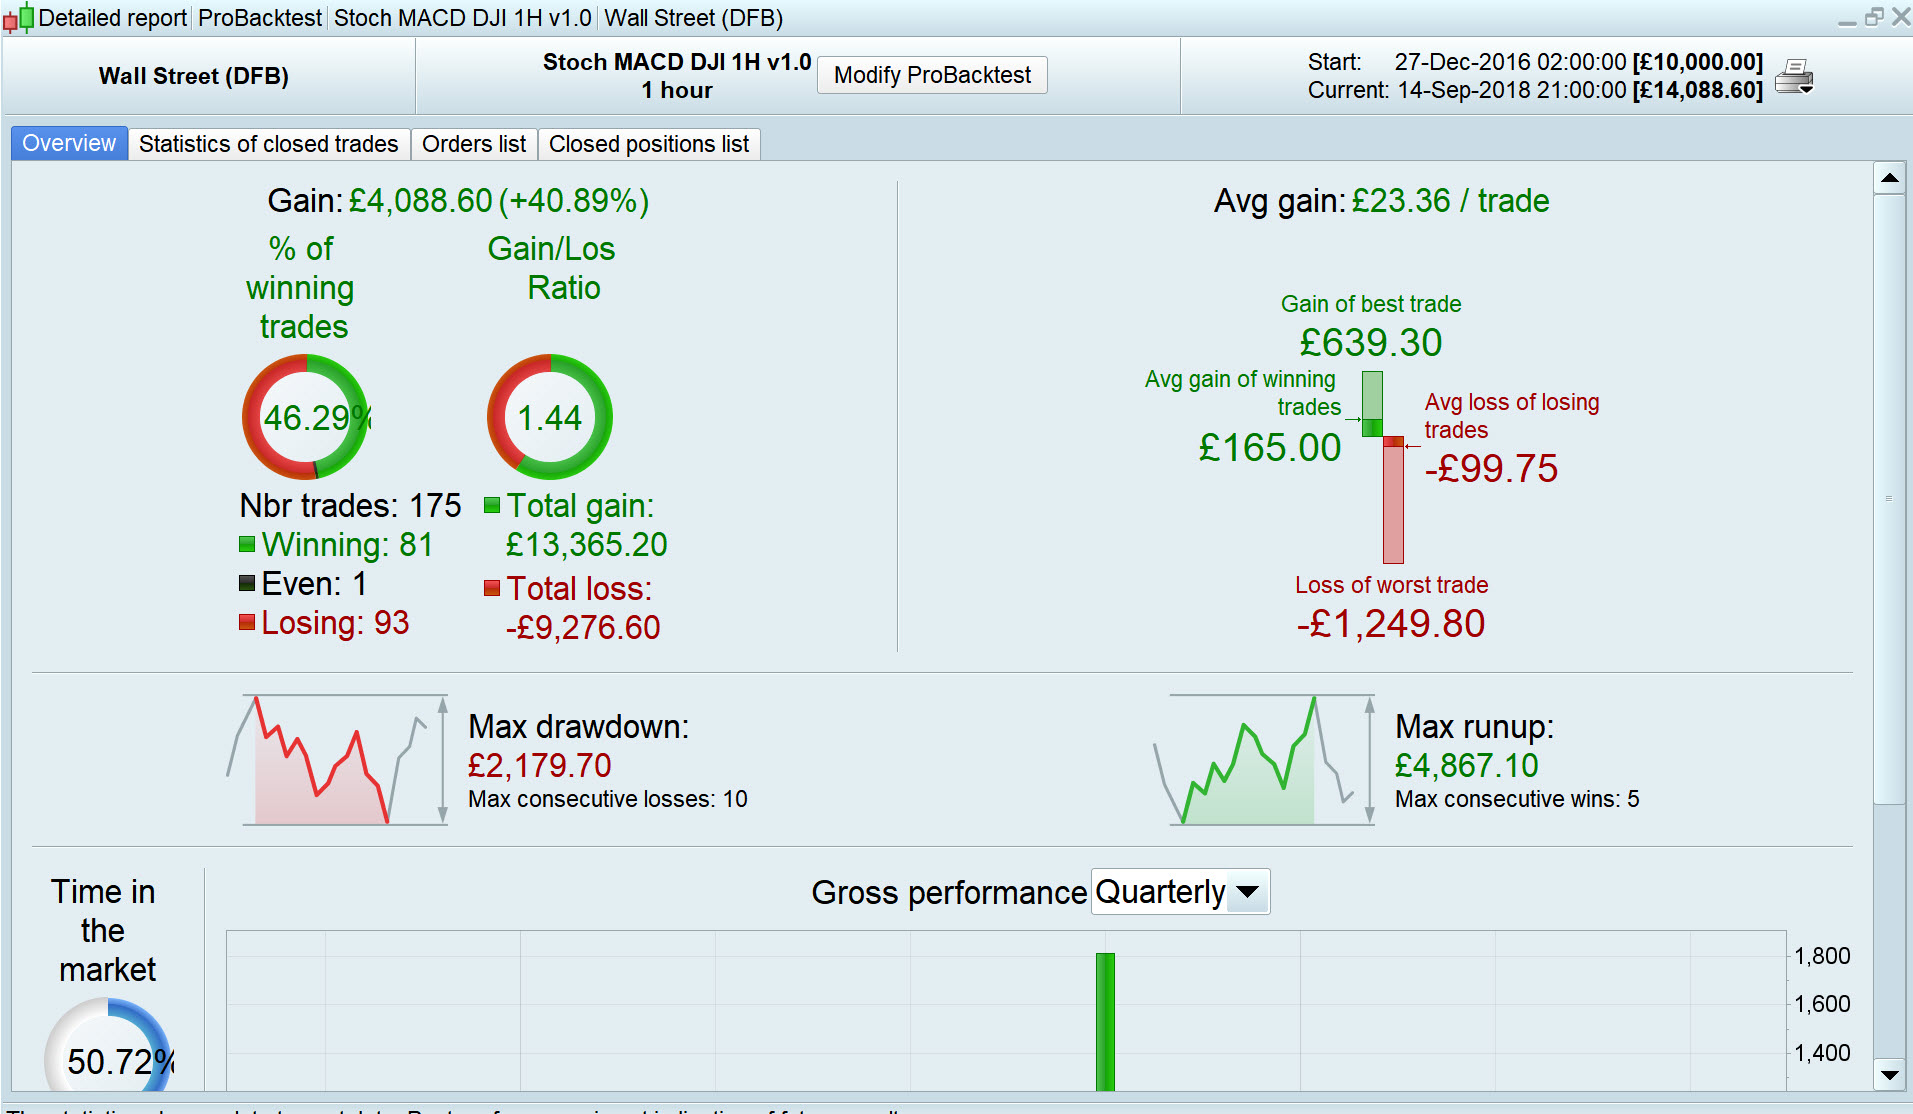
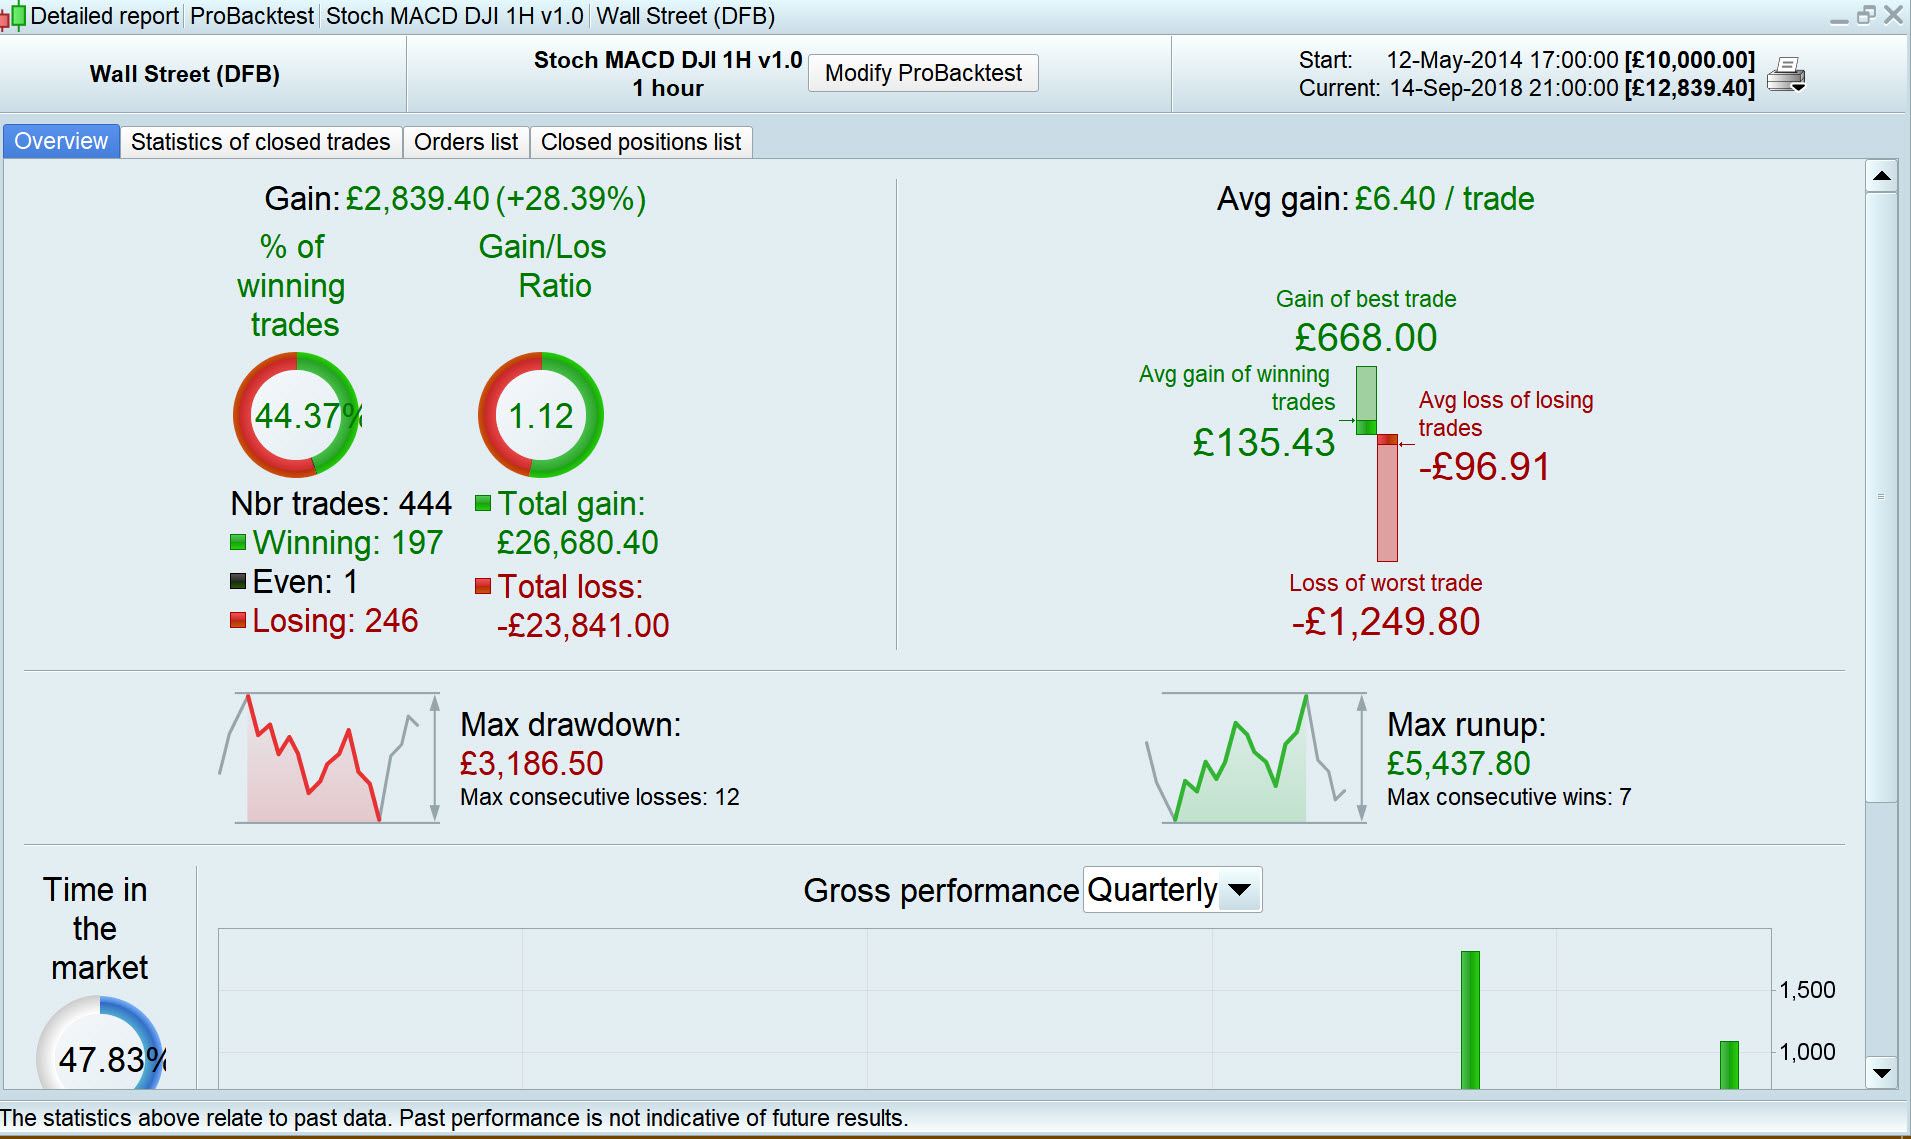
Version 1.0
DEFPARAM CUMULATEORDERS = False

stocK      = Stochastic[14,3](close)
StocD      = Average[5](StocK)
MacdVal    = Macd[12,26,9](close)
Up1         = StocK CROSSES OVER StocD
Up2         = MacdVal > 0
Dn1         = StocK CROSSES UNDER StocD
Dn2         = MacdVal < 0

IF Up1 and Up2 THEN
Buy 1 contract at market
EndIf

If Dn1 and Dn2 Then
Sell at Market
Endif
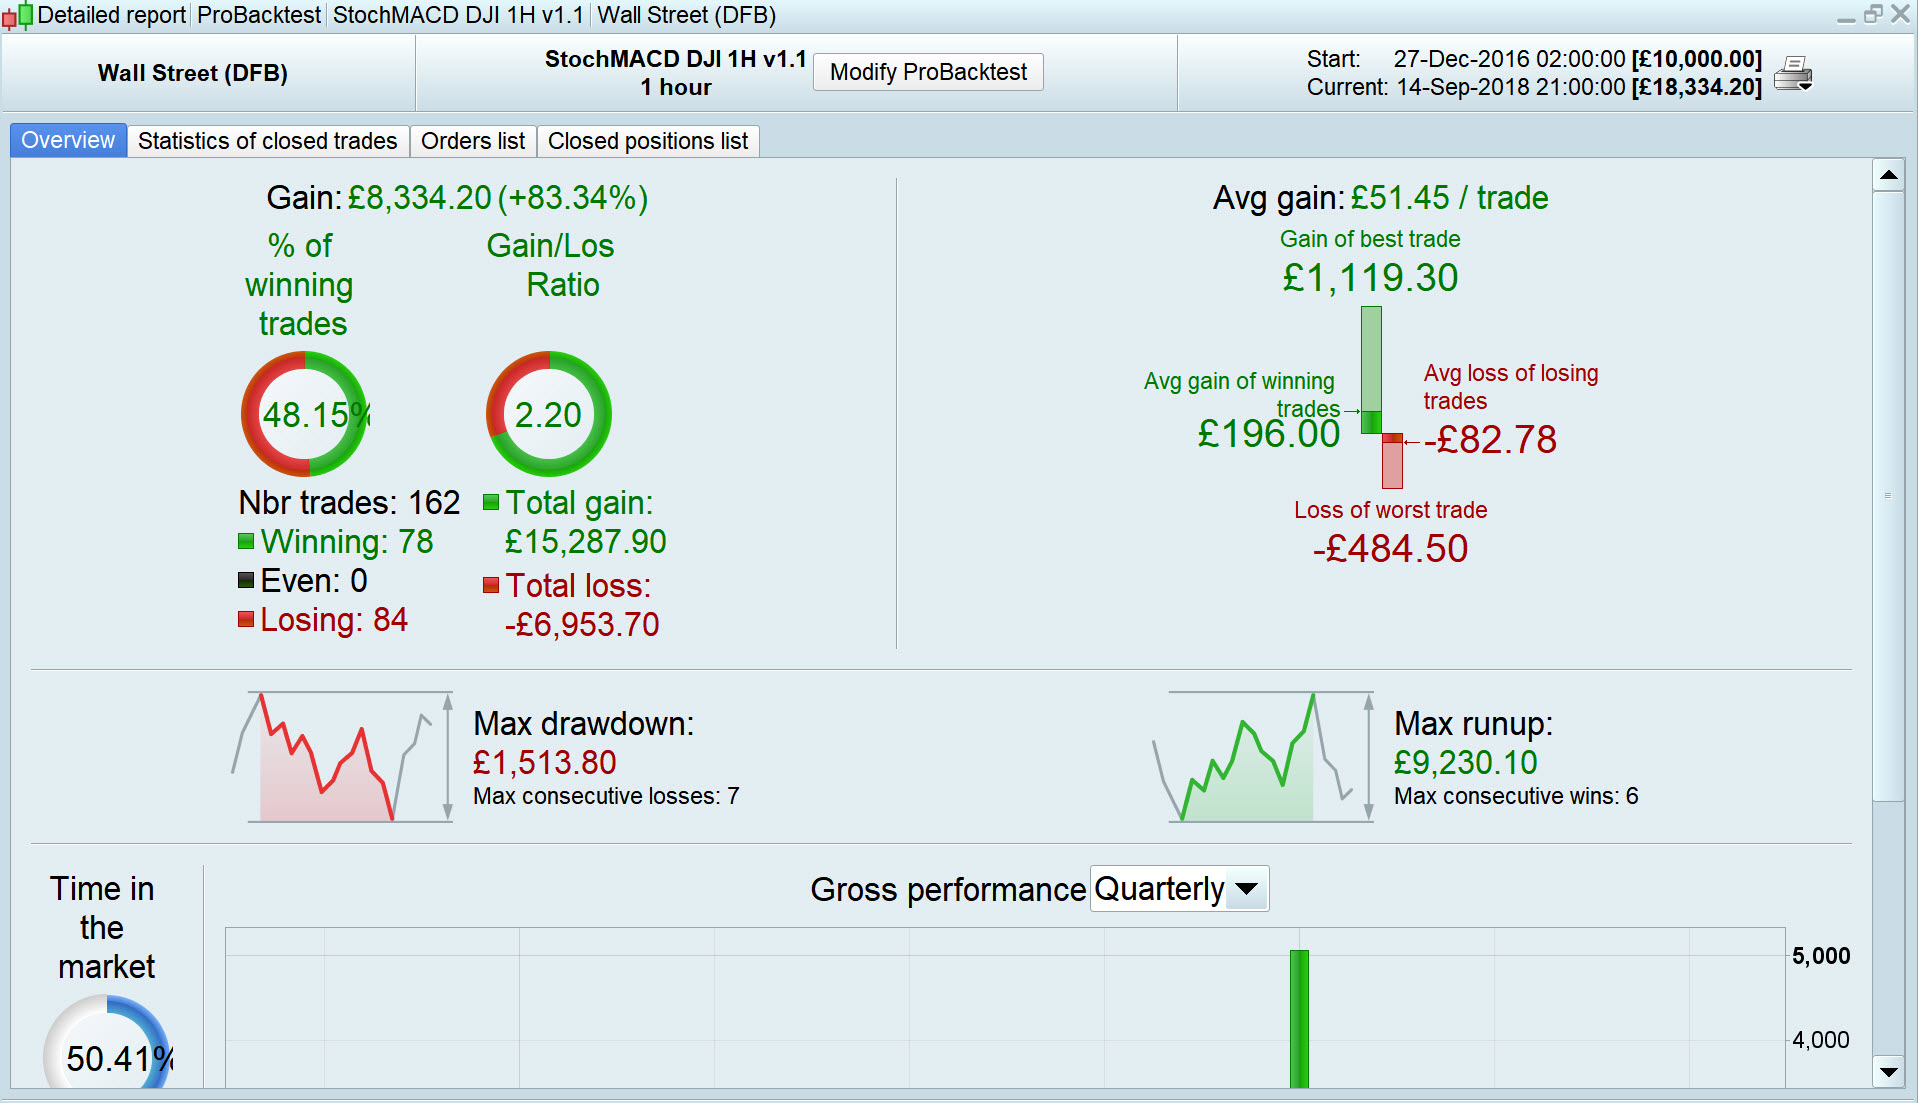
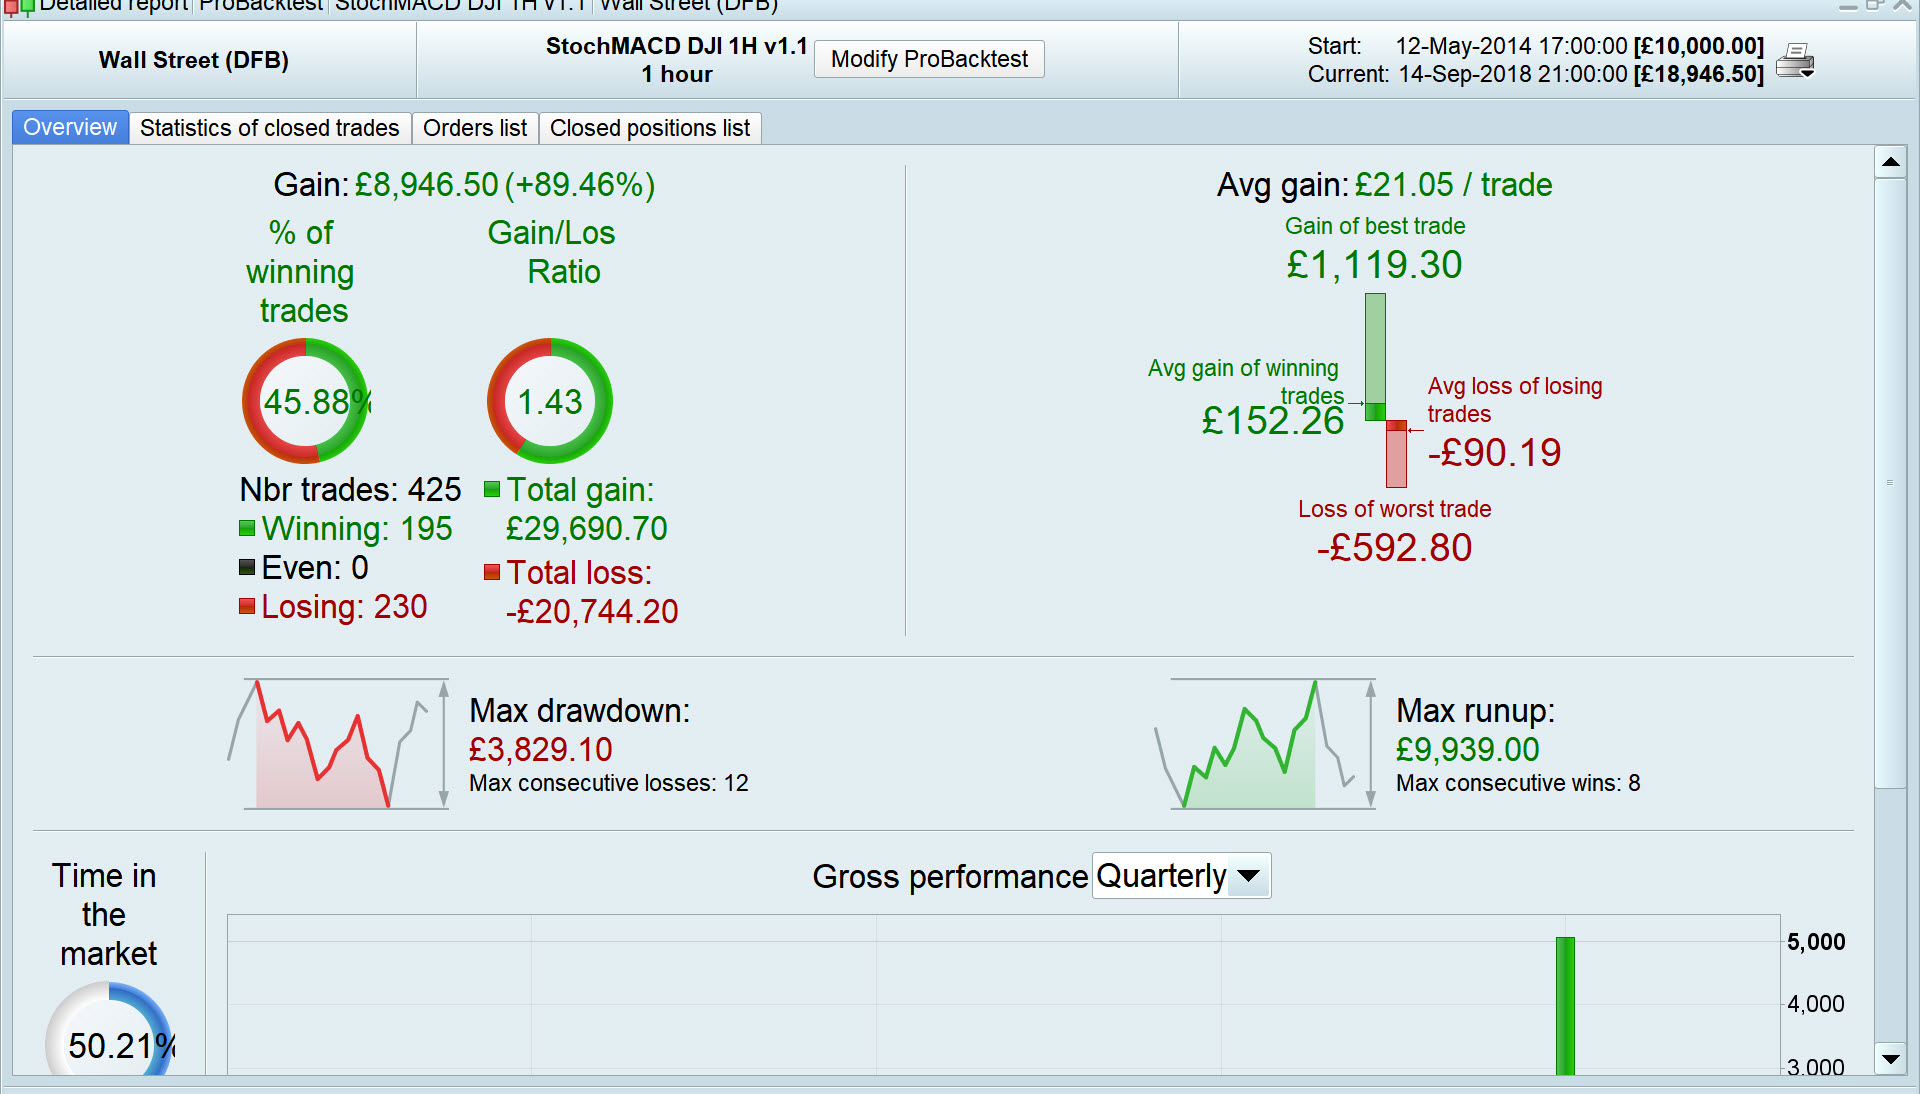
Version 1.1
DEFPARAM CUMULATEORDERS = False

stocK      = Stochastic[14,3](close)
StocD      = Average[5](StocK)
MacdVal    = Macd[12,26,9](close)
Up1         = StocK CROSSES OVER StocD
Up2         = MacdVal > 0
Up3         = stocK > A8

Dn1         = StocK CROSSES UNDER StocD
Dn2         = MacdVal < 0
Dn3         = stocK < A12

//GO LONG
IF Up1 and Up2 and Up3 THEN
Buy 1 contract at market
EndIf

//EXIT LONG
If Dn1 and Dn2 Then
Sell at Market
Endif

//Go SHORT
If Dn1 and Dn2 and Dn3 Then
SellShort at market
Endif

//EXIT SHORT
//If Up3 Then
//ExitShort at market
//Endif

//If Longonmarket Then
//SET TARGET PPROFIT   A35
//SET STOP PLOSS       A36
//Endif
//
//If Shortonmarket Then
//SET TARGET PPROFIT  A40
//SET STOP PLOSS      A41
//Endif
Version 1.2
(I’ve got one eye on the TV so if I upload a ‘mistake’ then please let me know).
DEFPARAM CUMULATEORDERS = False

stocK      = Stochastic[14,3](close)
StocD      = Average[5](StocK)
MacdVal    = Macd[12,26,9](close)
Up1         = StocK CROSSES OVER StocD
Up2         = MacdVal > 0
Up3         = stocK > A8

Dn1         = StocK CROSSES UNDER StocD
Dn2         = MacdVal < 0
Dn3         = stocK < A12

//GO LONG
IF Up1 and Up2 and Up3 THEN
Buy 1 contract at market
EndIf

//EXIT LONG
If Dn1 and Dn2 Then
Sell at Market
Endif

//Go SHORT
If Dn1 and Dn2 and Dn3 Then
SellShort at market
Endif

//EXIT SHORT
//If Up3 Then
//ExitShort at market
//Endif

If Longonmarket Then
SET TARGET PPROFIT   A35
SET STOP PLOSS       A36
Endif

If Shortonmarket Then
SET TARGET PPROFIT  A40
SET STOP PLOSS      A41
Endif
In version 1.2 your target and stoploss levels will not be set until you have been on the market for one bar. Better to place them at the same time as you place the buy and sellshort orders.
For what my opinion is worth…. when I see optimized stop loss and take profit levels my brain screams ‘curve fit’ so v1.2 is the worst for me.
v1.2 and v1.1 both short on the DJI which I would never do as the strategy would be swimming against the tide. Shorting would be OK if we had identified that we were in a major recession – the news is the best indicator of this!
The addition of optimized levels for Up3 and Dn3 conditions adds one more level of curve fitting but as the equity curve on v1.0 is so poor we need something to improve the strategy!
Have you tried the v1.0 with just the Up3 condition added and optimized?
Maybe using MTF in a slower time frame to identify good days to enter might be an improvement by testing whether it is a strategy that is better when buying in dips or when buying in trends.
Re suggestions made on this Thread … if anybody wants to code them up into a System then feel free.
Please then increment the version number and post on here …
- Old and new version Equity Curve.
- Old and new Performance stats.
- New version code.
Thank You
GraHal
Use stochastic to buy the dip and sell the top is the best idea, but what happen when the indicator desync from price is a common problem 😐 Dynamic/adaptive period calculation could be something interesting to test here. There are many different ways to adapt period, one example for stochastic: John Ehlers Adaptive Stochastic