this would be nice for the dax. Because of the Margin. It´s the half of Dow. Anyone tried?
Mmm thought it was a bit too good to be true! Just a bit though! 🙂
I have done a pessimistic calculation / check of results and £300 – £400 of profit is due to the spike we have had to endure at 21:15 on the Dow for the last 5 nights or so.
4 trades have been affected at 21:15, 1 lost around 350 due to the spike and 3 gained 200 due to the spike!
The 4 spiked tradess may have gone on to be gainers anyway if the spike hadn’t triggered the SL and TP. I guess I could work this out, but the coffee hasn’t worked through yet! 🙂
Results are still good though as v1.0 is currently trading at a genuine around £600 profit over 6 days (950 – 350 due to IG spikes! ).
I will put a time filter on the strategy when I get chance.
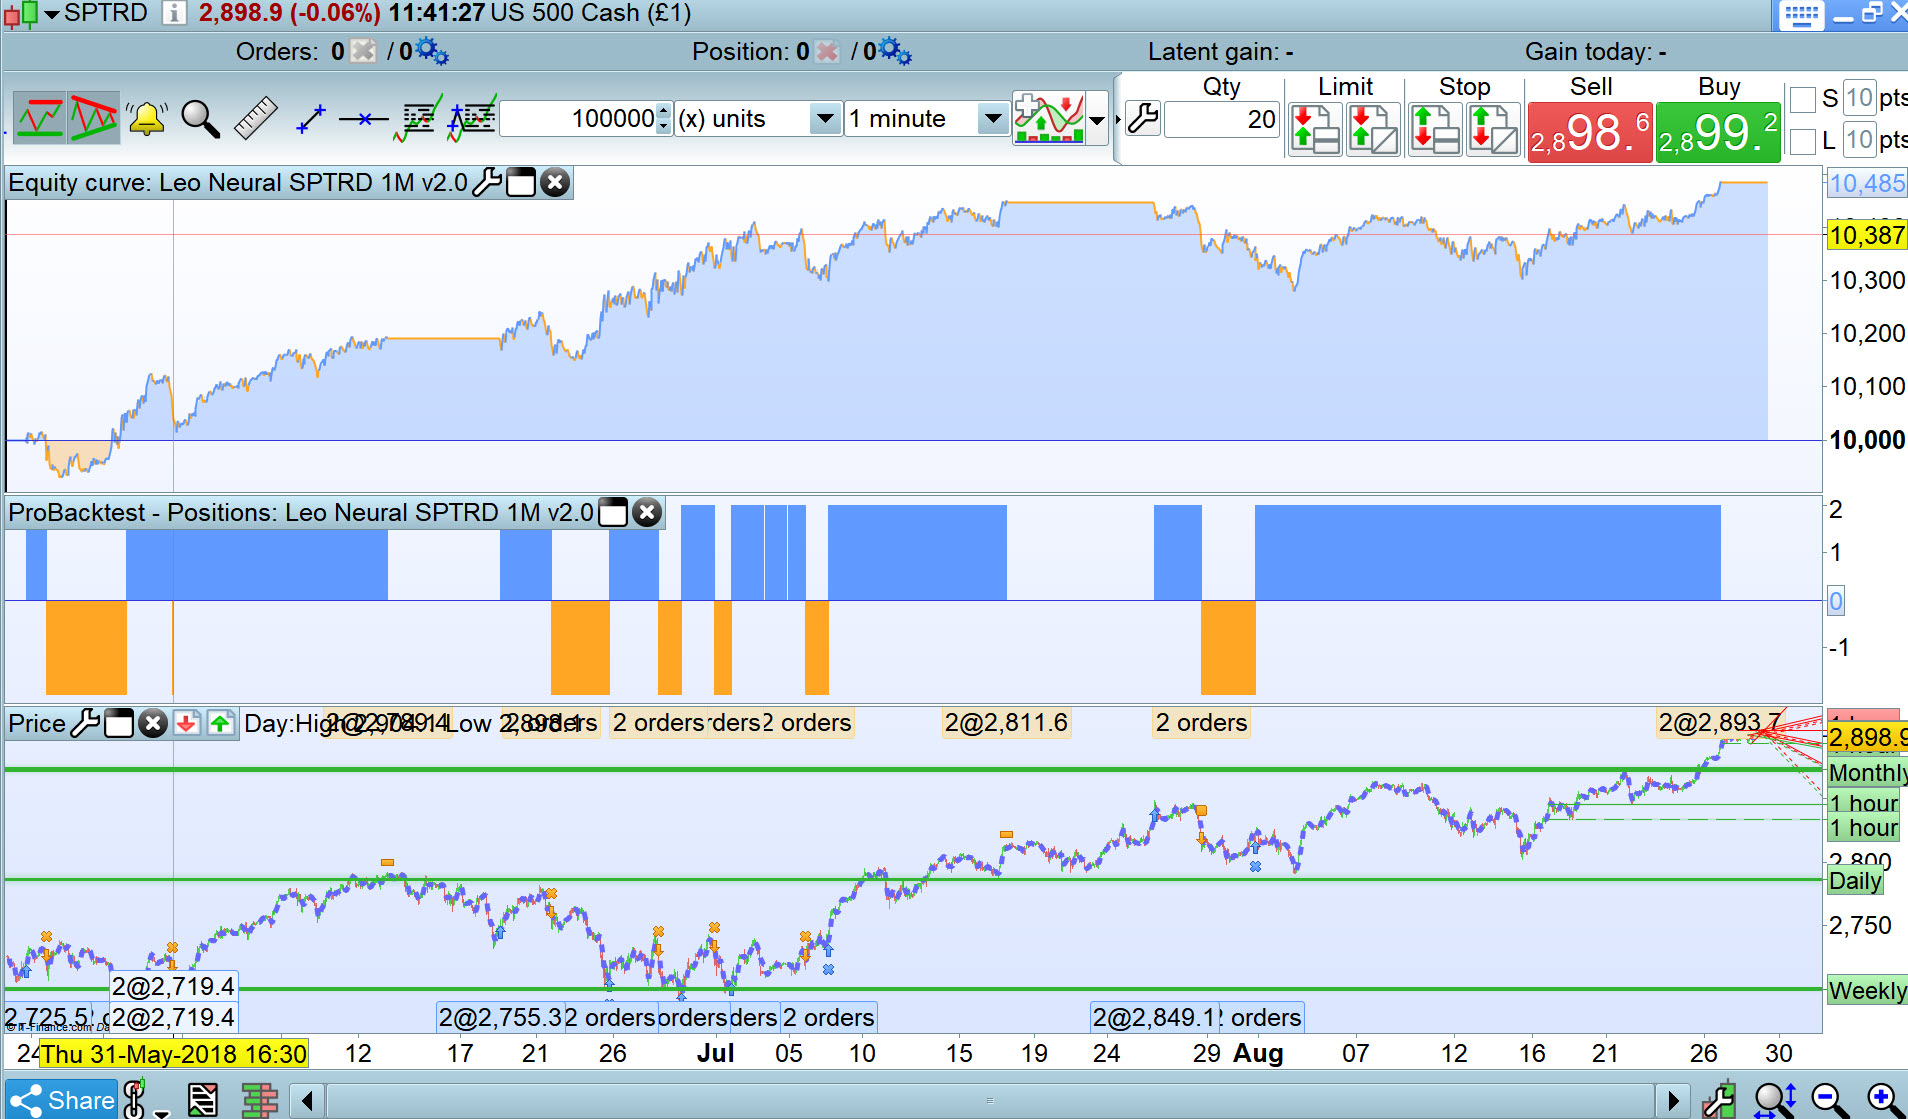
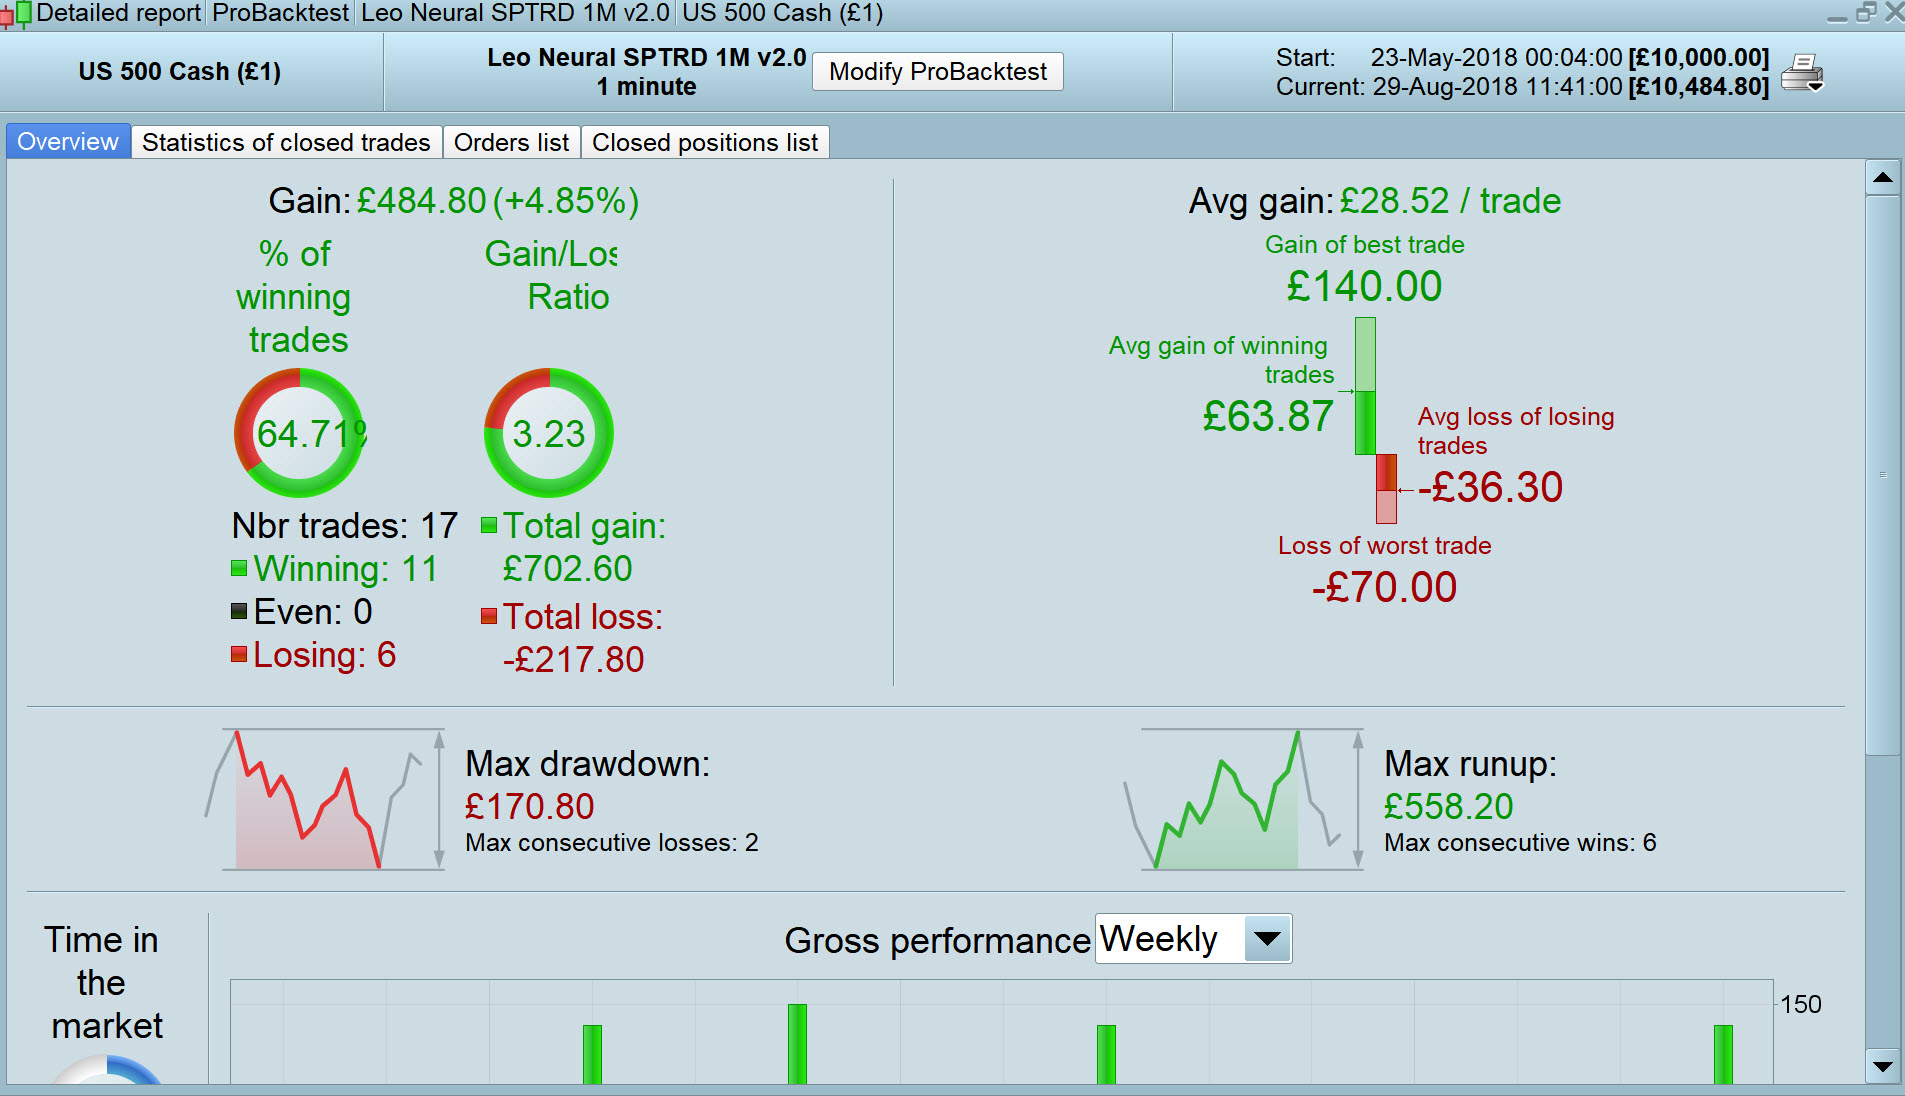
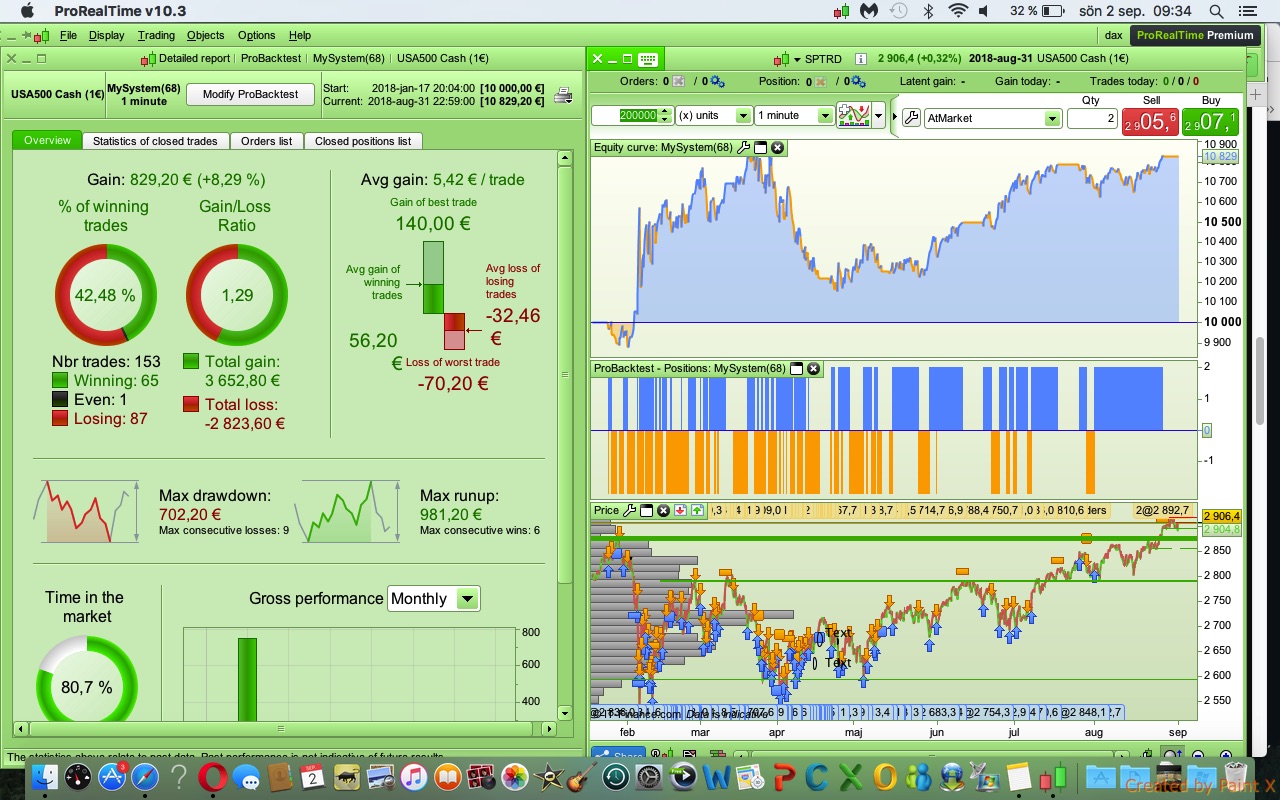
Vonasi proposed so here it is … SPTRD on 1 Min TF 100k bars, spread = 4
DEFPARAM CUMULATEORDERS = False
//Variables:
candlesback=5
ProfitRiskRatio=2
spread=1.5


myATR=average[20](range)+std[20](range)
ExtraStopLoss=MyATR
//ExtraStopLoss=3*spread*pipsize

//for long trades
classifierlong=0
FOR scanL=1 to candlesback DO
IF classifierlong[scanL]=1 then
BREAK
ENDIF
LongTradeLength=ProfitRiskRatio*(close[scanL]-(low[scanL]-ExtraStopLoss[scanL]))
IF close[scanL]+LongTradeLength < high-spread*pipsize then
IF lowest[scanL+1](low) > low[scanL]-ExtraStopLoss[scanL]+spread*pipsize then
classifierlong=1
//candleentrylong=barindex-scanL
BREAK
ENDIF
ENDIF
NEXT
IF classifierlong=1 and Close > Average[120](close)then
//DRAWSEGMENT(candleentrylong,close[barindex-candleentrylong],barindex,close[barindex-candleentrylong]+LongTradeLength) COLOURED(0,150,0)
//DRAWELLIPSE(candleentrylong-1,low[barindex-candleentrylong]-ExtraStopLoss,barindex+1,high+ExtraStopLoss) COLOURED(0,150,0)
Buy 2 Contract at Market
ENDIF

//for short trades
classifiershort=0
FOR scanS=1 to candlesback DO
IF classifiershort[scanS]=1 then
BREAK
ENDIF
ShortTradeLength=ProfitRiskRatio*((high[scanS]-close[scanS])+ExtraStopLoss[scanS])
IF close[scanS]-ShortTradeLength > low+spread*pipsize then
IF highest[scanS+1](high) < high[scanS]+ExtraStopLoss[scanS]-spread*pipsize then
classifiershort=1
//candleentryshort=barindex-scanS
BREAK
ENDIF
ENDIF
NEXT

IF classifiershort=1 and Close < Average[120](close) then
//DRAWSEGMENT(candleentryshort,close[barindex-candleentryshort],barindex,close[barindex-candleentryshort]-ShortTradeLength) COLOURED(150,0,0)
//DRAWELLIPSE(candleentryshort-1,high[barindex-candleentryshort]+ExtraStopLoss,barindex+1,low-ExtraStopLoss) COLOURED(150,0,0)
SellShort 2 Contract at Market
ENDIF

SET TARGET PROFIT 70
SET STOP PLOSS 35
Vonasi proposed so here it is … SPTRD on 1 Min TF 100k bars, spread = 4
Why 4 pips? The SP500 spread is never that big.
Hey Everyone!!
Such a nice work!! Amazing results from the beginning, Congrats guys!!!
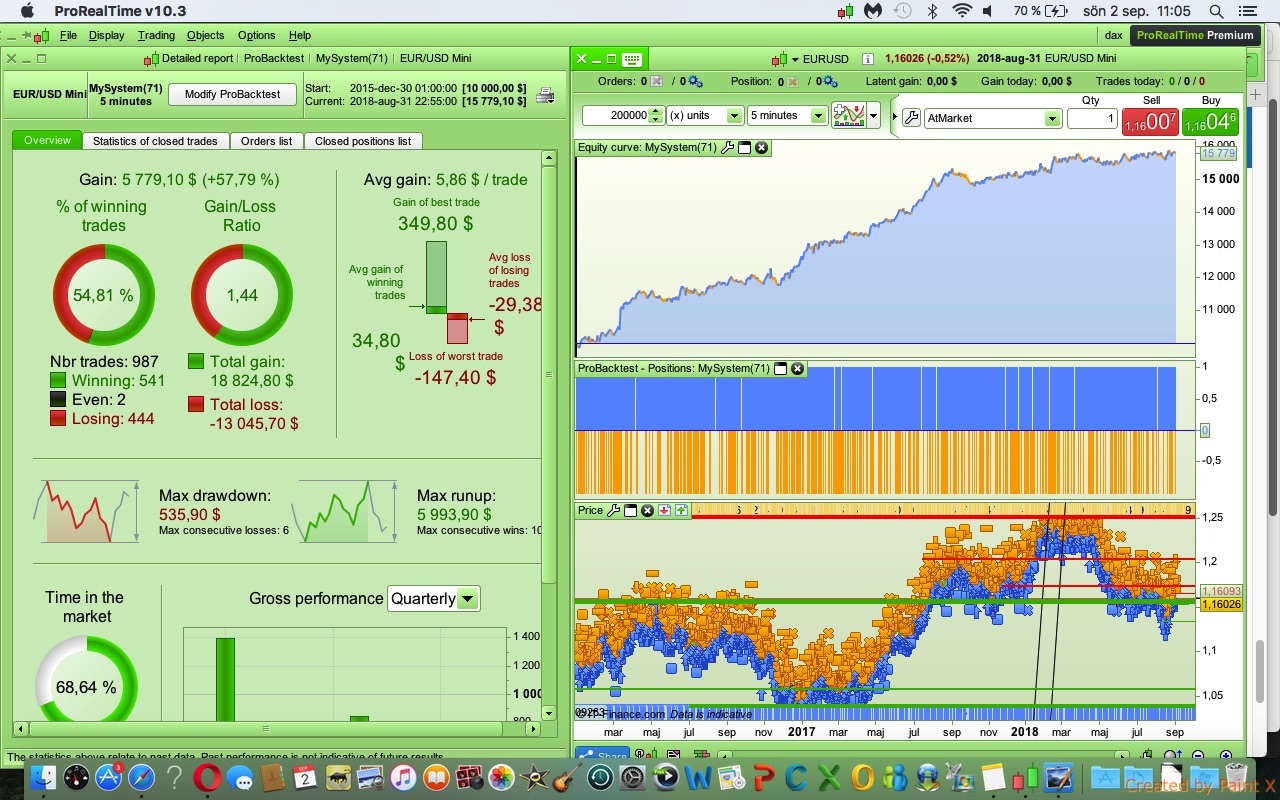
I would like my little idea to improve the results. Months ago I added an indicator to the library. I think this indicator can prevent fake entries, basiclly I added two more conditions to the original code:
AverageVolumeBuy > AverageVolumeSell and AverageVolumeBuy > 50
It is only a little bit improve, and please guys please to share your opinion. I hope you like.
Saludos!!
Why 4 pips? The SP500 spread is never that big.
I forgot, I forgot okay!? We all make mistakes!? 🙂
Also Lot size = 2 on my results above.
S&P500 is min Lot size 5, so more mistakes on my part! 🙁
I hope you like.
Yeah looks good, thanks! The more the merrier! 🙂
GraHal
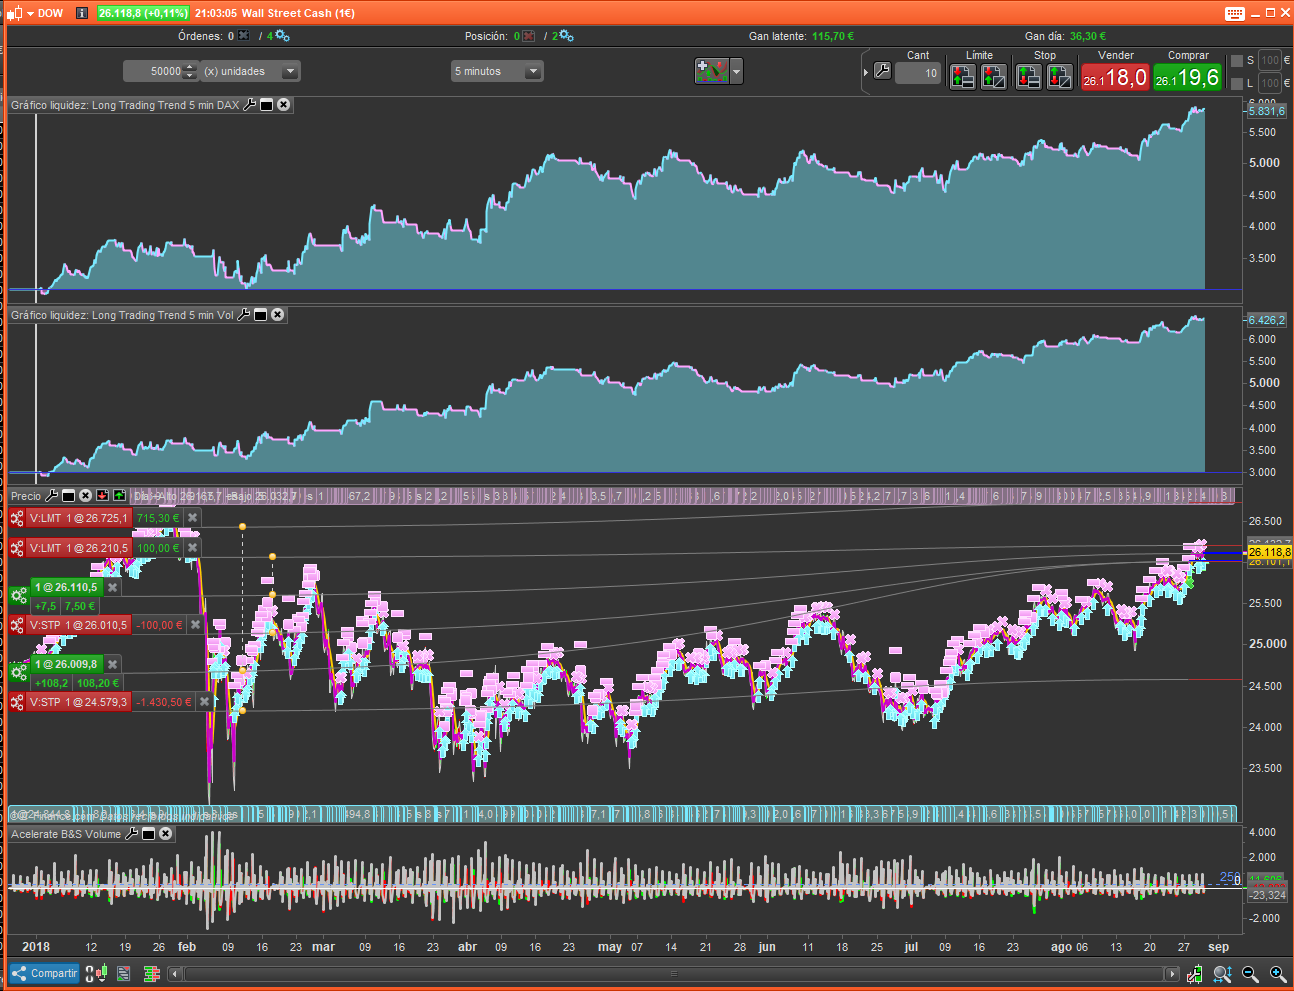
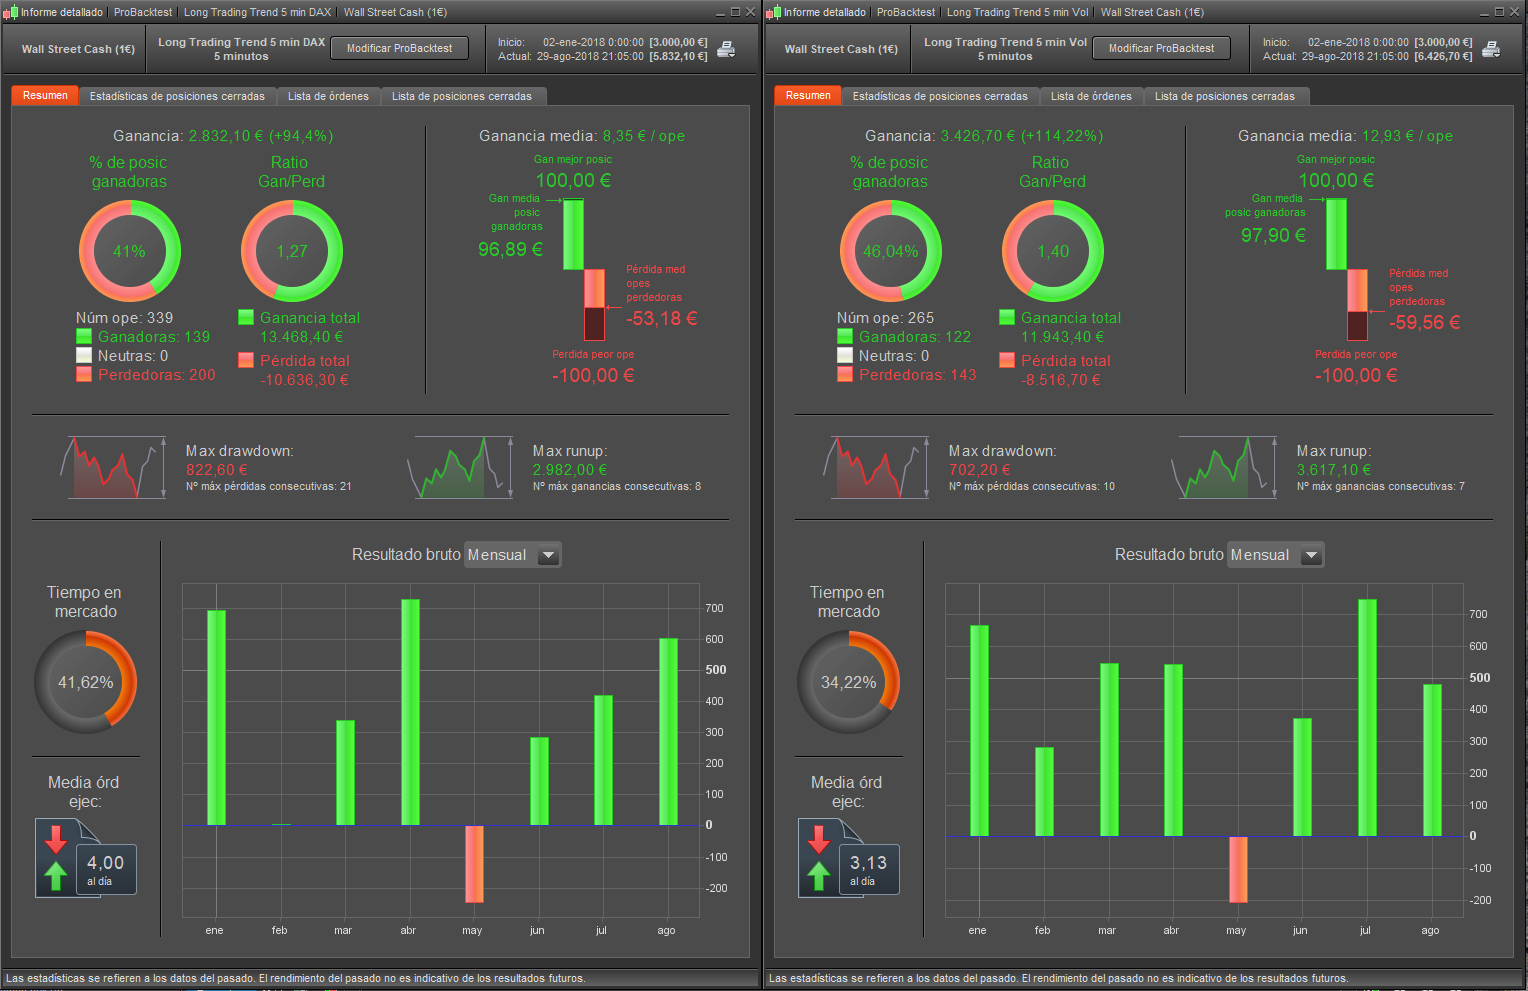
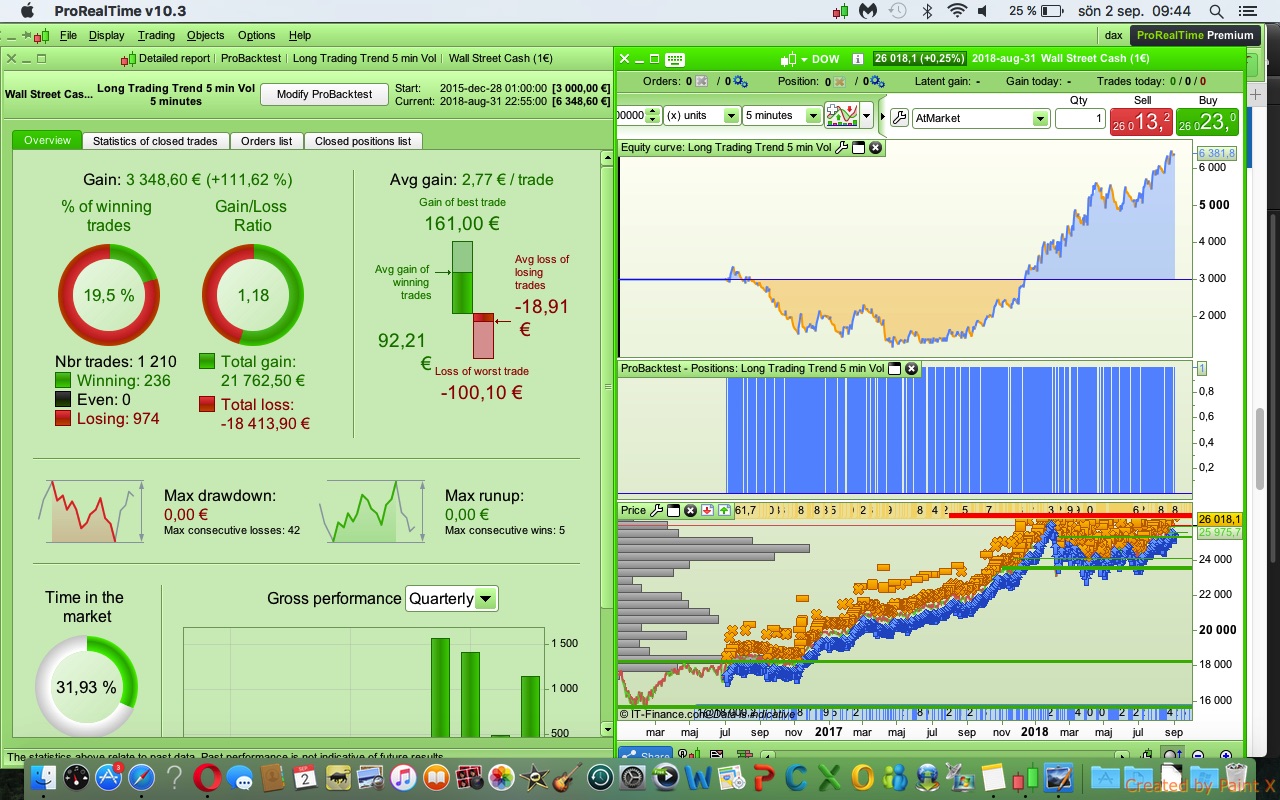
200k on your SP500 spread=2.
X
I did a 200k test on your code.
@Stefanb @Xusto @anybody … got any tweaks / fixes for that big drawdown shown on Stefanb screenshot over 200k bars above??
Please post your tweaked / fixed code on here with screen shot of equity curve and performance results.
Equity curve stagnation and lose come from ranging market. This seems normal for a strategy that detects market movements and bets on their continuity 🙂
Well we need code to keep out of the market when ranging?
X I did a 200k test on your code.
Above is for Xusto version with the volume tweak in post 79312.
( @stefanb in case you don’t know and for others … if you select part of the text of a post and THEN click on Quote on the right above the post then the selected text displays as a quote … very useful).
Here is a code that I will start live soon.
Have run it om demo for a while and it seems to be working ok.
Spread=1
Op 75%
DEFPARAM CumulateOrders = False
DEFPARAM PRELOADBARS = 200

indicator1 = SuperTrend[1,8]
c1 = (close <= indicator1)
indicator4 = SuperTrend[1,4]
c4 = (close <= indicator4)
c2 =  DIplus[6](close) >  DIminus[3](close)

HL = 14 // Hour of Long Entry
HLS = 12 // Hour of Long Exit
HS = 7 // Hour of Short Entry
HSS = 15 // Hour of Short Exit
LATR = 9// Number of ATRs for Stop Loss
PATR = 21 // Number of ATRs for Take Profit
ATR = 18 // ATR period

IF Hour=HL and c1 THEN
BUY 1 CONTRACTS AT MARKET
ENDIF

If LongOnMarket AND Hour=HLS THEN//
SELL AT MARKET
ENDIF

IF Hour=HS and c2 and c4 THEN
SELLSHORT 1 CONTRACTS AT MARKET
ENDIF

IF ShortOnMarket AND Hour=HSS THEN
EXITSHORT AT MARKET
ENDIF

SET STOP LOSS LATR*AverageTrueRange[ATR](close)
SET TARGET PROFIT PATR*AverageTrueRange[ATR](close)

IF Hour=HS and c2 and c4 THEN
SELLSHORT 1 CONTRACTS AT MARKET
ENDIF

IF ShortOnMarket AND Hour=HSS THEN
EXITSHORT AT MARKET
ENDIF

SET STOP LOSS LATR*AverageTrueRange[ATR](close)
SET TARGET PROFIT PATR*AverageTrueRange[ATR](close)
Lines 34-35 are duplicate and you may remove them.
Moreover, your SL & TP will change each new candle, while they should not while on market, I think you should use line 44 to write
If Not OnMarket then
and add line 47 with ENDIF
Lines 37 to 46 are all duplicated?
I guess maybe finger trouble with copy and paste??