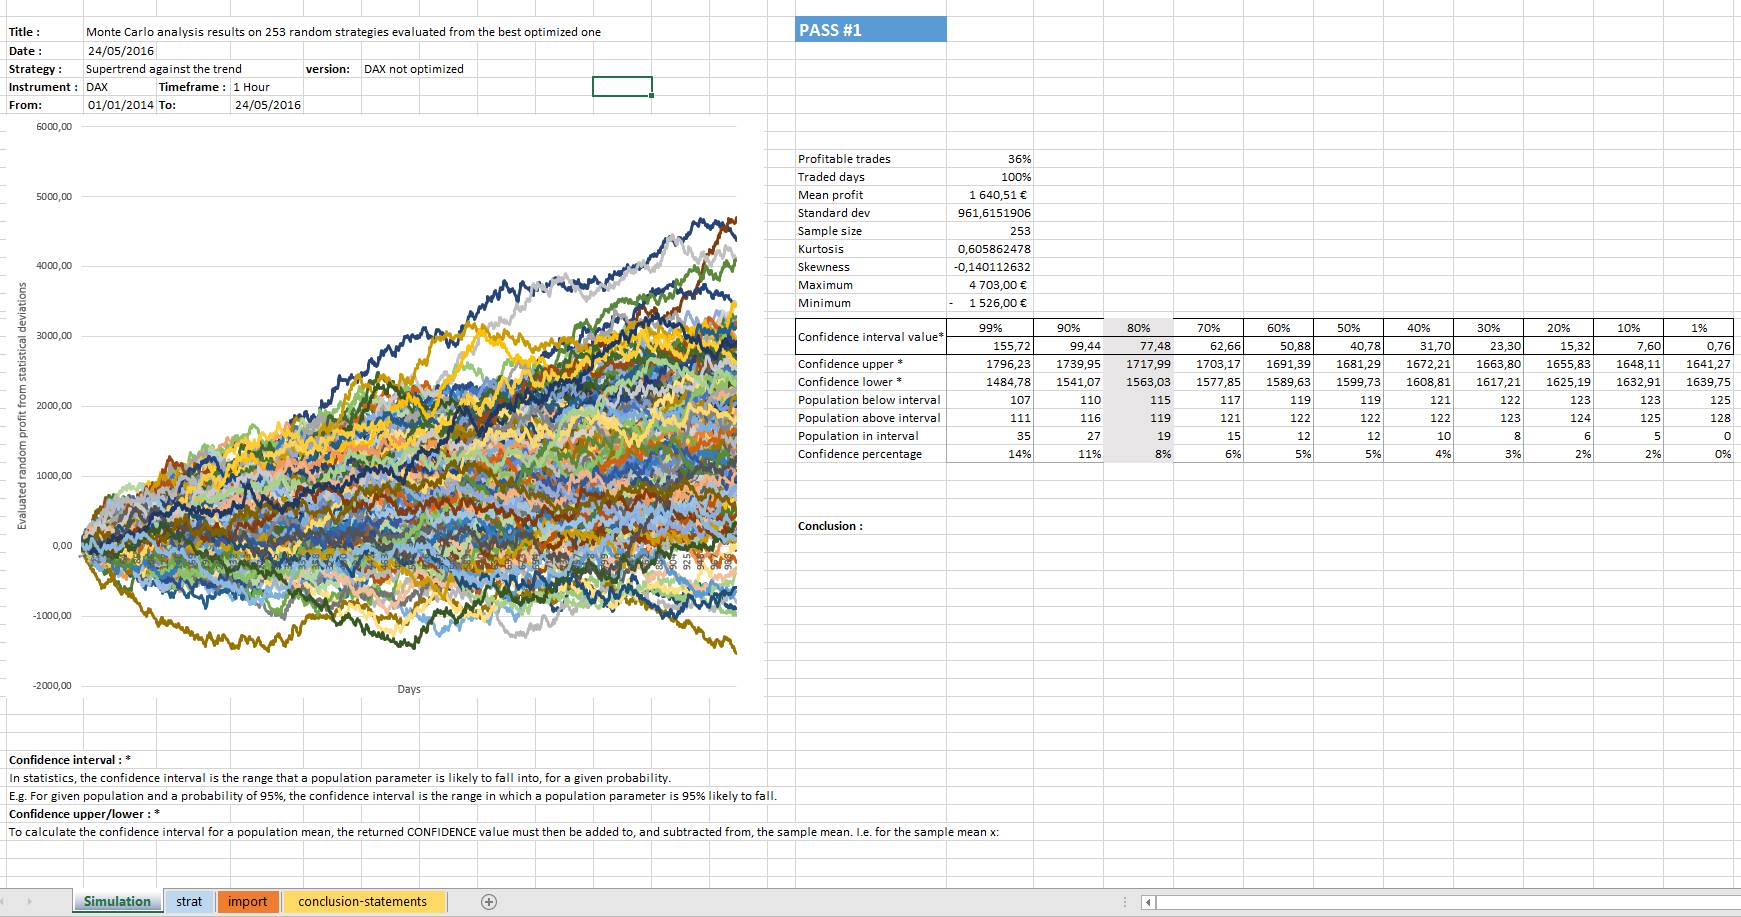
I preferred first to test your result on a non-optimized basis, since if I remember correctly, it were the one with indicators default value, isn’t it?
Results of the analysis are not bad, but the distribution of the random strategies results are quiet wide, so the confidence that a probabilistic future result of this strategy traded in the future would be around the mean profit are poor.
But the mean profit is still positive though.
Hi Nicolas, thanks a lot for this. the non optimized are the parameters that I have called (std) standard in the excel tabs.
when you say “mean profit” it means tha avarage trade?
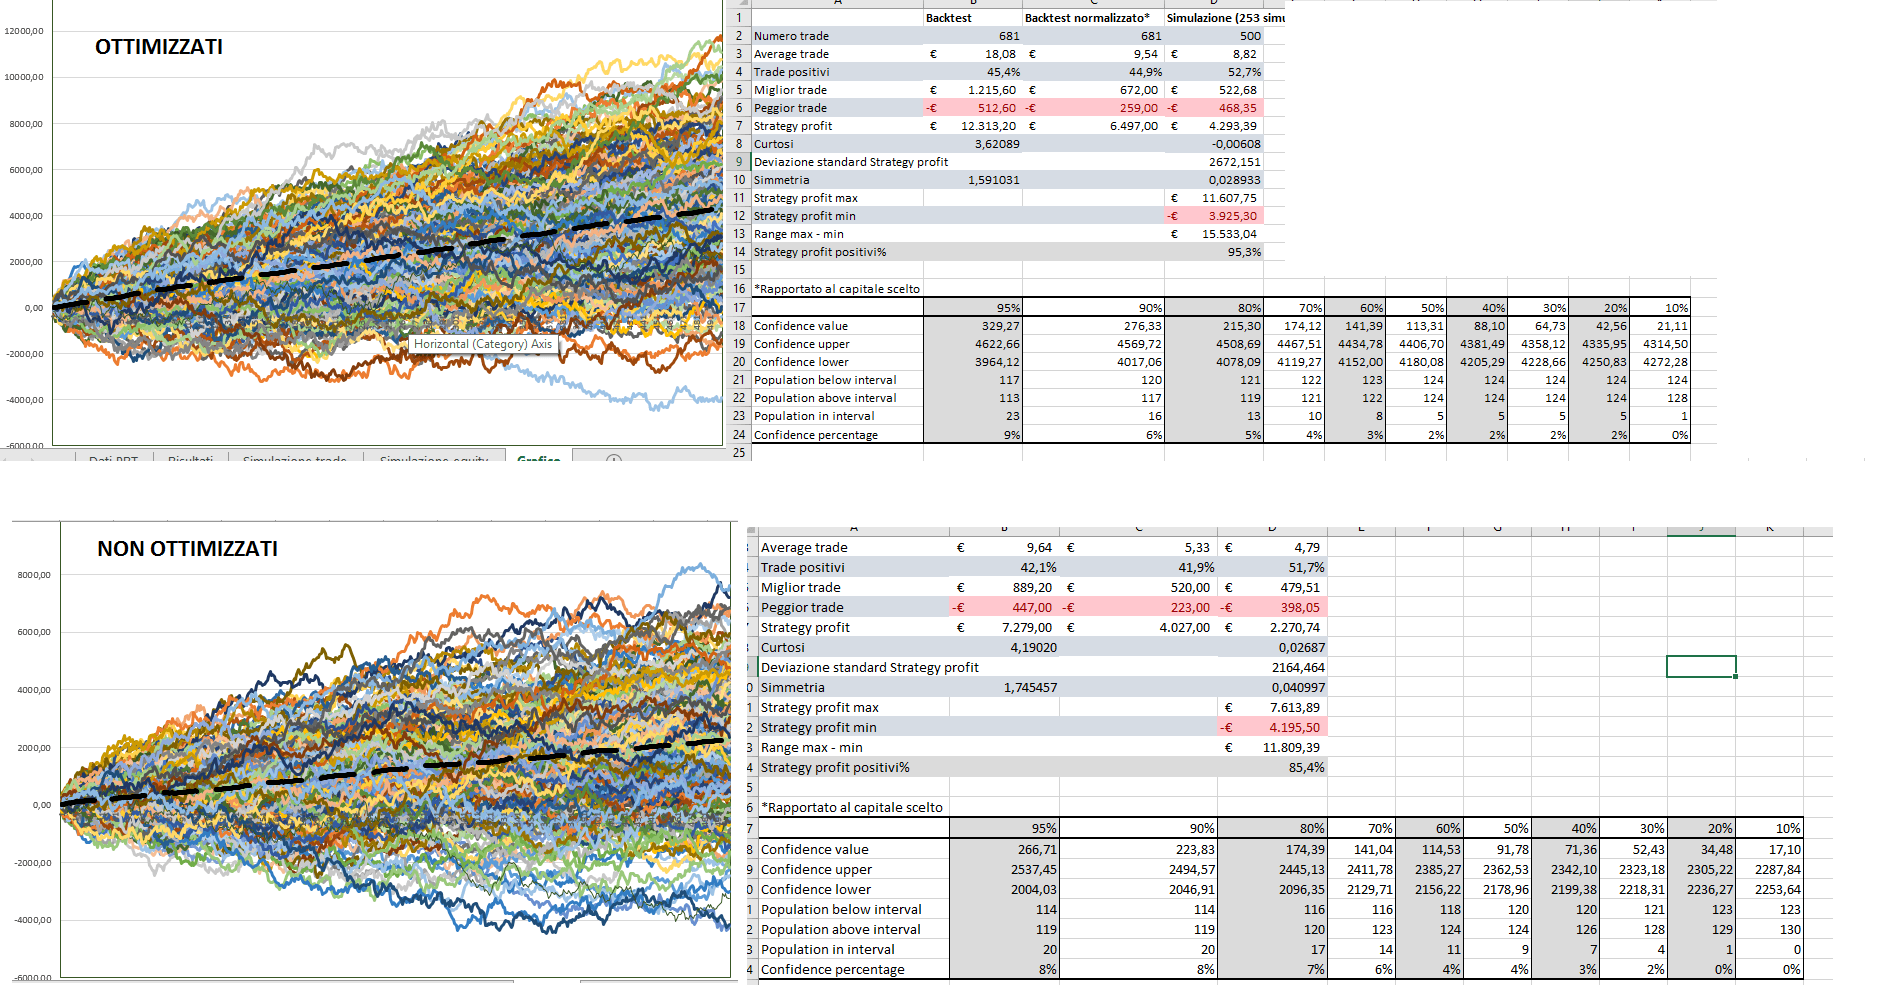
Do you agrre with this statements? “It seems from the picture that less than 10 trading line give us a negative profit over 253 lines (96.1% of trade are positive)”. Do I understand it properly?
One question that I do not understand. How can you do a montecarlo simulation from the trades and not from the past data? Or did you used them but I don’t see it on the picture?
A test like this make you more confident about the TS or less confident? Sorry but it is the first time that I use the montecarlo…
The “mean profit” is about the 253 random strategies final profit.
The curves you see are simulated behaviour of your strategy backtest with randomise profit/loss made of statistical derivative means of PnL for each simulated trade. I’m not simulating the instrument datas, but it’s almost the same since each trades (about 1000 different trades per strategy here) are scrambled (random different sort , thus like : 8 loss in a row, 3 gains, 1 loss, etc..).
About the result of this study:
The mean profit is positive: good. All simulated strategies are not positive: bad. In each confidence interval, only a few of them are settled around the mean profit, which is a result that is not bad (because you have some) but not so good (only 10% or so..). The strategy seems not curve-fitted which is already a nice result, well done. But as you can see, the probability to have the same results than the mean profit (confidence interval) represents only 8% (for a 80% interval around the mean).
thanks nicholas… I’m now courius too see it with the optimized values… If that one show that the curve is not fixed maybe we will have better results!
If it is not a problem could you run it for the not optimized values?
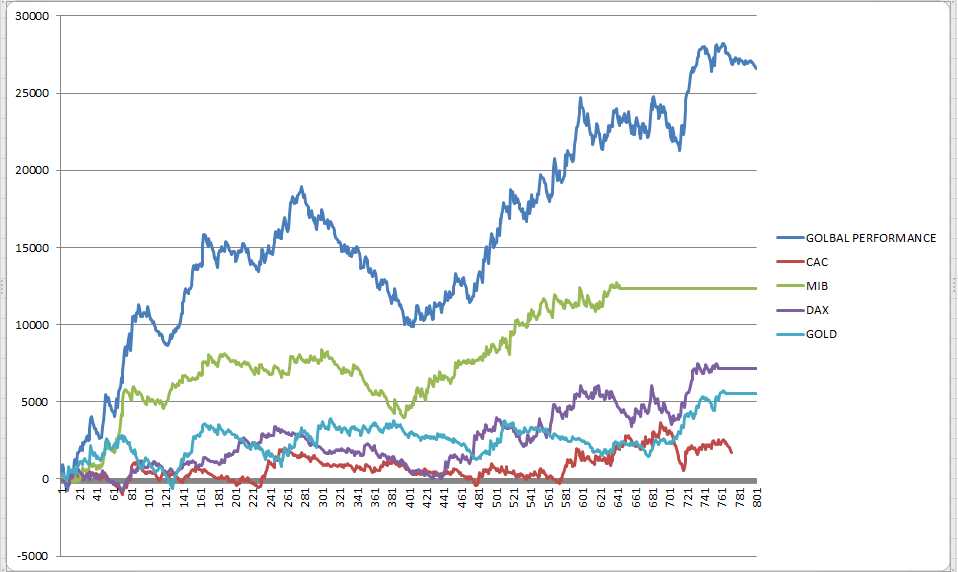
This is the curve with 5 indexes… it doesn’t seems too bad in 5 years.
Oh nice chart. Did you compare your compound result to a “buy and hold” strategy?
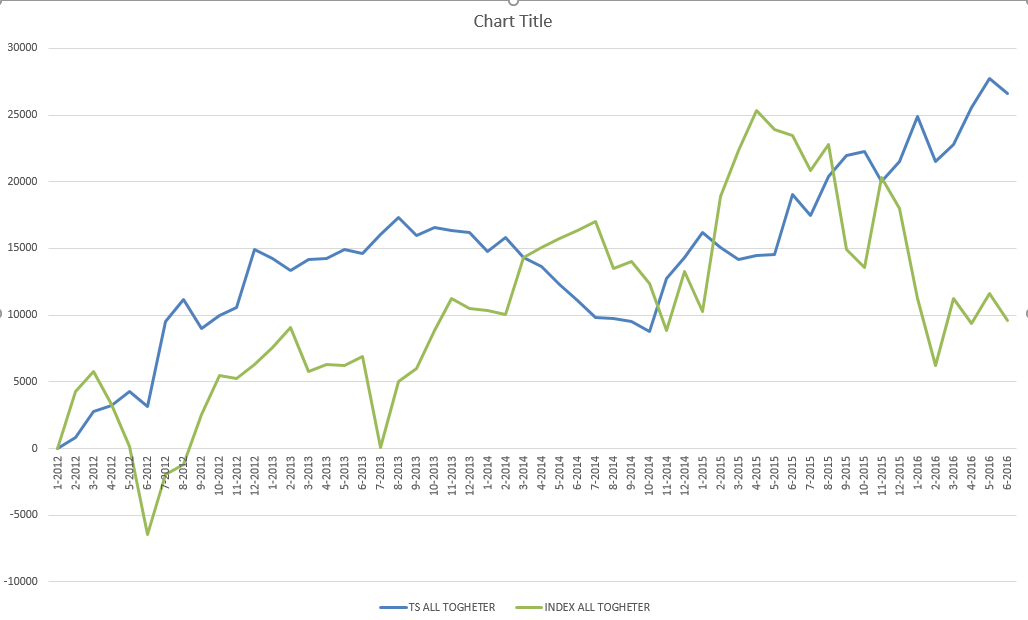
here it is… this chart show the difference of the performance between the 5 indexes traded by the TS and if we would have bought them at the beginning and waited 55months.
We can clearly see how well perfome when the market crash.
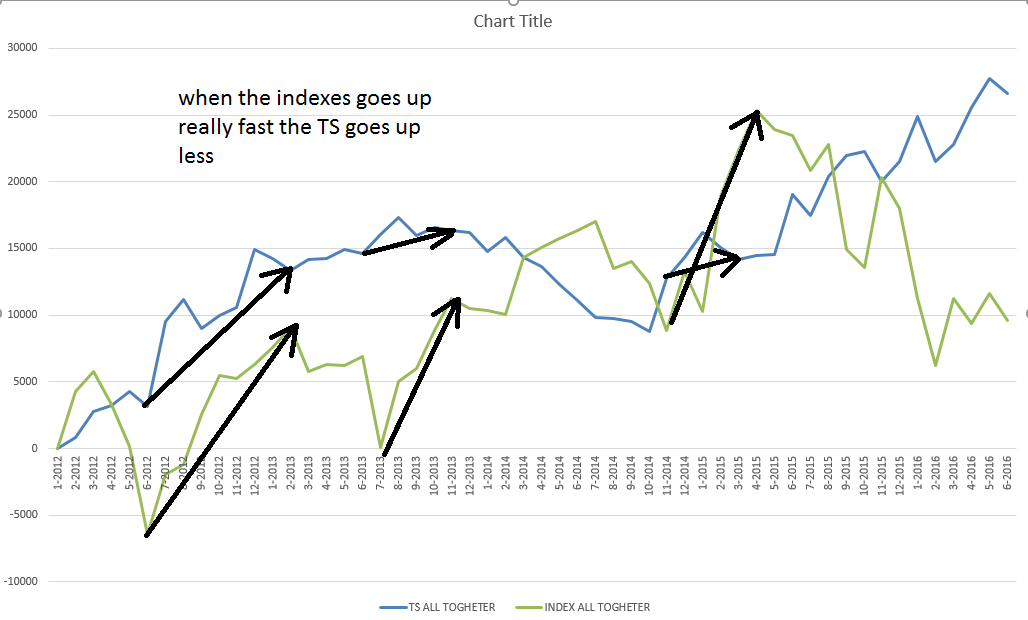
well ok, that’s interesting, as you can see clearly on your chart some contrarian behaviour when market is in big trend, your strategy perform not as good as indexes. Also, did you add spread and fees? I don’t remember if your strategy were overnight/overweekend..
I’m tring to fix the Ts to avoid to underpeform on the long big trend.Not that easy… The valatility goes down when the trend is long for a long period… I work on this.
Spread is calculated in all graphs.
To avoid to enter the market during the night when the spread is too high we have time to avoid the issue. MIB 8/18 DAX,CAC and EUROSTOX 8/22 GOLD 0/24.
The strategy goes overnight. I have another code that avoid to exit during the night but for the moment I use the original one.
David, when you say underperform do you mean making losses or not performing as well as during volatile periods?
It make less money then the indexes but doesn’t lose money….
see picture
Nicolas, two question… how did yous see from the forward test run on my system that it was not curve fitted?
Do you have any link or paper where I can study how to read and understand the montecarlo test results?
Thanks as usual for your time
If it were curve fitted, the distribution of the random strategies would have been much wider around the mean profit. It’s already wide because population of random results are not so much in different confidence interval, but as I already said, mean profit seems near of what is your initial backtest result, so this is not THE strategy of all time, but it’s obviously something interesting, well done.
Build a strategy that is not or not so over-fit on past data is already a good job. Trying to achieve better result would be great, but it would also involve that you try to over-fit on something that is not over-fit, so beware of that 🙂
thanks again. i’m now tryng to build my montecarlo excel tester to test other TS and this one with customized parameters.
here the result with the montecarlo testing of the 2 TS. Up the optimized parameters and down the standard parameters. Which one would you choose?
dwgfx, we went a little bit out of topic. would you like to continue the discussion?
This is my next thought (sterted in another discussion with Nicolas):
- if a TS work on an european index should it work also on others european index?
If it works does it mean that it is not roubust because all european index are similar or because it is roubust?
what is your opinion?