Leo
LeoParticipant
Veteran
Hi all,
I start to be interesting in Neural Network, it seems to be possible to do in prorealtime even though it has not Arrays (brace yourself, very long codes are coming).
Now with multi-time-frame support and neural network, looks very interesting for trading.
I found a very useful web that explain neural network in very simple way:
http://neuralnetworksanddeeplearning.com/chap1.html
I will start experimenting with this topic.
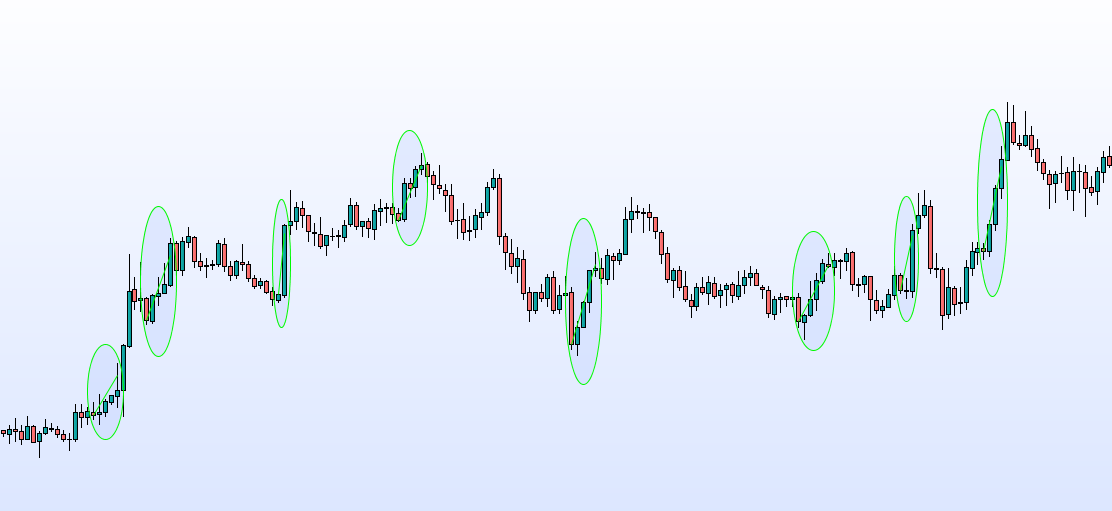
For example, I code a Classifier for long entries.
//Variables:
//candlesback=5
//ProfitRiskRatio=2
//spread=1.5


myATR=average[20](range)//+std[20](range)
ExtraStopLoss=MyATR
//ExtraStopLoss=3*spread*pipsize

classifier=0
//for long trades
FOR scan=1 to candlesback DO
IF classifier[scan]=1 then
BREAK
ENDIF
LongTradeLength=ProfitRiskRatio*(close[scan]-(low[scan]-ExtraStopLoss[scan]))
IF close[scan]+LongTradeLength < high-spread*pipsize then
IF lowest[scan+1](low) > low[scan]-ExtraStopLoss[scan]+spread*pipsize then
classifier=1
candleentry=barindex-scan
BREAK
ENDIF
ENDIF
NEXT

IF classifier=1 then
DRAWSEGMENT(candleentry,close[barindex-candleentry],barindex,close[barindex-candleentry]+LongTradeLength) COLOURED(0,250,0)
DRAWELLIPSE(candleentry-1,low[barindex-candleentry]-ExtraStopLoss,barindex+1,high+ExtraStopLoss) COLOURED(0,250,0)
ENDIF

return
I will start experimenting with this topic.
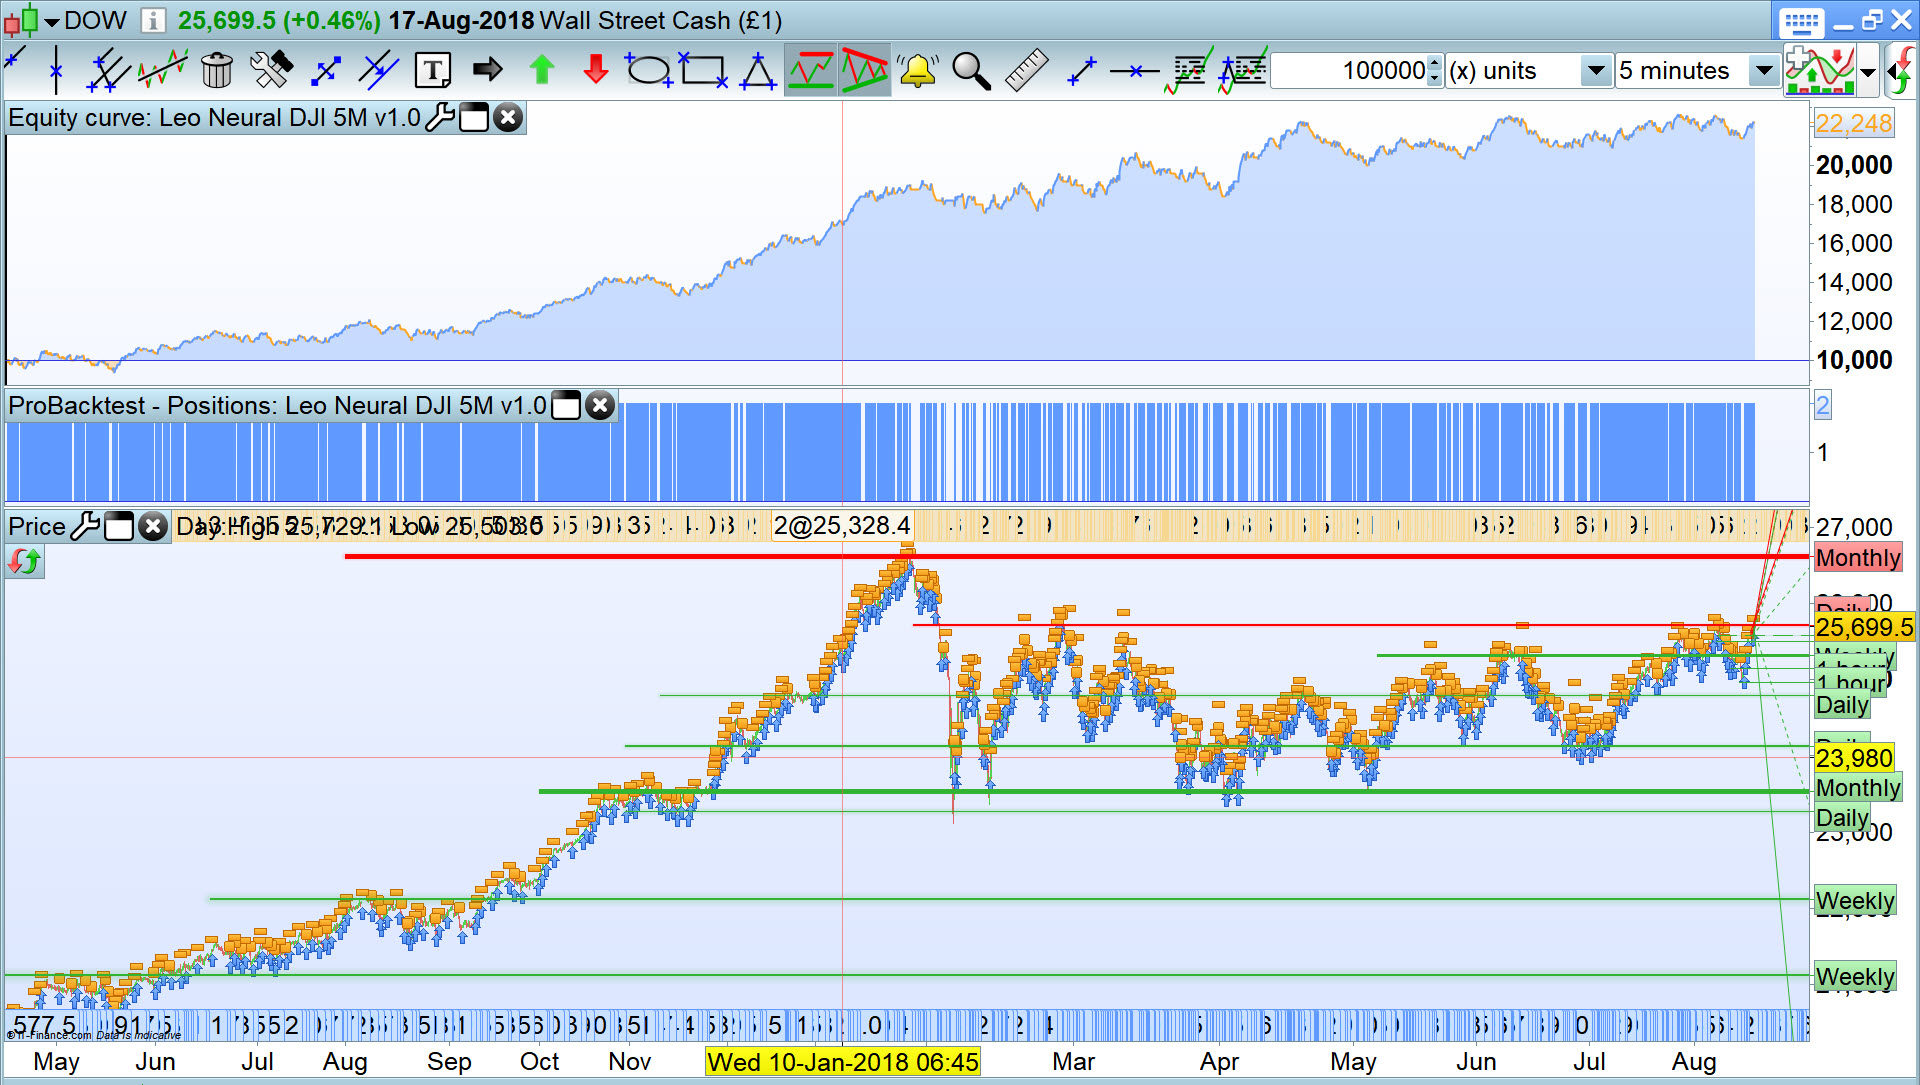
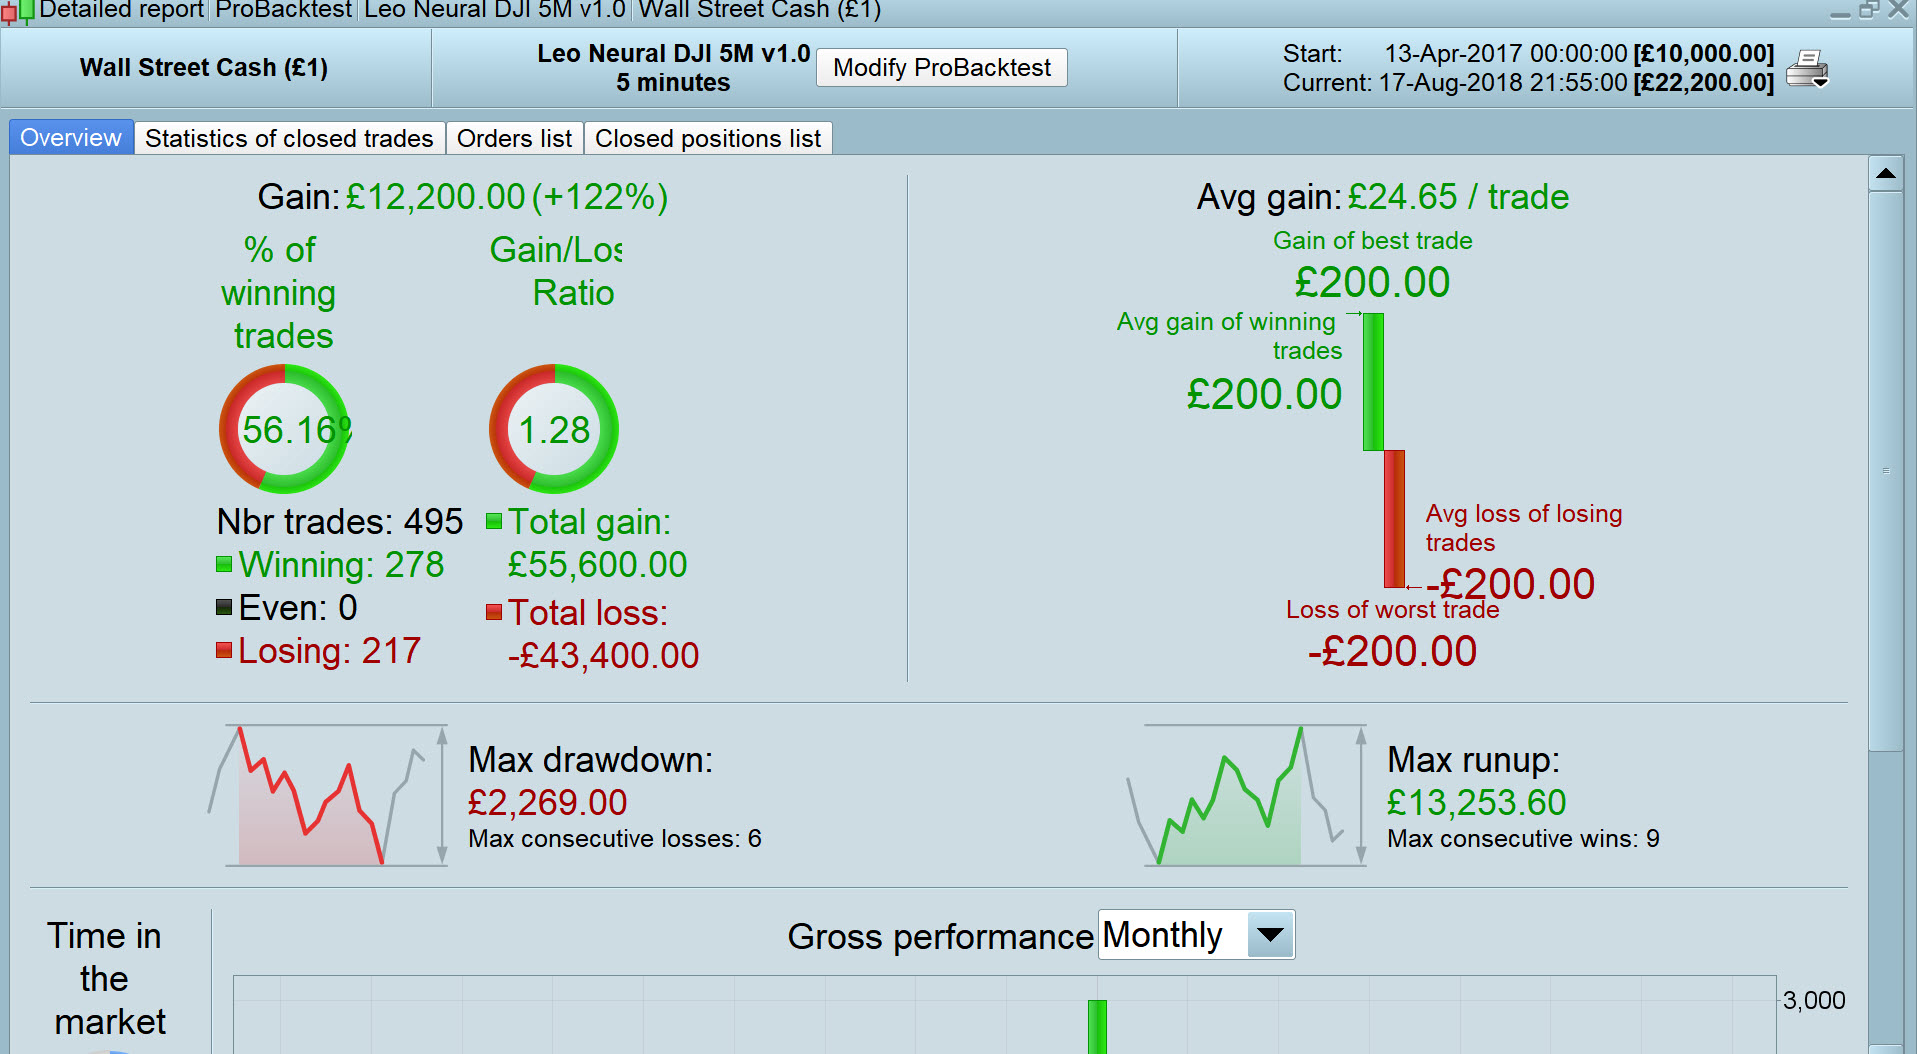
I added TP, SL and a Filter on 5m TF on DJI and I’ve set it going on Demo Fwd Test.
Thank You for sharing @Leo … I look forward to your own Topic on Neurals!
Haha I hadn’t had enough coffee when I wrote the post above … this IS your own Topic! 🙂
Results attached
Nope, I moved the discussion to a separate topic, thank you Leo for sharing the code. I subscribe and will follow it with great interest.
 Fr7
Fr7Participant
Master
Your indicator is very interesting, thanks for sharing
Is it possible to make a red ellipse contrary to the one that has been published? … That is to say for sell
Fr7Participant
Master
Hello Grahal,
Can you publish your system?
thanks
LeoParticipant
Veteran
Nope, I moved the discussion to a separate topic, thank you Leo for sharing the code. I subscribe and will follow it with great interest.
Thanks for the interesting shown. I will do my best.
LeoParticipant
Veteran
Your indicator is very interesting, thanks for sharing
Is it possible to make a red ellipse contrary to the one that has been published? … That is to say for sell
You should know that what I posted is not an indicator is a Classifier for the Neural Network, it just shows where and when would has been a winning trade. I post later the full Classifier
LeoParticipant
Veteran
Hi all,
For my first try I will try to design a Neural Network with 4 inputs, 2 output, 1 layer and as much as versatile as possible.
Any ideas for this 4 inputs?
LeoParticipant
Veteran
I will start experimenting with this topic.
I added TP, SL and a Filter on 5m TF on DJI and I’ve set it going on Demo Fwd Test.
Thank You for sharing @leo … I look forward to your own Topic on Neurals!
Hey Grahal, which function do you use for the output neurons?
it just shows where and when would has been a winning trade.
This was what I thought by looking at the code, I did not had time to test, shame on me 🙁 So I’m wondering how did GraHal use the code to trigger trades in this case?
Any ideas for this 4 inputs?
You could try to make your simple layer as an independent indicator and use it as a function by CALLing it into a synthetic indicator. It should work if you are not falling into the infinite loop limitation of ProBuilder …
Thank you Leo, no offence, but the “problem” with the indicator is that it obviously knows what happened (because it “data mines”) and it loose the information each time it has found a new setup, it doesn’t save it.
How to you plan to take advantages of what the function learned? This is what I think about:
- function is looking back
- function is finding a good setup according to your criteria ( example: ProfitRiskRatio=2 )
- function is starting a new loop in the past starting from the first candle of the good setup found at point 2/
- function is looking for a “similarity”
- similarity is found, increase the score
The “similarity” could be anything from a basic candlestick pattern to an oscillator in oversold territory, for example..
If score > x% then you may have found a valid setup that could be considerate as robust.
I’ll try to code something quickly..
This is a sample code (template) for what I was talking in my previous post:
//--- settings
candlesback=5
ProfitRiskRatio=2
spread=1.5
//--- end of settings
myATR=average[20](range)
ExtraStopLoss=MyATR
// *** DEFINE SIMILARITY ***
similarity = rsi[14] crosses over 50
// *** GOOD SETUP FINDER ***
classifier=0
//for long trades
FOR scan=1 to candlesback DO
IF classifier[scan]=1 then
BREAK
ENDIF
LongTradeLength=ProfitRiskRatio*(close[scan]-(low[scan]-ExtraStopLoss[scan]))
IF close[scan]+LongTradeLength < high-spread*pipsize then
IF lowest[scan+1](low) > low[scan]-ExtraStopLoss[scan]+spread*pipsize then
classifier=1
candleentry=barindex-scan
BREAK
ENDIF
ENDIF
NEXT
// *** GOOD SETUP FOUND ***
IF classifier=1 then
// increase the setup count
setup = setup+1
// plot good setup
DRAWSEGMENT(candleentry,close[barindex-candleentry],barindex,close[barindex-candleentry]+LongTradeLength) COLOURED(0,250,0)
DRAWELLIPSE(candleentry-1,low[barindex-candleentry]-ExtraStopLoss,barindex+1,high+ExtraStopLoss) COLOURED(0,250,0)
//check for similarity
similar = summation[candlesback](similarity[1])[barindex-candleentry]>0
if similar then
// plot where a similarity is found
drawarrowup(candleentry,low[barindex-candleentry]) coloured(0,0,255)
// increase the similarity count
simcount = simcount+1
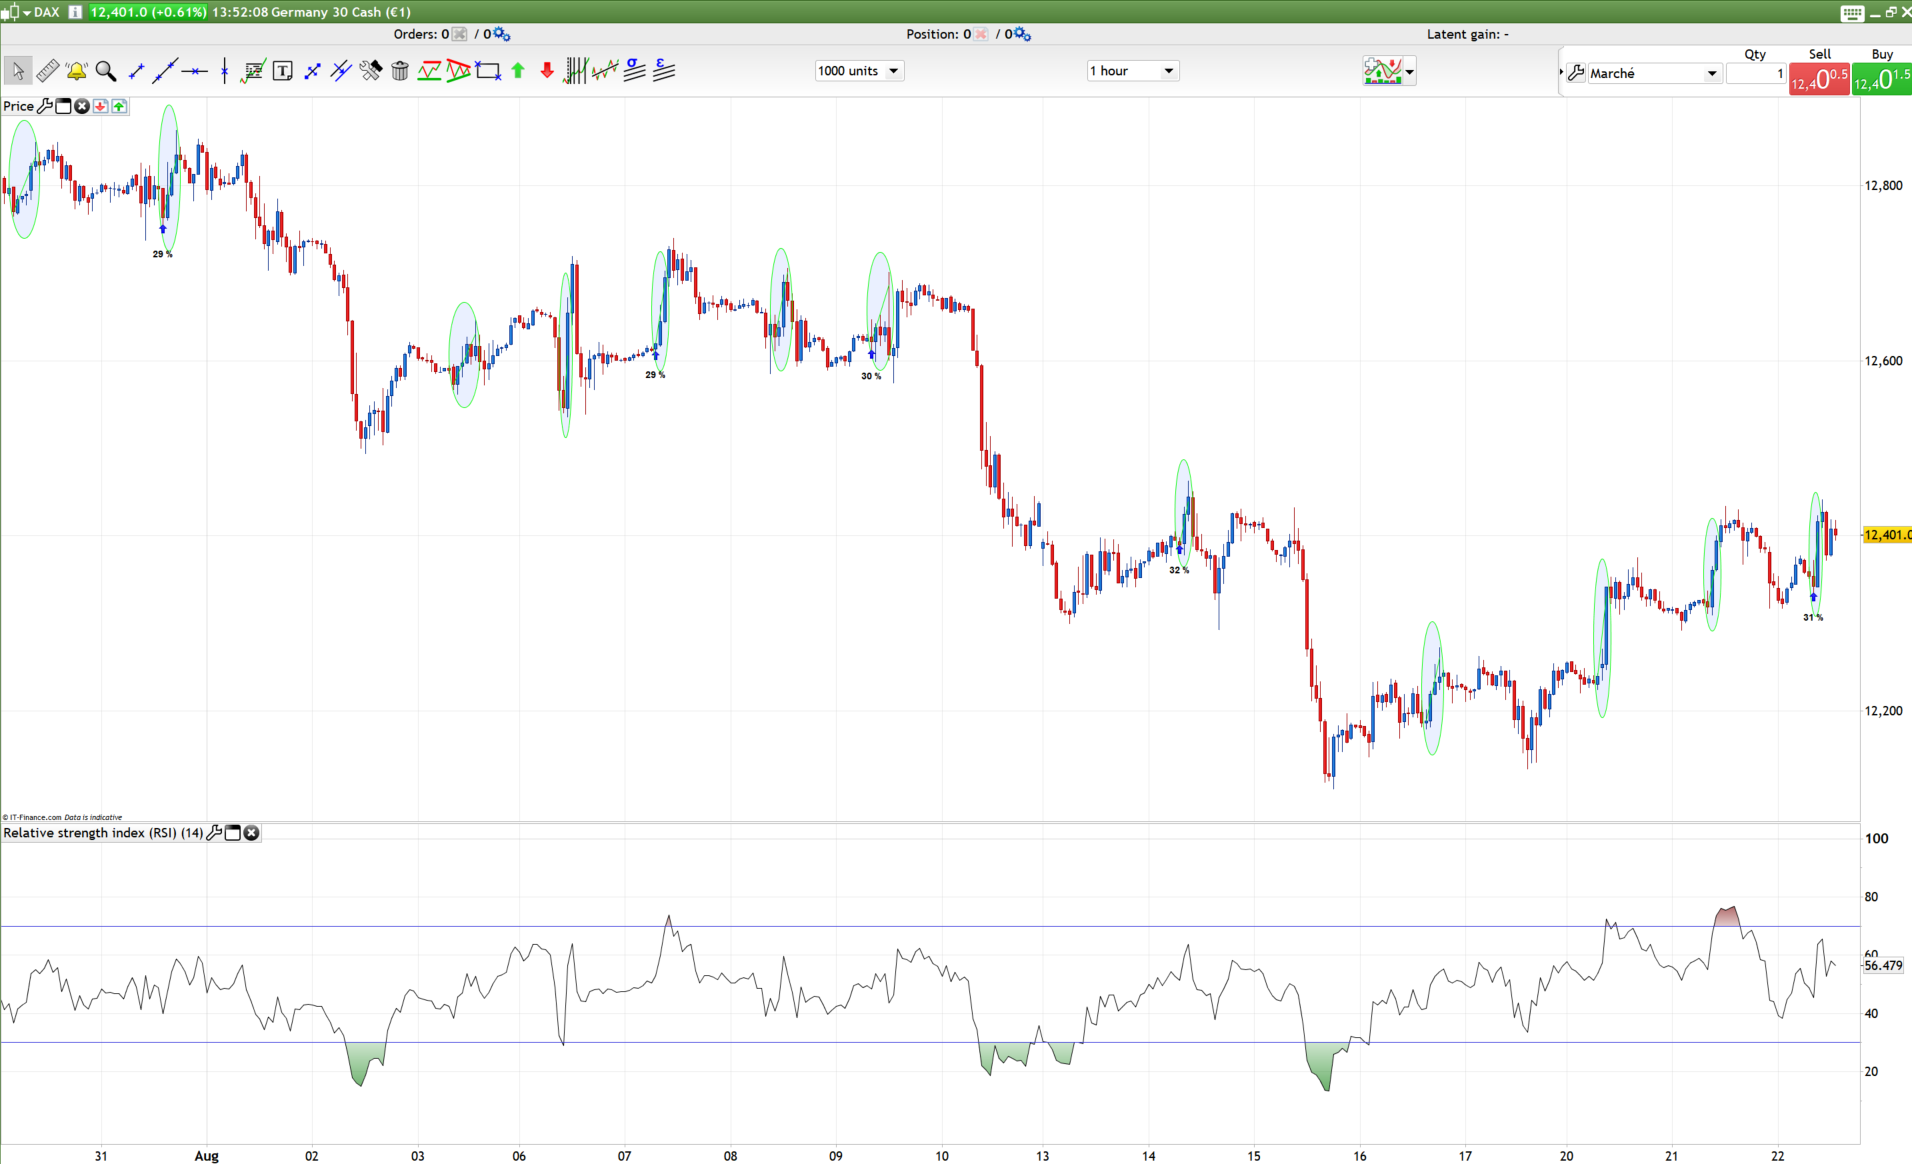
// *** PERCENTAGE OF SIMILARITY AGAINST SETUP ***
percent = round(simcount/setup*100)
drawtext("#percent#%",candleentry,low[barindex-candleentry]-averagetruerange[14],dialog,bold,14)
endif
endif
In this example, the “similarity” is a simple RSI[14] crossing over the level 50. If it has occurred at least 1 time (during ‘candlesback’) before the beginning of a setup, it scores 1 point. As for the attached picture, the similarity has been found 30% for all the setup (marked with a blue arrow).
LeoParticipant
Veteran
Hi Nicolas,
Your code is a very good idea and concept for machine learning using correlations:
The classifier (as I said before is not an indicator) detects a perfect trade and we start to store information and data in that moment ( what you call similarity1, similarity2, similarity3, etc), and study if there is a correlation between the “perfect trade” and the “similarity”
As far as I understand Neuronal Networks, we choose a number of inputs for example rsi[14], adx [20], (close-average[20]), etc, etc, and the variables in the neurons “store” several and many correlations, behaviours, sentiments or whatever you want to call it ( in facts some autors claim that neutonal networks can learn anything if we provide enough data)…. and if that behaviour change… the neural network change and adapt as well!!!
Thats the beauty of Neuronal Networks.
One can imagine that without Array support in ProRealTime is almost impossible…. well, we together can find it out…
I always keep in mind that the financial markets do whatever they want… it doesn’t matter how complex the neuronal network is.
LeoParticipant
Veteran
Here is the video that open my mind to the potential of Neural Network in prorealtime
https://www.youtube.com/watch?v=ILsA4nyG7I0