Hi,
Here is my attempt to overpass PRT’s unability to deal with MultiTimeFrame strategies.
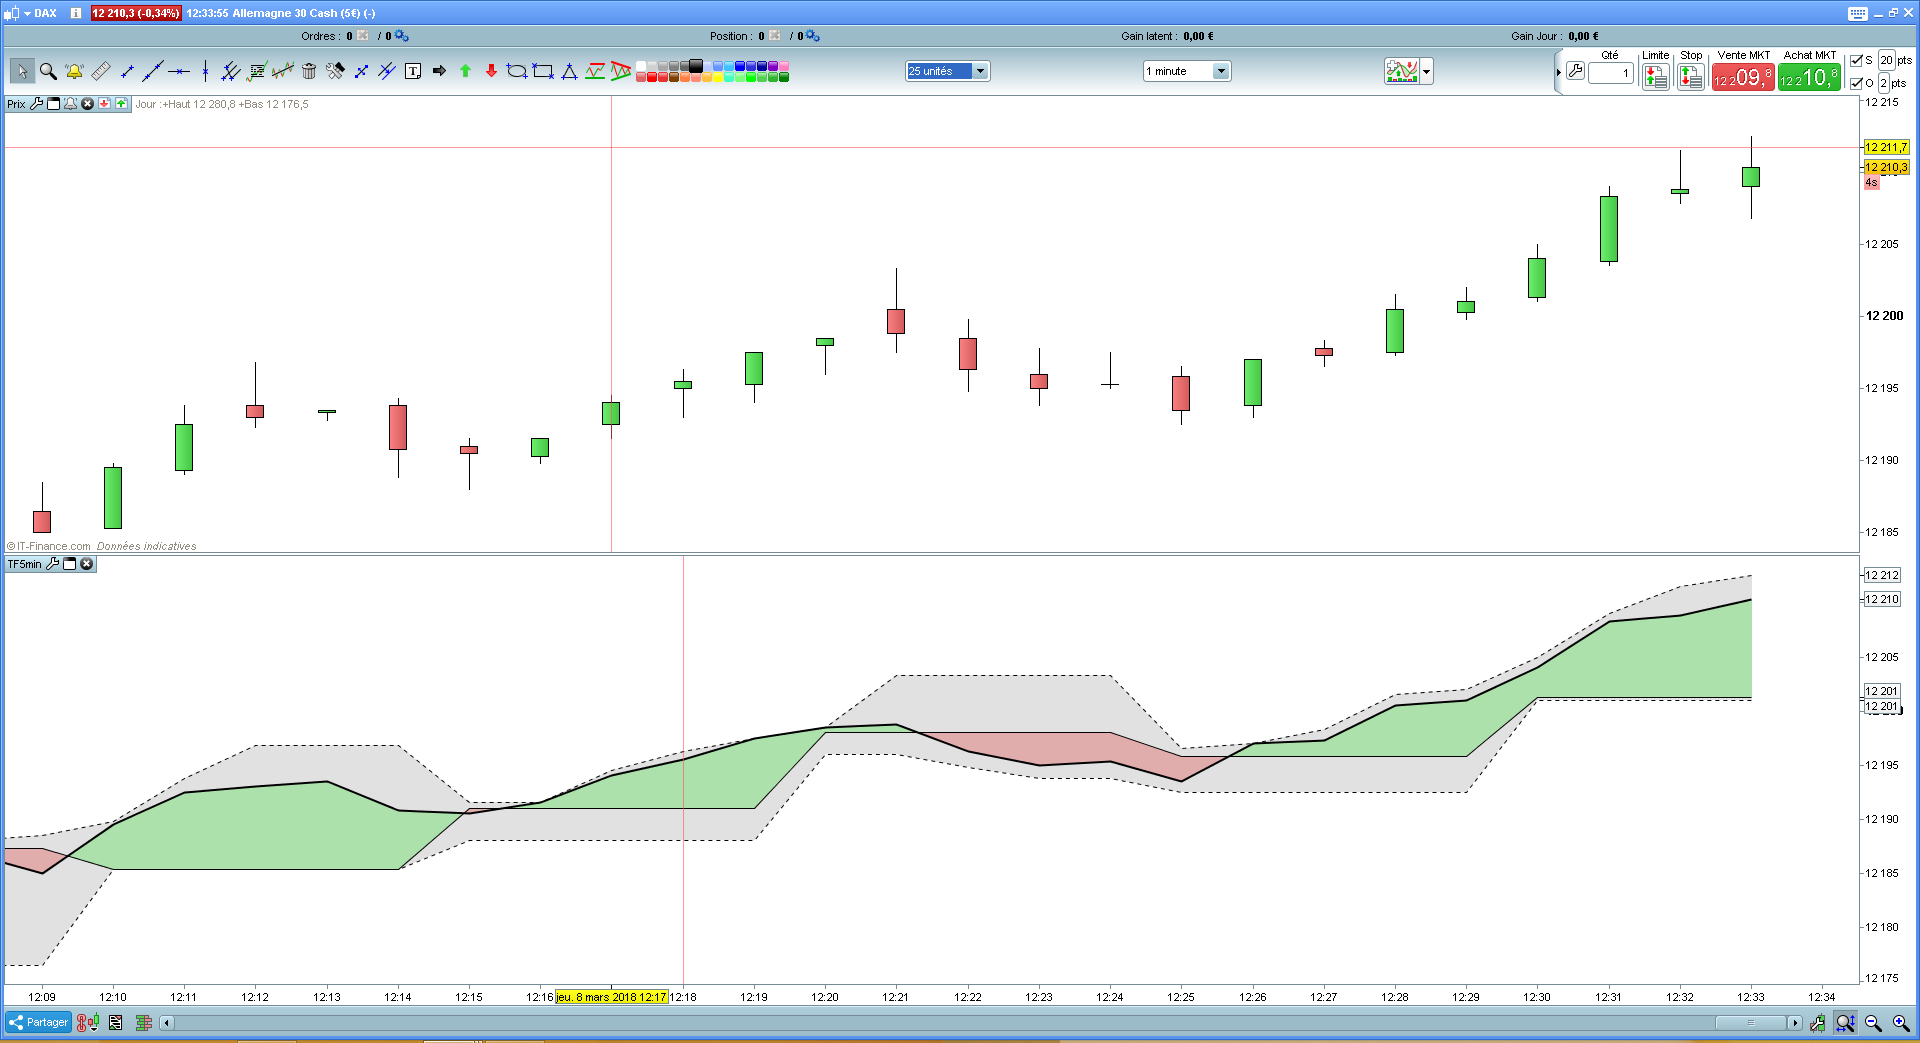
I started by simply coding the 5min candles on a 1min chart (ie. : here on DAX).
The code could probably be optimized but it works as far as I can see.
I will be happy to hear your comments, questions and thoughts.
BR,
HORSSECONDE=100*(round(time/100))

MUNITE=((HORSSECONDE/10000 - round(HORSSECONDE/10000))*100)-1
if MUNITE<0 then
MUNITE=((HORSSECONDE/10000 - (round(HORSSECONDE/10000)-1))*100)-1
endif
if MUNITE=99 then
MUNITE=59
endif

RESTE=5*(MUNITE/5 - (round(MUNITE/5)-1))
if reste>=5 then
reste=reste-5
endif

if reste=0 then
ouverture=open
cloture=close
haut=high
bas=low
elsif reste=1 then
ouverture=open[1]
cloture=close
haut=max(haut,high)
bas=min(bas,low)
elsif reste=2 then
ouverture=open[2]
cloture=close
haut=max(haut,high)
bas=min(bas,low)
elsif reste=3 then
ouverture=open[3]
cloture=close
haut=max(haut,high)
bas=min(bas,low)
elsif reste=4 then
ouverture=open[4]
cloture=close
haut=max(haut,high)
bas=min(bas,low)
endif

return ouverture as "OPEN", cloture as "CLOSE",haut as "HIGH",bas as "LOW"
 Leo
LeoParticipant
Veteran
Nice approach. I do not tested yet. It is possible to draw box and lines in the chart. Nicolas has made it somewhere with renkt candles.
Thanks a lot toto!
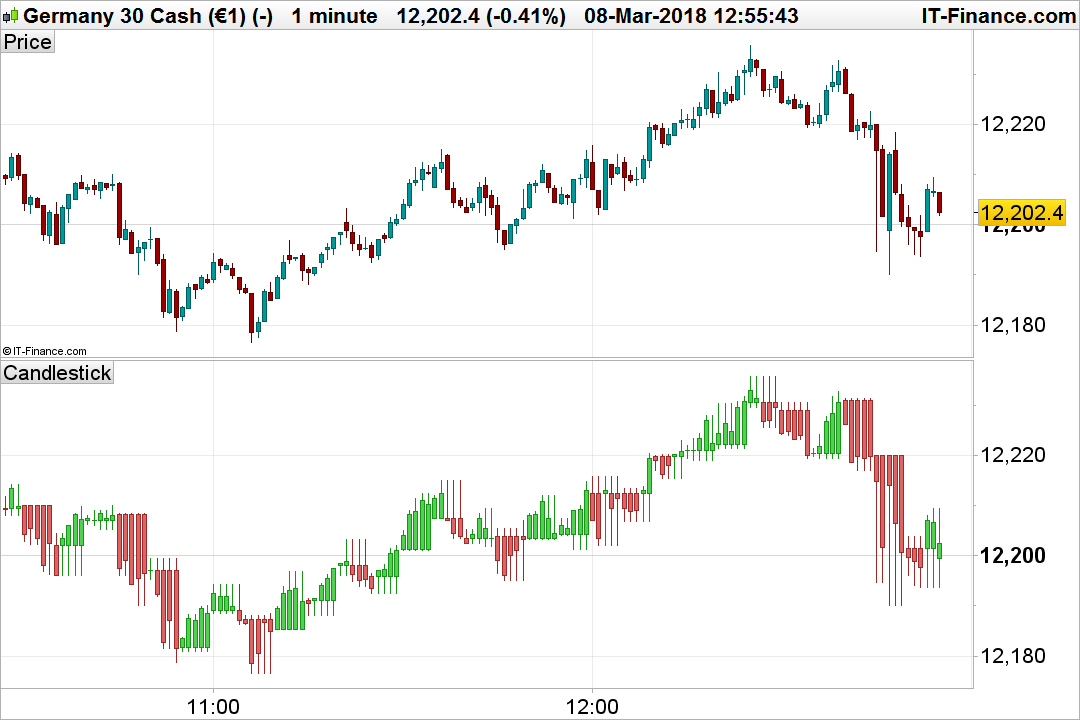
Or you can also draw a candlestick updated, each minute, example with your code:
HORSSECONDE=100*(round(time/100))

MUNITE=((HORSSECONDE/10000 - round(HORSSECONDE/10000))*100)-1
if MUNITE<0 then
MUNITE=((HORSSECONDE/10000 - (round(HORSSECONDE/10000)-1))*100)-1
endif
if MUNITE=99 then
MUNITE=59
endif

RESTE=5*(MUNITE/5 - (round(MUNITE/5)-1))
if reste>=5 then
reste=reste-5
endif

if reste=0 then
ouverture=open
cloture=close
haut=high
bas=low
elsif reste=1 then
ouverture=open[1]
cloture=close
haut=max(haut,high)
bas=min(bas,low)
elsif reste=2 then
ouverture=open[2]
cloture=close
haut=max(haut,high)
bas=min(bas,low)
elsif reste=3 then
ouverture=open[3]
cloture=close
haut=max(haut,high)
bas=min(bas,low)
elsif reste=4 then
ouverture=open[4]
cloture=close
haut=max(haut,high)
bas=min(bas,low)
endif

drawcandle(ouverture,haut,bas,cloture)

return
@Nicolas,
Would it be possible to have more explanation on the composition of the code? Because visually it’s very clean, but I do not see any correlation with the actual range of candles 1 Minute …
Some tracks for its use would be welcome!
Good night
This is not my code. I just added the candlesticks, they replace the lines. As Toto explained, this indicator plots 5 minutes Open/High/Low/Close on a 1 minute timeframe.
I’m struggling a little bit to understand the code because I am a stupid Englishman who speaks only a tiny little bit of each language (I can order a beer)! Could someone adapt this to show weekly candles on a daily chart and save me a lot of effort doing Google translate? Sorry but I am a lazy Englishman as well as a monolingual Englishman!
@Vonasi
I don’t think it is necessary to start from this code to make weekly candles on a daily chart, you can use the simple approach you can find in a weekly pivot points indicator instead.
Thanks for your comments.
Code could be simplified as the function “MINUTE” exists in PRT.
Code is just here to show that even if MTF is not available yet on PRT, there are ways to overpass this… I am rather scalper than day trader so that I do not need weekly/daily charts in general. But it might not be so difficult to code as well.
Hello,
Can you please tell me how I would set an alert for when the ‘candlesticks’ go bullish to bearish and vice versa.
I am using the indicator that has the slightly modified code from Nicolas
drawcandle(ouverture,haut,bas,cloture)
Grateful for any replies, thank you.
Kat
Hello,
I take back my question, I see how to add the alert using the original code.
Kat
Hello,
Can you please tell me how I would set an alert for when the ‘candlesticks’ go bullish to bearish and vice versa.
I am using the indicator that has the slightly modified code from Nicolas
|
|
drawcandle(ouverture,haut,bas,cloture)
|
Grateful for any replies, thank you.
Kat
Thank you for your very useful code Toto.
I scalp the Nasdaq futures and was wondering if it was possible to adapt it, or create something similar, for use on a 1 second chart with 5 or 15 second candles.
I have been trying to do so, but with no success.
Thank you.
 JS
JSParticipant
Veteran
Hi @financier
You can now use the different time frames…
When you want to have 10 second candles in a graph with a time frame of 1 second:
TimeFrame(10 seconds, UpdateOnClose)
DrawCandle(Open, High, Low, Close)
Return
(So, open this indicator in a graph with a time frame of 1 second…)
Hi JS,
Thank you for your reply.
I will be using the code that you’ve recommended.