Hey ! I’m glad it works for you ! Are you using it on 1min timeframe? because it is much more profitable on 2min (because optimized for it).
Here is the latest code, with “quit snippet” (don’t forget to adjust capital and %loss if you’re using it) :
a=50
b=500
c=175
d=39
// Trend Surfer DAX Modified
DEFPARAM CumulateOrders = False
//ONCE BigLoss  = 0.95
//ONCE Capital  = 10000
//IF NOT OnMarket AND OnMarket[1] THEN
//IF (Capital + StrategyProfit) <= (Capital * BigLoss) THEN
//QUIT
//ENDIF
//Capital = Capital + StrategyProfit
//ENDIF

taille=1
for i = 1 to 2 do
if positionperf(i)<0 then
taille=taille-1
else
if taille<5 then
taille=taille+1
endif
endif
next

// Conditions pour ouvrir une position acheteuse
indicator1 = Average[a](close)
indicator2 = Average[b](close)
c1 = (indicator1[1] CROSSES OVER indicator2[1])

IF c1 THEN
BUY max(1,taille) SHARES AT MARKET
ENDIF

// Conditions pour fermer une position acheteuse
indicator3 = Average[a](close)
indicator4 = Average[b](close)
c2 = (indicator3[1] CROSSES UNDER indicator4[1])

IF c2 THEN
SELL AT MARKET
ENDIF

// Conditions pour ouvrir une position en vente à découvert
indicator5 = Average[a](close)
indicator6 = Average[b](close)
c3 = (indicator5[1] CROSSES UNDER indicator6[1])

IF c3 THEN
SELLSHORT max(1,taille) SHARES AT MARKET
ENDIF

// Conditions pour fermer une position en vente à découvert
indicator7 = Average[a](close)
indicator8 = Average[b](close)
c4 = (indicator7[1] CROSSES OVER indicator8[1])

IF c4 THEN
EXITSHORT AT MARKET
ENDIF

StopdistanceBreakeven = d

nb = barindex - tradeindex
minprice = lowest[nb + 1](Low)
maxprice = highest[nb + 1](High)

If longonmarket then
If maxprice >= positionprice + StopdistanceBreakeven then
sell at positionprice +1 stop
else
SET STOP ptrailing c
endif
endif

If shortonmarket then
If minprice <= positionprice - StopdistanceBreakeven then
exitshort at positionprice -1  stop
else
SET STOP ptrailing c
endif
ENDIF
@GraHal you were right, first “(lowest[m](low))” and “tradeprice” were inverted. Then I fixed the code, and I now have a break even and trailing highs and lows 🙂
It doesn’t work for this particular strategy, but I think we can use it on others, I am currently testing it on my dax trend surfer 1 min.
I just got one problem : when I optimize “m” and “n”probacktest tests all possibilities for m (as it should be), but n stays to 1 !
Is it a bug from the plateform ?
Here is the code :
//trailing stop function
trailingstart = 39 //trailing will start @trailinstart points profit

clow = (lowest[m](low))-tradeprice
chigh= tradeprice-(highest[n](high))

//reset the stoploss value
IF NOT ONMARKET THEN
newSL=0
ENDIF
//manage long positions
IF LONGONMARKET THEN
//first move (breakeven)
IF newSL=0 AND close-tradeprice(1)>=trailingstart*pipsize THEN
newSL = tradeprice(1)+1
else
SET STOP ptrailing 175
ENDIF
//next moves
IF newSL>0 AND clow>trailingstart then
newSL = newSL+clow*pipsize
ENDIF
ENDIF

//manage short positions
IF SHORTONMARKET THEN
//first move (breakeven)
IF newSL=0 AND tradeprice(1)-close>=trailingstart*pipsize THEN
newSL = tradeprice(1)-1
else
SET STOP ptrailing 175
ENDIF
//next moves
IF newSL>0 AND chigh>trailingstart then
newSL = newSL-chigh*pipsize
ENDIF
ENDIF

//stop order to exit the positions
IF newSL>0 THEN
SELL AT newSL STOP
EXITSHORT AT newSL STOP
ENDIF
Hello again,
here is an other enigma i am not able to solve myself :
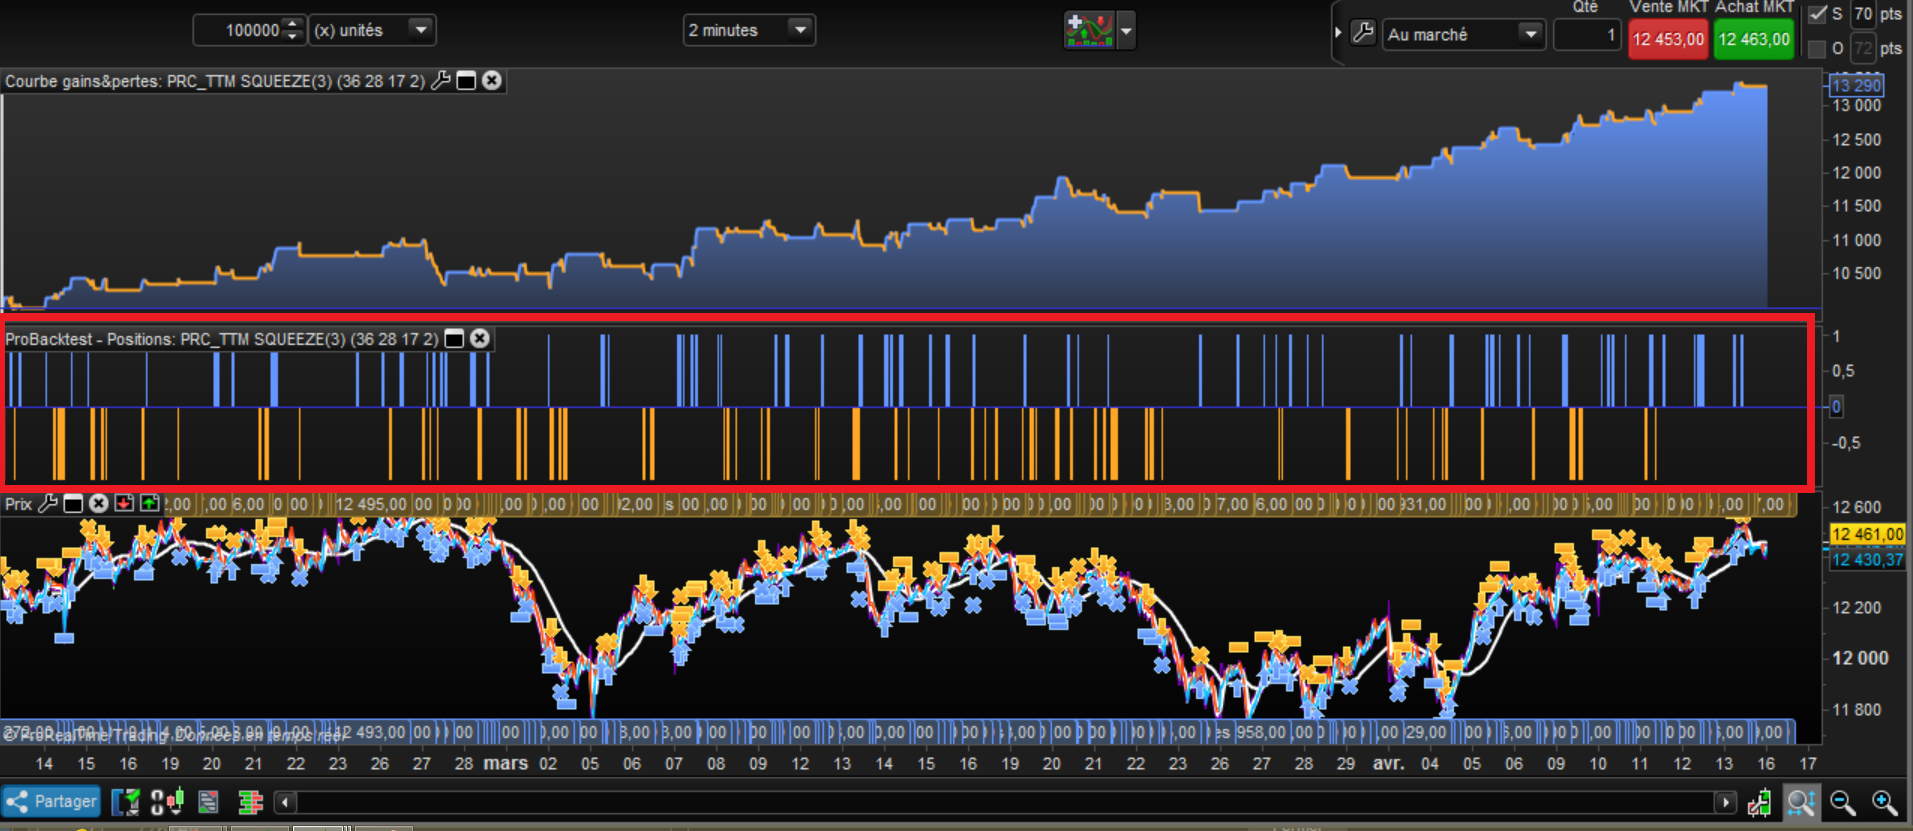
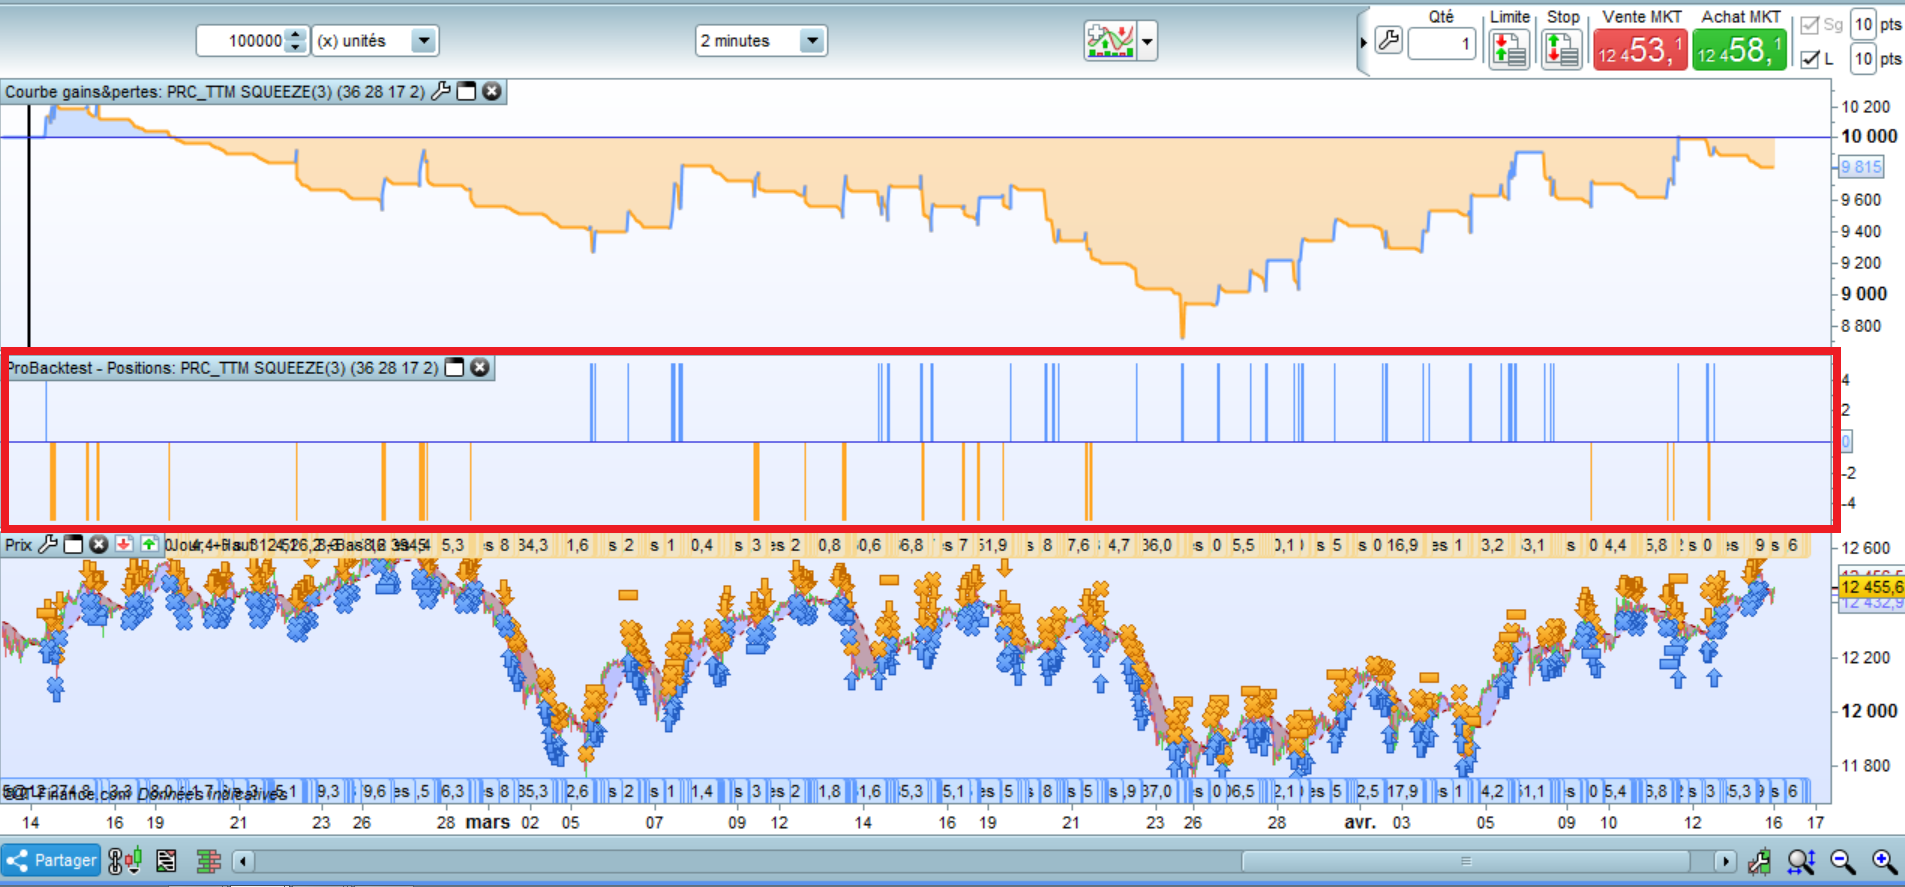
I wrote the PRC_squeeze system (seen above) on IB markets, futur Dax (because this is where I trade manually, and where i spend most of my time). So far i’m happy with the curve, ready to test it on ProOrder.
I exported the strategy on IG markets, CFD Dax and the stratety transforms into a looser one.
Now, I know the curves are not the same and several cotation points off, but the Squeeze is (please tell me if I’m wrong, I’ve got a lot to learn) a momentum indicator, thus this shouldn’t be a problem, because it buys/sells on the trend strength (thus in relation with previous historic) and not on fixed levels.
So theorically, it should buy/sell on the same time (or close) in both cases, and even if it is not the case, the system should work anyway, shouldn’t it ?
So why is it not the case ?
Why, all parameters equals, can’t I get a similar curve ?
Is it the system itself ? the market ? the plateform ? me ? or everything at the same time ?
Could someone test it on Ig broker and tell me the result ?
Attached is :
- the system, dax 2 min
- the supertrend extended indicator (used in the system)
- the curves on IG and IB
- in the red squares are buying and selling times which are different and I can’t see why
 Eric
EricParticipant
Master
FDAX 08-22?
IG CFD 00-22:15, 22:30-23
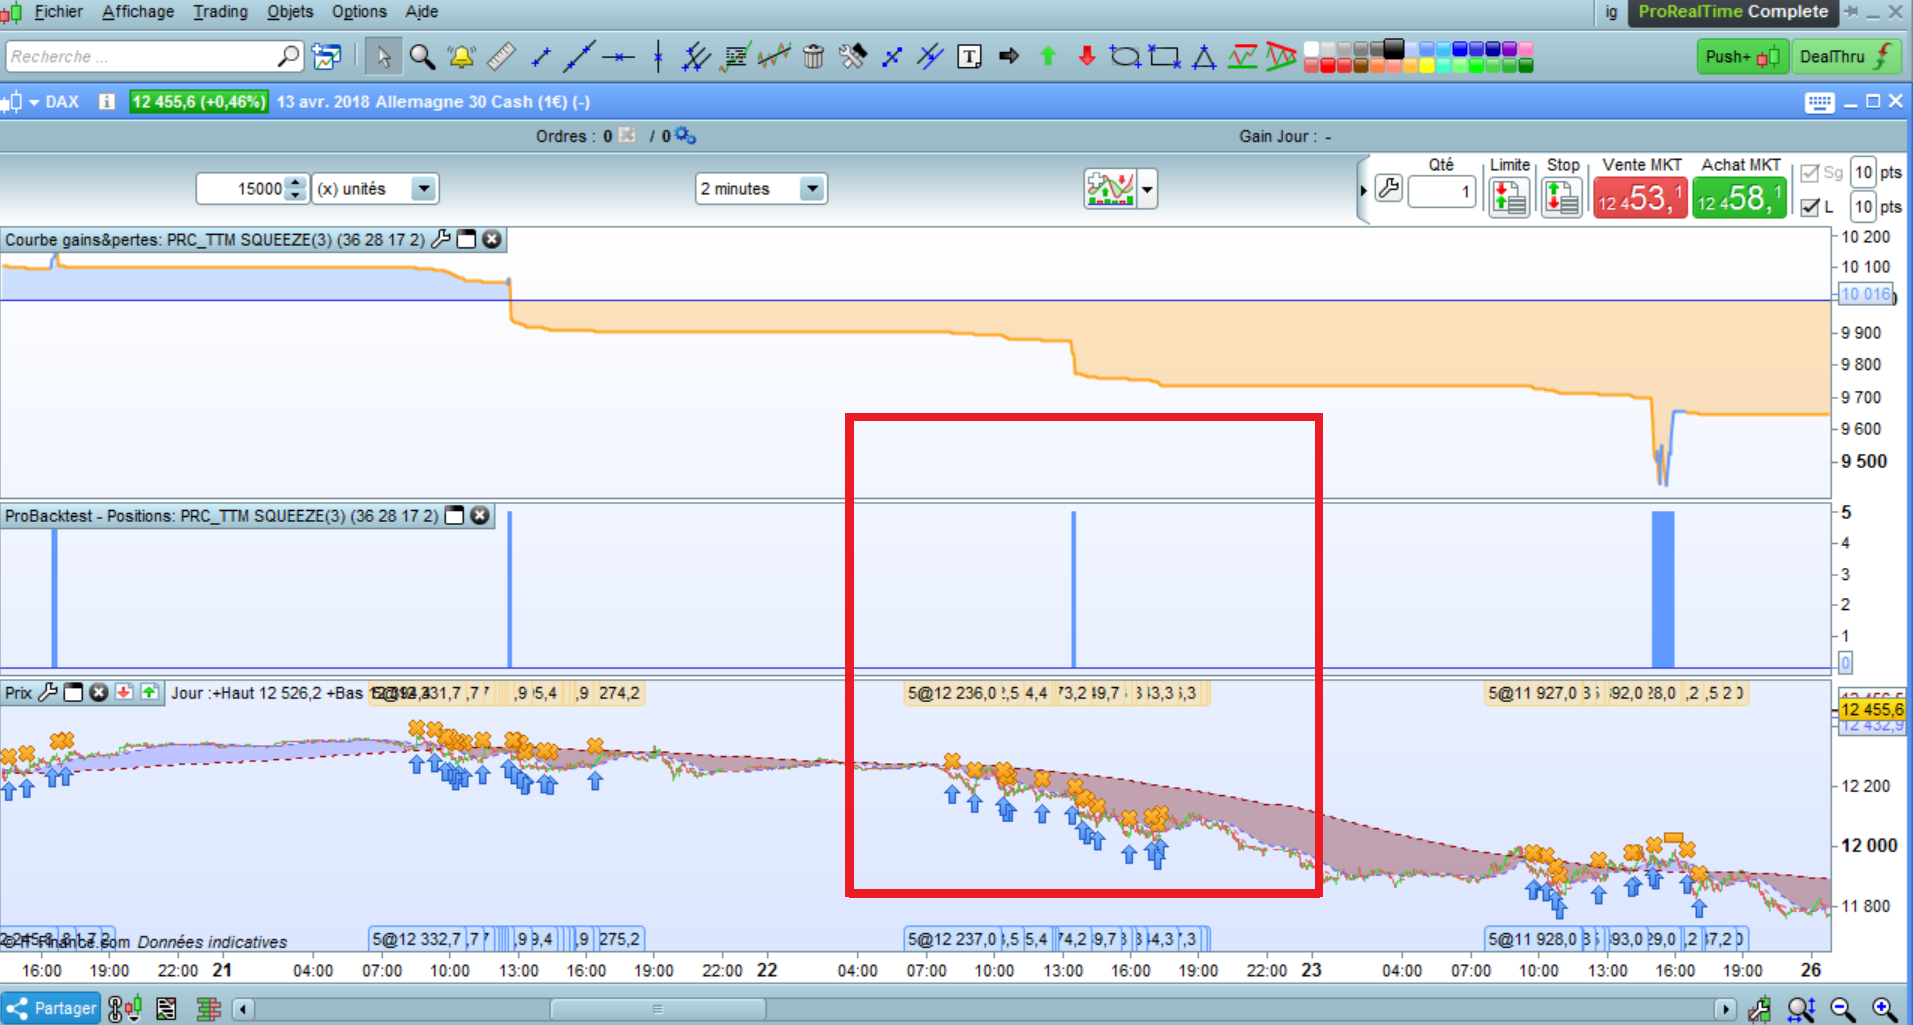
Hi @Eric I didn’t understand what you meant. You think this has to do with opening and closing time of the market ?
But trading time is from 08am to 5pm in the system…
Attached is a clue of what is wrong, the system almost only buys and many trades close on the same candle, but I don’t know why : sl or tp are not touched.
EricParticipant
Master
Hi @Eric I didn’t understand what you meant. You think this has to do with opening and closing time of the market ? But trading time is from 08am to 5pm in the system… Attached is a clue of what is wrong, the system almost only buys and many trades close on the same candle, but I don’t know why : sl or tp are not touched.
i looked at the wrong code
Futures DAX and CFD are 2 different instrument. Your system may be overfit for Future (the one you develop the system for) or maybe it is a parametric thing that cause the trouble, pointsize .. trading hours ..
pointsize and trading hours, have the same settings…
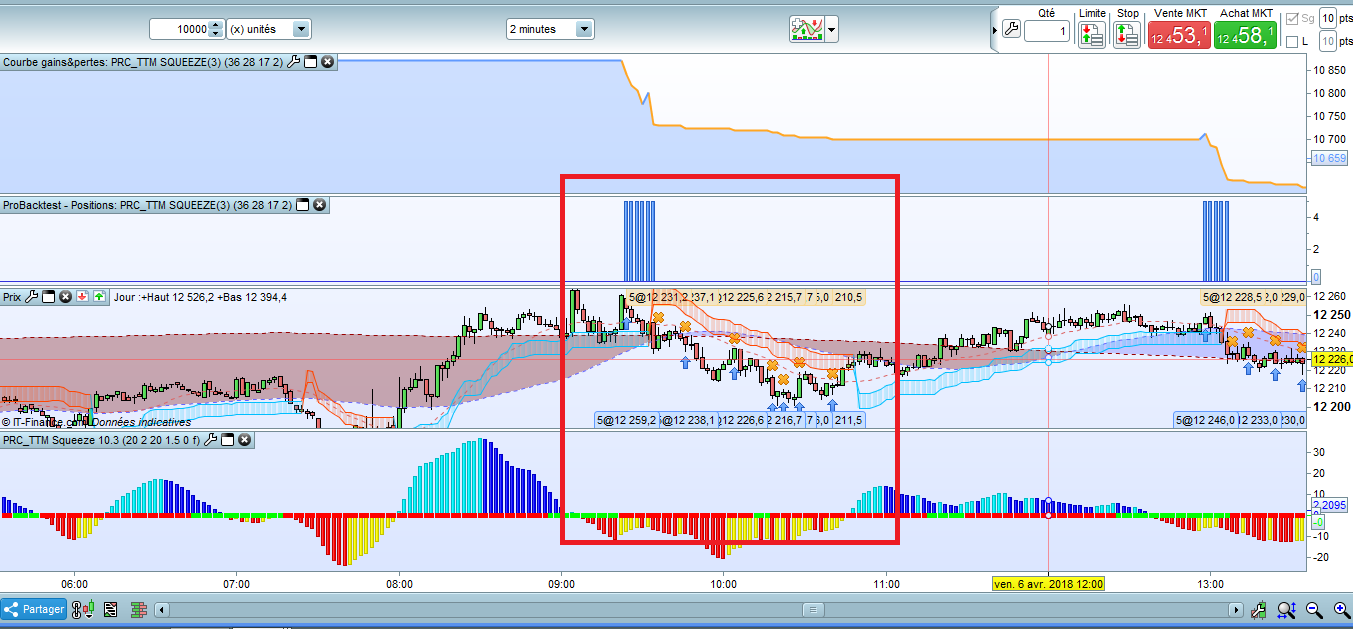
The system doesn’t work like it should, I don’t know why, see proof attached (shouldn’t buy with red supertrend…)
I will review the code all over again.
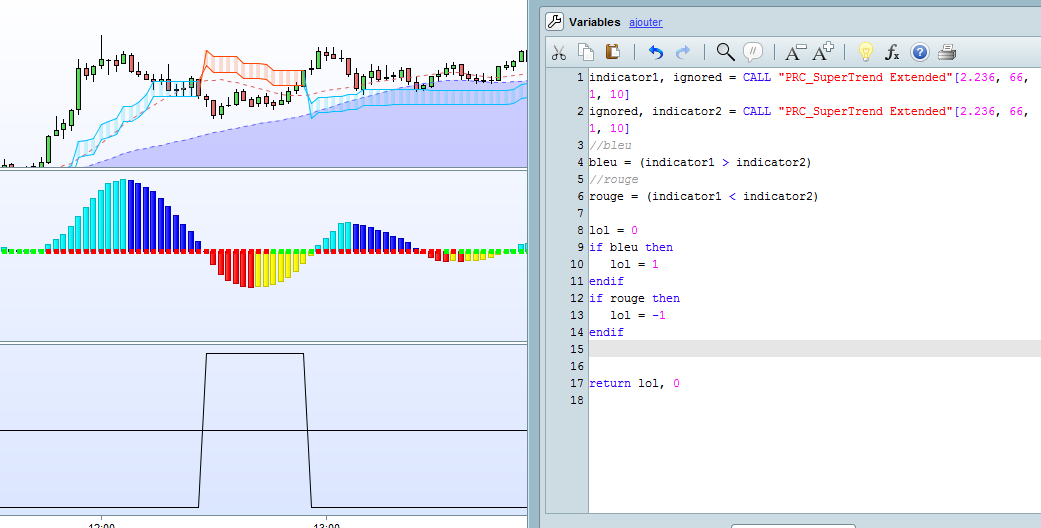
Okay, I started testing the conditions. I use supertrend extended as a filter, so I made an indicator to test which direction it was going, -1 for red and + 1 for blue and it’s inverted !
I think this could be helpfull to those who import itf files with “called indicators” in it : the variables indicator1 and 2 switched, god knows why…
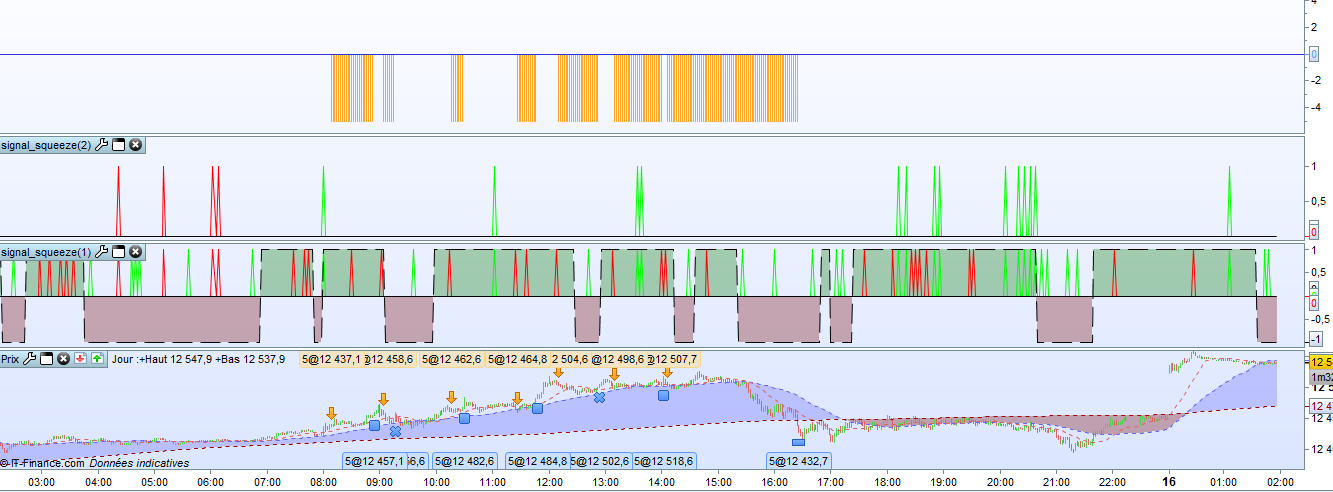
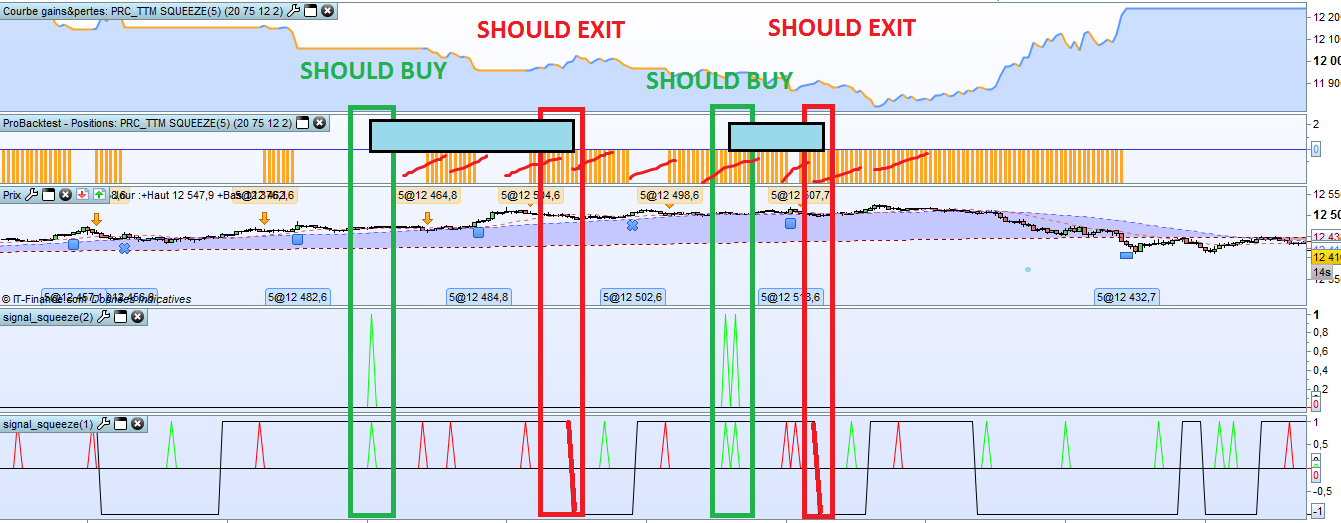
So ! I rewrote the code to make the conditions work and each one is tested in an indicator (see attached).
signal_squeeze1 :
- negative surface for down supertrend and positive surface for up supertrend
- red spikes for short signals and green spikes for long signals
signal_squeeze2 :
- red spikes for short signals AND down supertrend
- green spikes for long signals AND up supertrend
signal_squeeze2 is used by the system to enter a position, and supertrend to exit (plus money management). But it’s not the case as you can see.
Soooooooo, now that I narrowed down the problem, i’m deducing that the only part of the code which could be the problem is the part below, where the system buys and sells, Elementary my dear Watson !
//signal1 : buy signal
//signal2 : sell signal
//lol[1] = -1 : down supertrend
//lol[1] = 1 : up supertrend

if signal2 then
IF LONGONMARKET THEN
SELL AT MARKET
SELLSHORT 5 SHARES AT MARKET
ELSE
SELLSHORT 5 SHARES AT MARKET
ENDIF
ENDIF

if signal1 then
IF SHORTONMARKET THEN
EXITSHORT AT MARKET
BUY 5 SHARES AT MARKET
ELSE
BUY 5 SHARES AT MARKET
ENDIF
ENDIF


IF LONGONMARKET and lol[1]=-1 THEN
SELL AT MARKET
ENDIF

IF SHORTONMARKET and lol[1]=1 THEN
EXITSHORT AT MARKET
ENDIF
I finally found the problem and I’m really having fun doing this, but now i’m stuck, and this has been already for a few hours, could someone help please ?
chears !
PS : the entire code is also attached if needed
I finally found the problem, but now i’m stuck,
What are you stuck on?
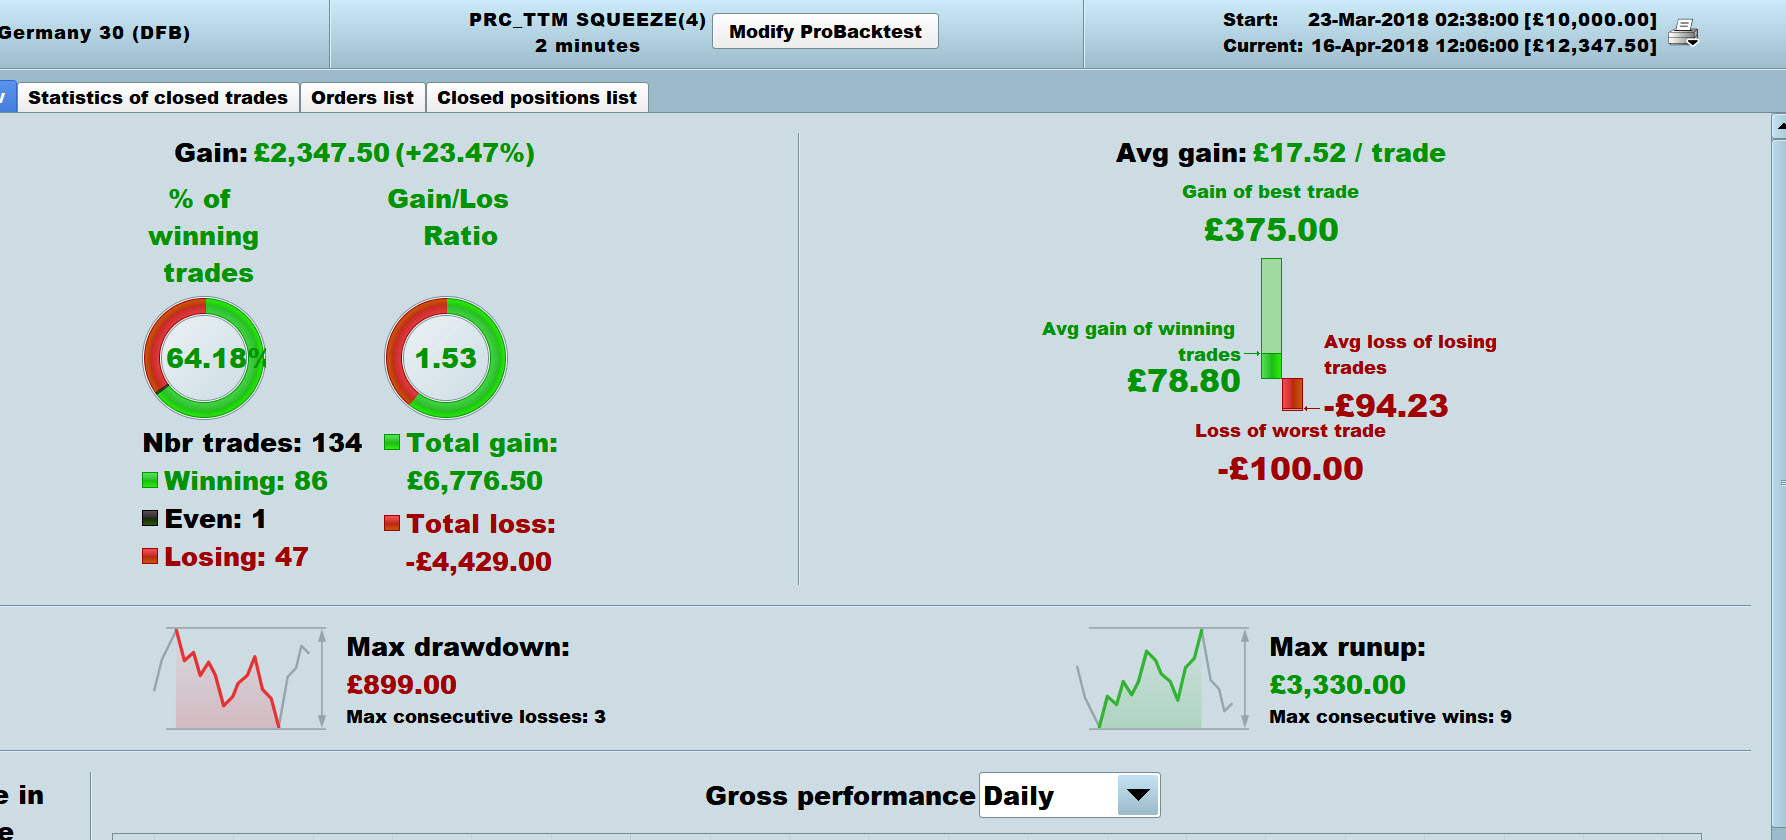
I’ve run your code and made a few trial changes, but – as I can’t see results and / or an equity curve for your PRC_TTM-SQUEEZE4.itf – I can’t tell if I am improving or not?
Please post your results and equity curve for PRC_TTM-SQUEEZE4.itf
Thanks
GraHal
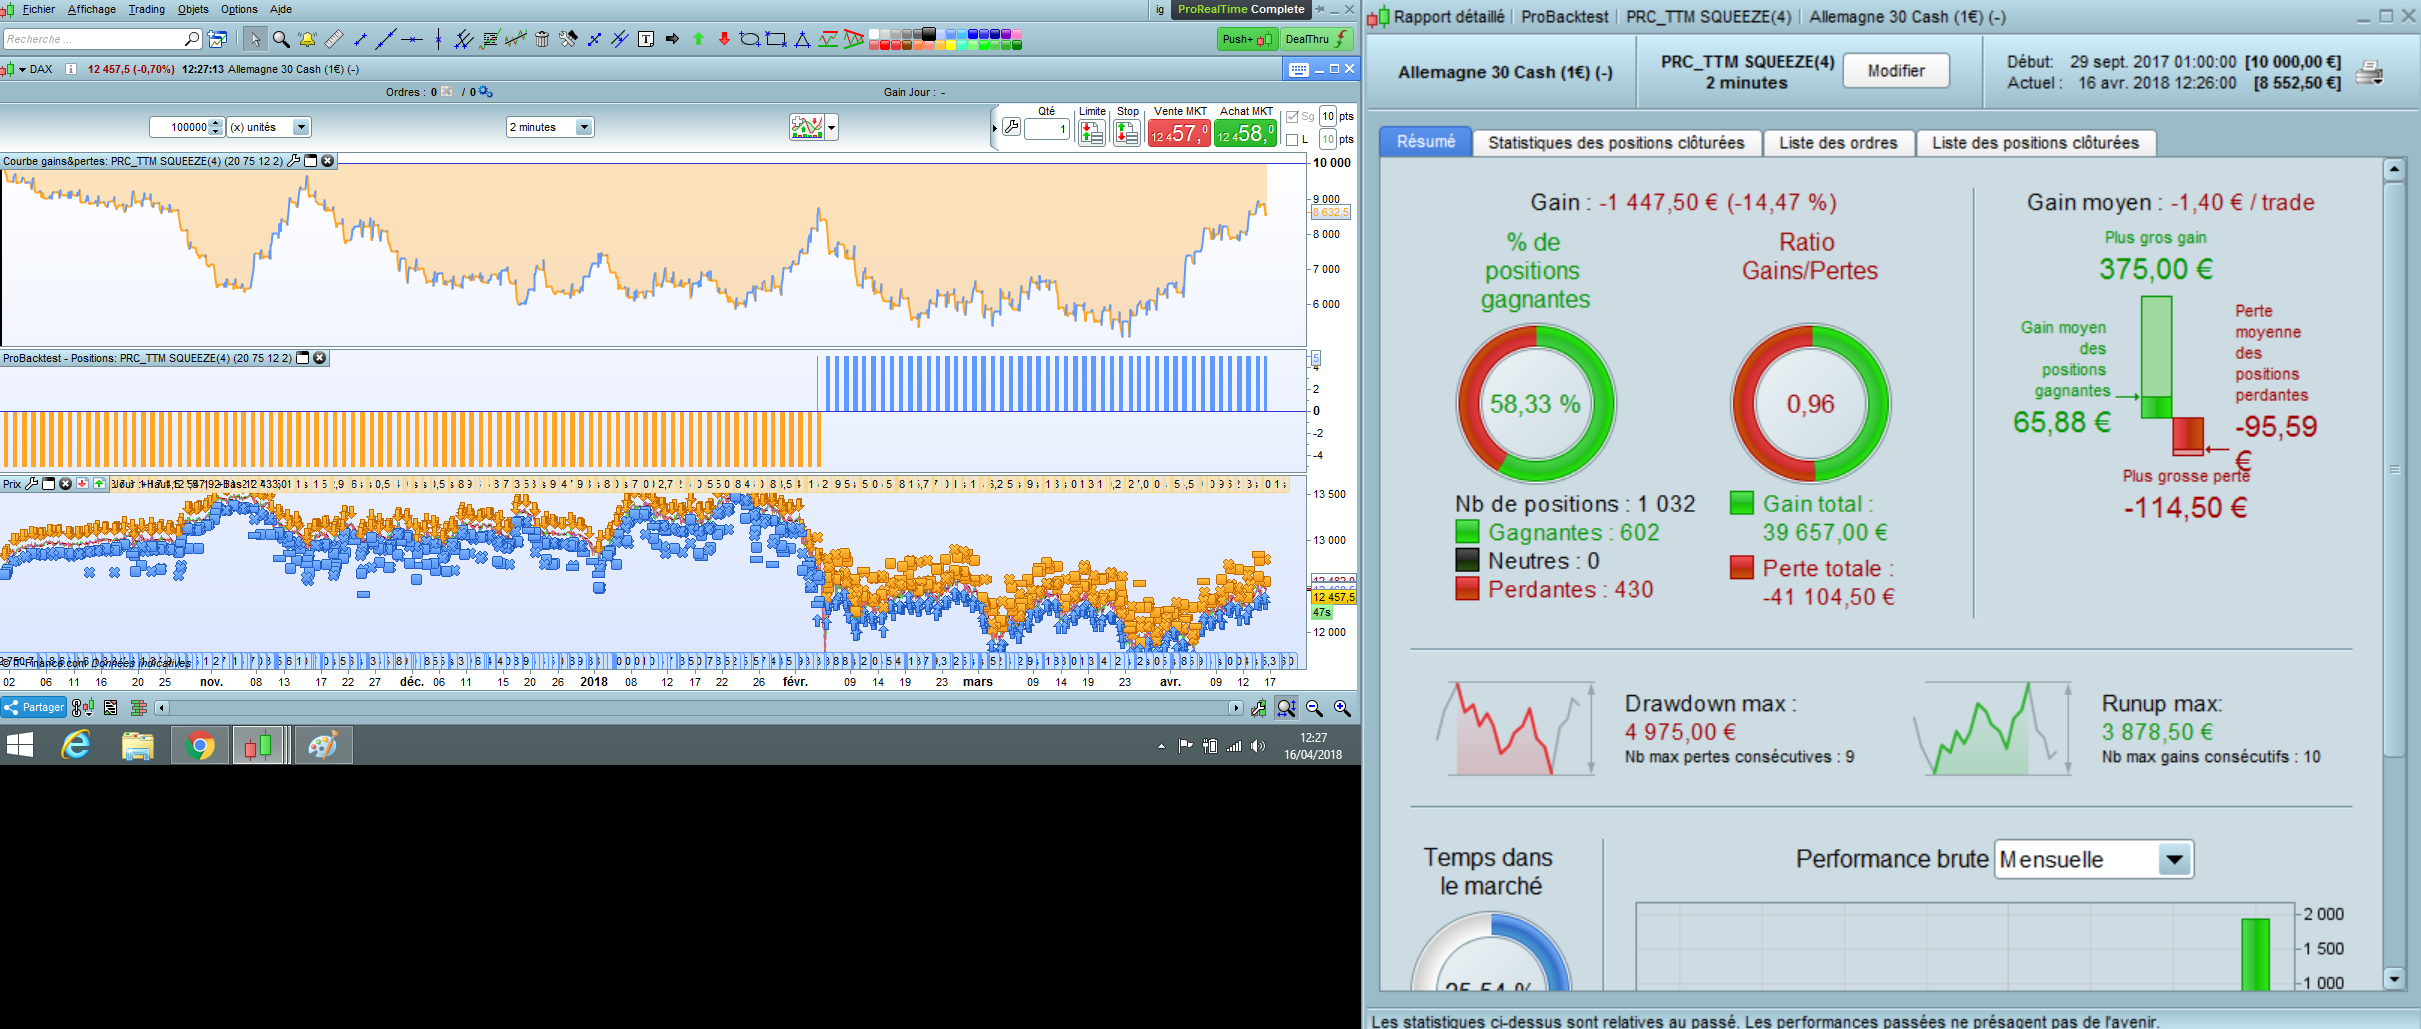
Hi ! attached is the result, the problem is between line 56 and 80 of the code.
You need supertrend extended indicator to run this code, i attached it also, this may be why you don’t get results.
I must already have the Indicator (Platform tells you if not).
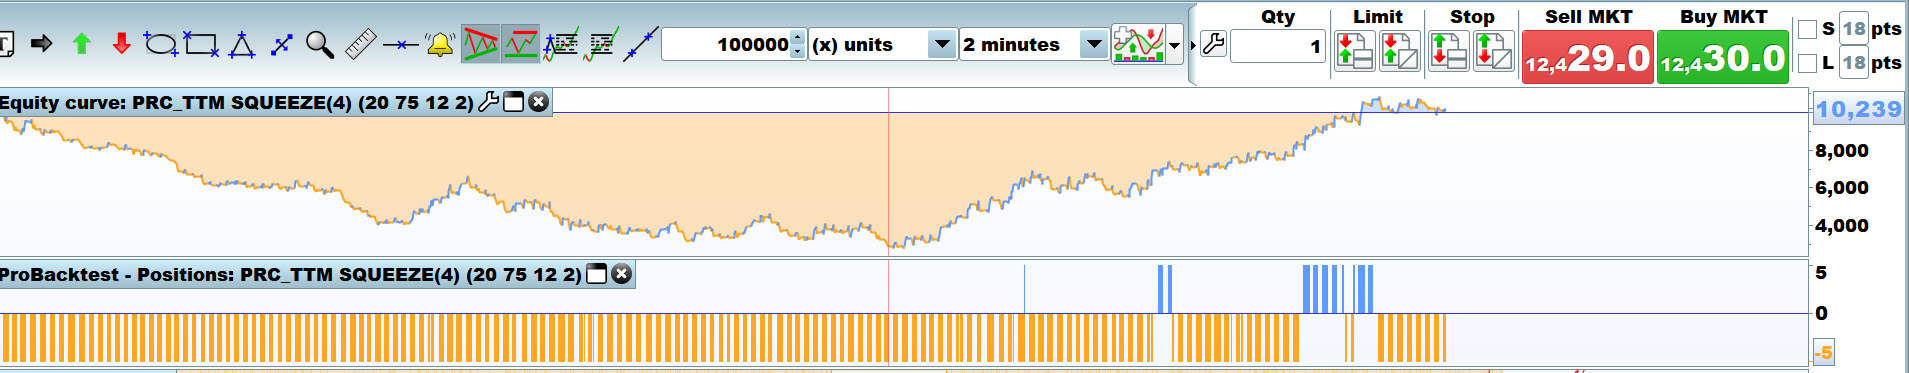
Attached results (over 10k bars only ) with Code line 56 and 80 as below … which I had already changed prior to you saying above … I must be getting better at this coding lark!!! 🙂 🙂
PS I think I only changed the first 8 lines as shown below?
PPS You get a good increase on your curve at the end … so are my changes making much difference at all??
I may have patted myself on the back too soon?? 🙂
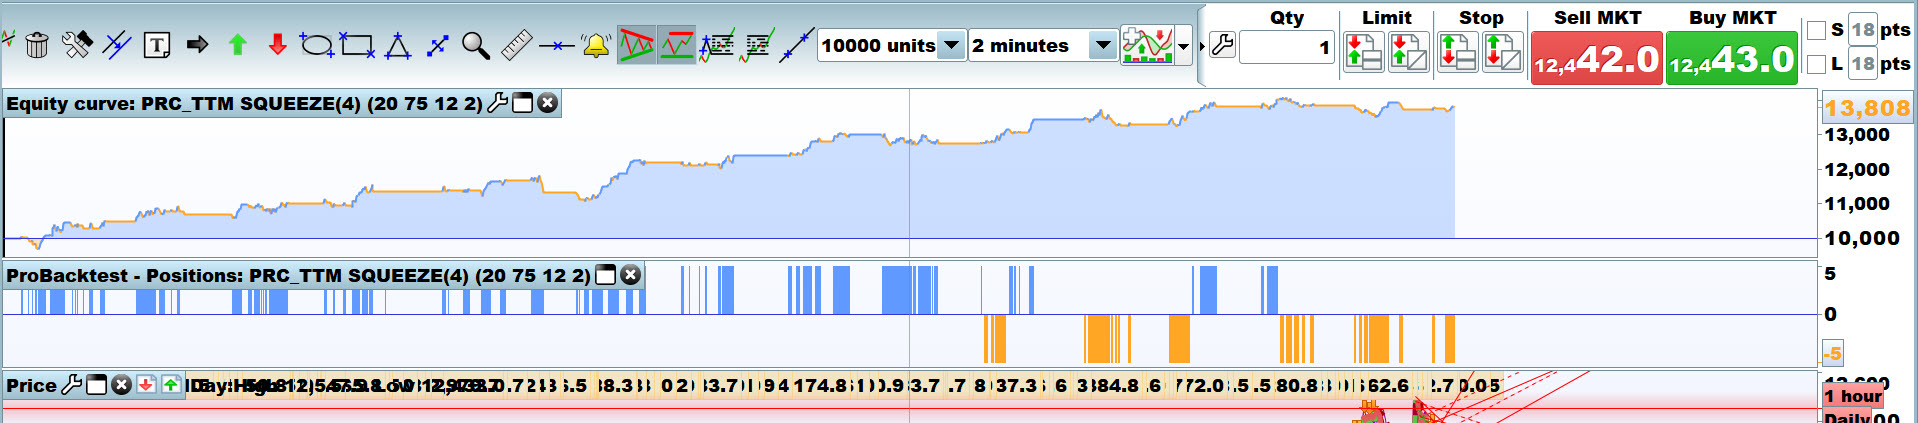
Attached is mine over 100k bars … different but mot much better, but my code changes may spark more ideas in you??
if signal2 then
SellShort 5 SHARES AT MARKET
ENDIF


if signal1 then
Buy 5 SHARES AT MARKET
ENDIF


IF LONGONMARKET and lol[1]=-1 THEN
SELL AT MARKET
ENDIF

IF SHORTONMARKET and lol[1]=1 THEN
EXITSHORT AT MARKET
ENDIF

StopdistanceBreakeven = c
NormalStop = sl

nb = barindex - max(1,tradeindex)
minprice = lowest[nb + 1](Low)
maxprice = highest[nb + 1](High)
Thank you Grahal, but i’m loosing my cool on this one. The system doesn’t behave like it should, see attached. It only take the “sells signal” which is not even filtered. I don’t get it.