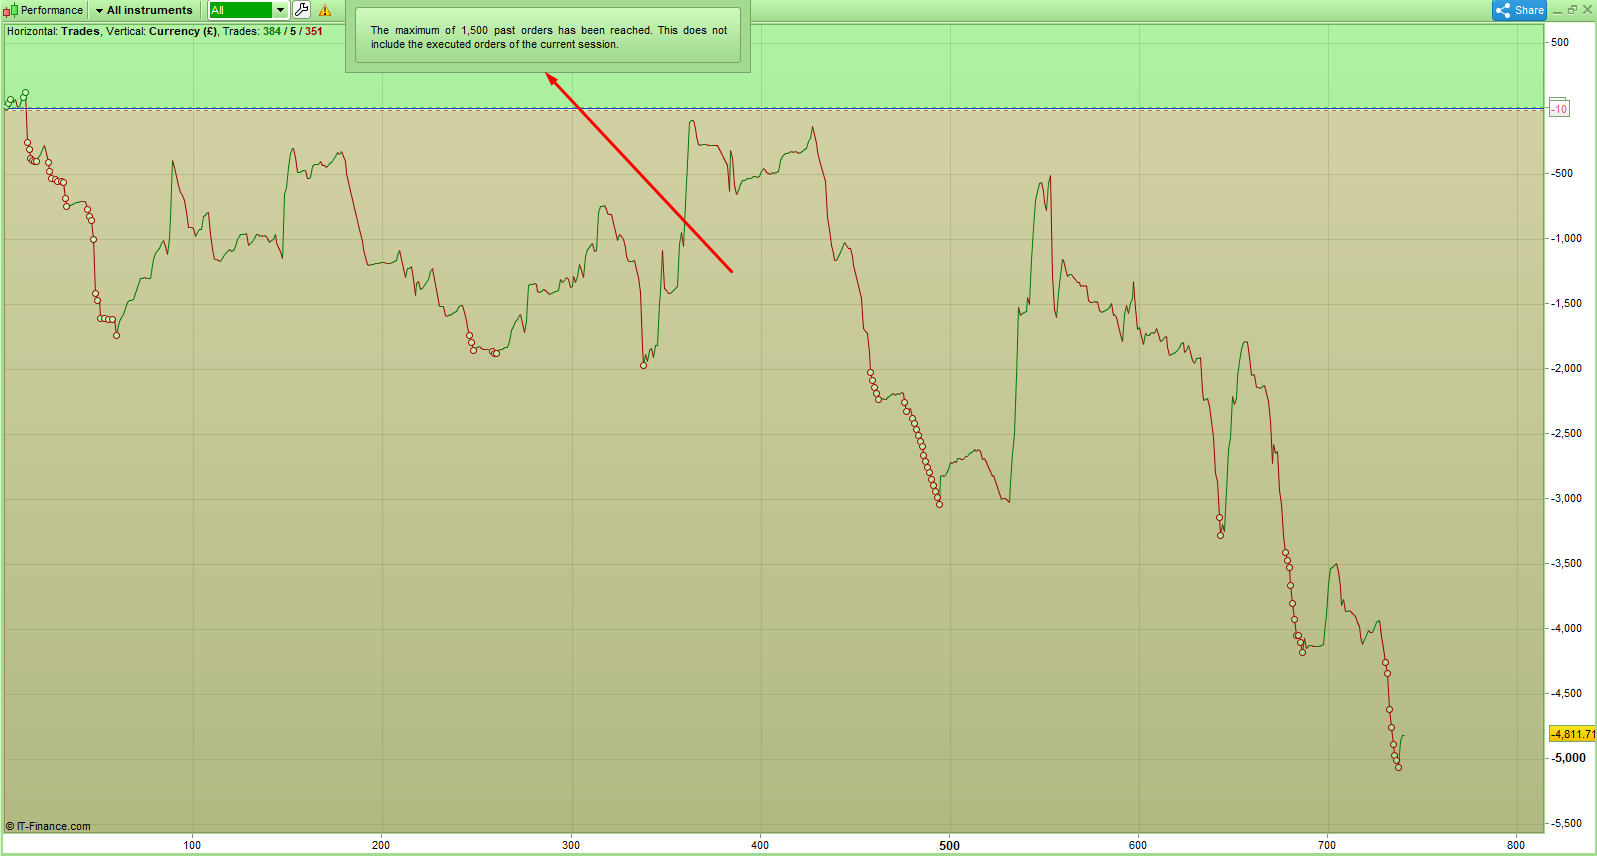
I just noticed a warning triangle on my demo account trade history graph so I hovered over it. It says that the maximum of 1500 orders has been reached.
Does this mean that it is no longer updating or is it updating and trades at the beginning will be dropped from the graph. When I reduce the graph down to just the last week it still appears the same for the last trades plotted.
Please ignore the appalling equity curve – I have been testing rather too many failed strategies recently!
[attachment file=67205]
Strangely today the warning triangle was not showing. I then clicked on a different time period and suddenly it appeared. My equity chart has been updated with recent trades and nothing seems to have fallen off the start of the graph so I do not understand what this warning is for.
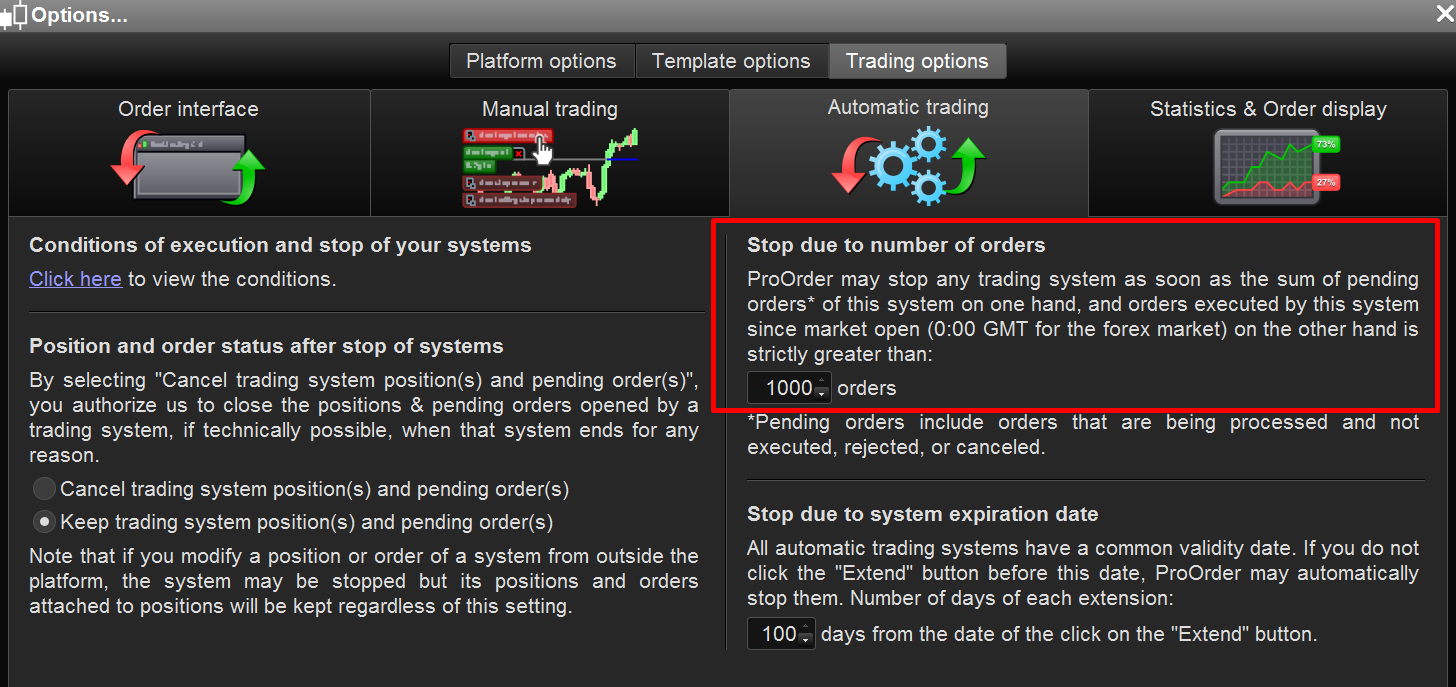
Related to maximum orders allowed per day?
Related to maximum orders allowed per day?
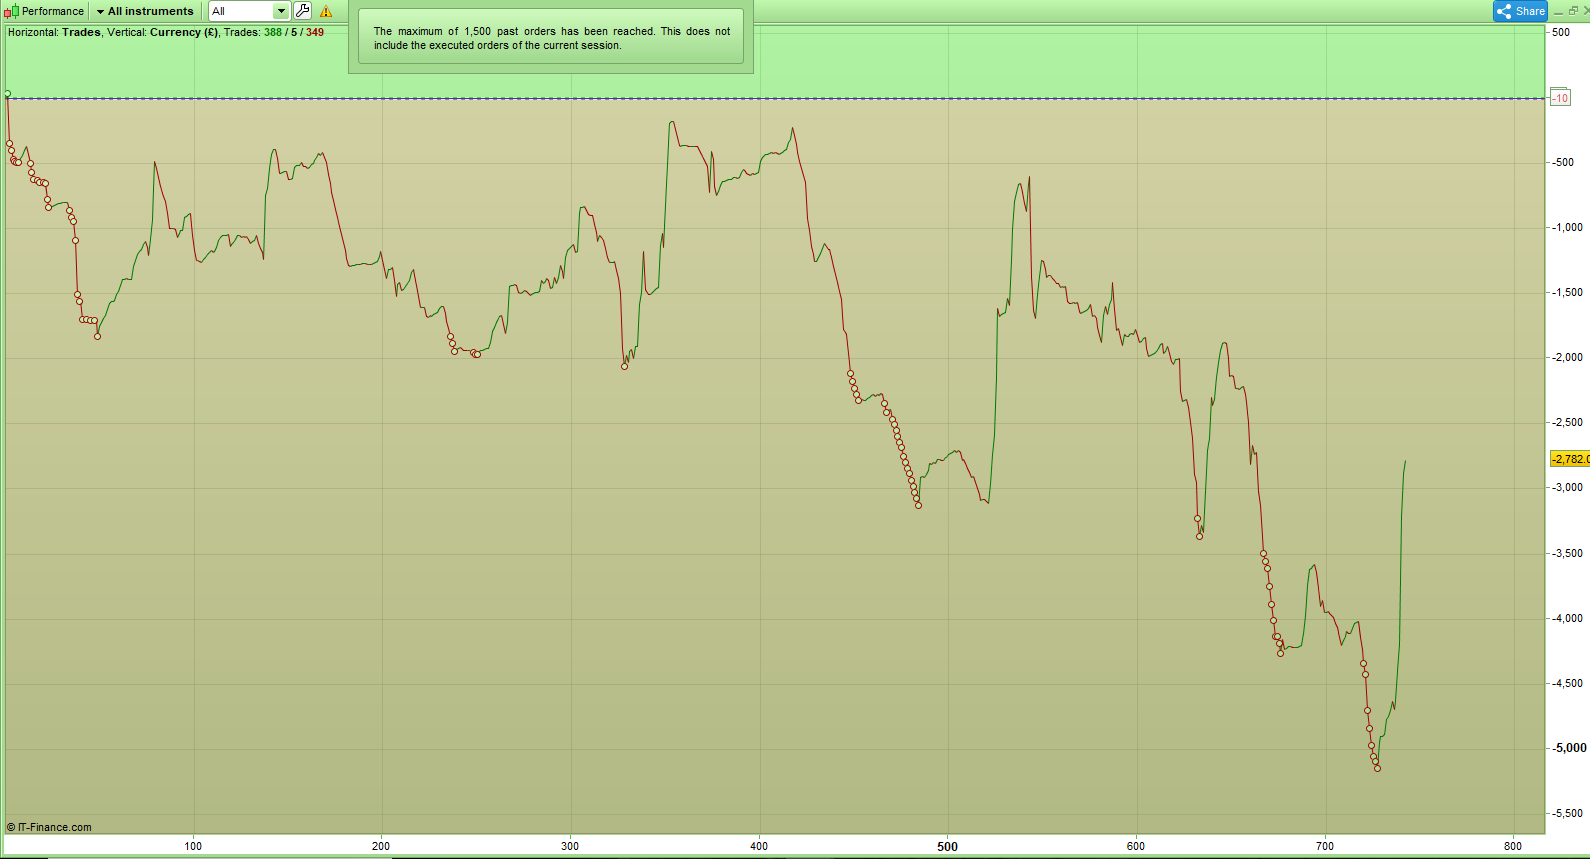
No I do not think that is related to this. The graph shown is the trade history/equity of all the strategy trades/manual trades that have been placed since the account was opened. I just don’t understand why the warning is there as it does not seem to have any effect on the displayed results. Here is today’s screenshot of the ‘Performance’ window and it can be seen that the new trades have been plotted.
[attachment file=67456]
The figures at the top show that 742 trades have been closed which I guess is 1484 past orders – so not even the 1500 that it says. I am wondering if it is warning me that today’s trades are not being added to the plot until I close the platform and re-open it. I will test that theory.
I am wondering if it is warning me that today’s trades are not being added to the plot until I close the platform and re-open it. I will test that theory.
Nope – it is not that. I closed the platform and re-opened it and the graph and equity level were exactly the same and I know that trades have definitely closed while the platform was open today.
Hi – Its definitely counts the last 1500 orders PER INSTRUMENT on a rolling basis for the display ie the trades from the beginning will drop off as soon as the limit gets crossed. But, I have noticed that the count itself sometimes is arbitrary and not quite exact – it could be “around” 1500. In your case quite rightly it should display all trades as its only been 1484 in total but in my case its restricted to exactly 1502 if I add up the 3 different trade totals on the graph x2. If the 1500 count is hit then the starting date range defaults to the date of the first trade of 1500 and you will not be able to zoom out further for that instrument, but you can zoom in.
I use this screen quite frequently and like it esp the trade histograms/trade curve as it allows you to see in essence the “portfolio p&l effect” of holding a diversified bunch of strategies across instruments – which I recommend everyone should try and implement. However the inability to display more than 1500 trades severely lessens its usefulness. It could become a much more powerful tool if they made some simple improvements (eg plotting the different instruments’ P&L on the same graph). I’ve always just excepted this count issue not being consistent as a bug, did raise a ticket about it in the past but to no avail. It’s an annoying restriction especially as you consider that PRT actually holds the entire history of our trade data on it’s server. I know this because if you select a lesser traded instrument/market from the menu at the top then it provides you with trade history going back much more than the “all” date range ie 1 or 2 yrs in my case for that market since it had less than 1500 trades – so the trade data is definitely available. It’s just when you select “all instruments” as the instrument type that the display data becomes more restricted to only the last 1500 trades for your entire account.
Given that the underlying instruments all have much longer history available, it puzzles me why PRT would choose to limit the “All instruments” selection as it’s a simple construction of the sum of its parts.
Hello,
An increase in the number of the last orders displayed in the performance window will be effective within a few months.
Regards,
Carine