PRT Support
Please comment on below to advise your Customers what PRT is doing about correcting this anomaly?
Actually the lack of complete 200k bar history is a known bug in PRT. I’ve raised it a couple of years back with them but it hasn’t been addressed.
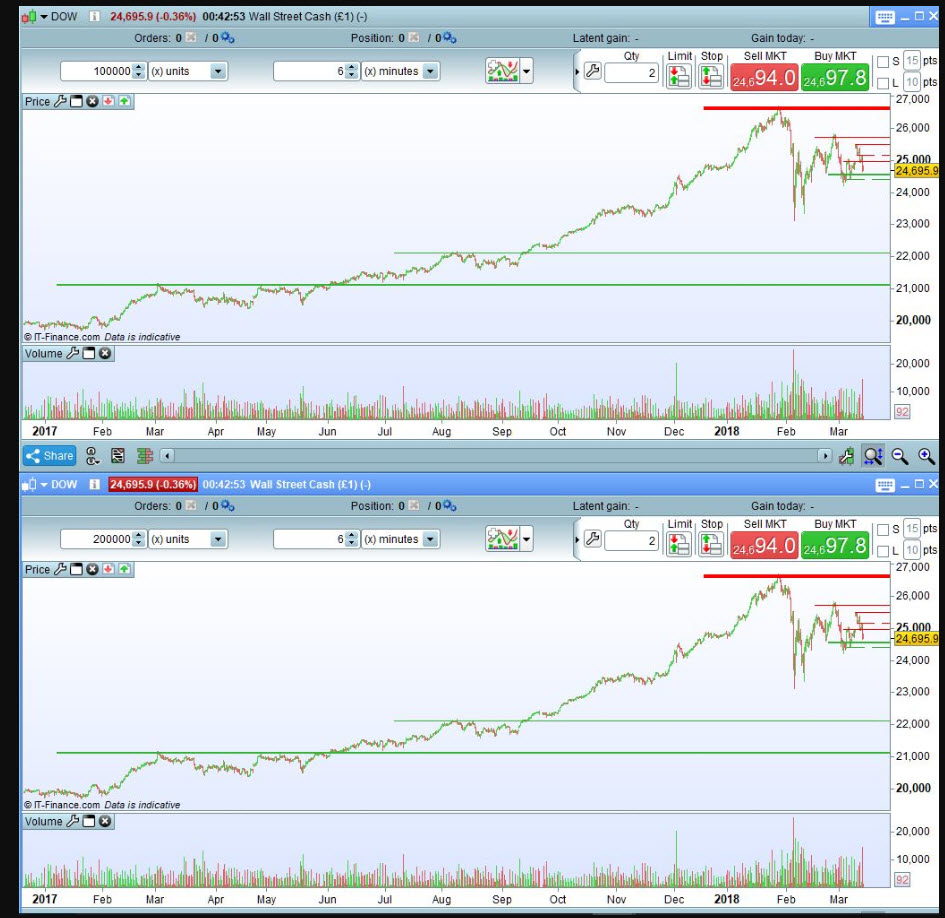
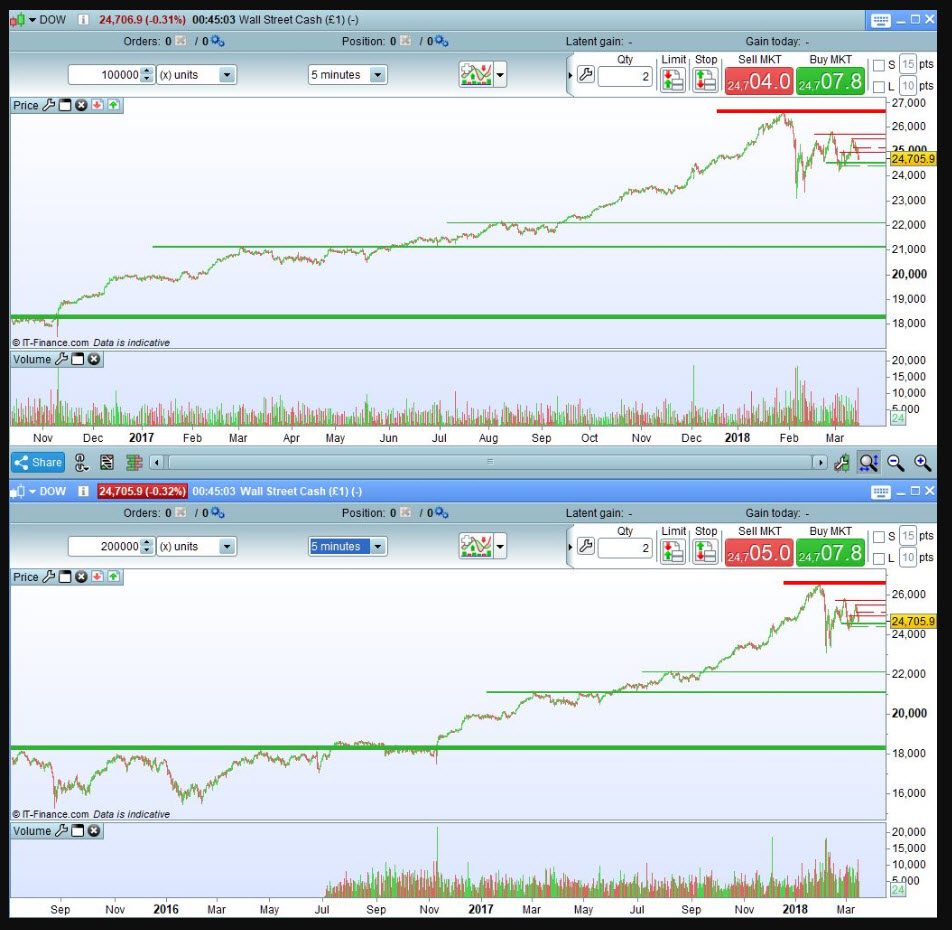
The reason there is no more data on 200k bars than 100k bars above is because of a weird bug in PRT that only calculates the full 200k bars based on “standard” time units ie those that you get on the drop down menu. At least that’s my theory anyway. See attached.
As you see from the first image there is no more data on the 100k chart compared to 200k chart for the 6m TF On the second image there is twice as much data in 200k units for the 5m period as there is for 100k units – as expected (its the same with 10m tf as well)
Also, I don’t think there is any correlation between the units shown in the drop down menu and the actual time scale on the charts. Eg. for the 6m tf – 6m x 200,000 = 1.2m / 60/ 24 = 833 days /365 = 2.28 years ie 2yrs and 3mths approx.
And as you can see from the history we get only around half that. In fact in reality it should be around 15% more history than even that figure due to the fact that Saturday has no units.
This is nonsense. When you show the 6 min chart, you work with 1,2, or 3 minute data which ranges back as far as the 3 minute chart ranges back. When you use the 5 min chart, you get 5 min data, and 200.000 bars on 5 minute bars range farther back than 200.000 bars on 3 min bars. Thats the whole solution, I think.
This is nonsense. When you show the 6 min chart, you work with 1,2, or 3 minute data
Am I misunderstanding, if your chosen TF is 6 mins then you want data that gives a bar every 6 minutes (as that is the period of your variables etc)?
Are you saying it’s nonsense and there is no issue with PRT and 200k bars history on a 6 min Timeframe?
Cheers
GraHal
I haven’t read the whole thread thoroughly so with the risk that I write something that doesn’t fit: I also have PRT Premium but there is not for all assets and timeframes 200K bars data. For example on daily bars you have always less (200K bars would be 700+ years). Then some assets have less data than others. For example for WTI (CL) I have much less data on all timeframes than for other assets. I never saw this as a bug but simply how it is.
Thanks for your wider observation Despair, but the Issue here is that on DAX 5 min TF we can get 200k bars data, but on DAX 6 min TF we cannot get more than 100k bars.
I see. I think this is caused by how it is done by PRT. I think what PRT does to provide more data for the premium version is that they accumulate data from IG. While IG only saves the last 100K bars, PRT extends this history. Depending on how this is done they maybe only do so for the most common candle sizes. Something like 6 min data would require that they archive huge amounts of 1 minute data and consolidate after requirement to the bar size in question. I don’t think it is done this way. But again I might be wrong here completely.
Ah yeah good thinking!
That more or less aligns with what Manel proposed in the Quote in the first post.
It’s crazy when you think … because we are madly interested in PRT and getting it functioning at it’s best (okay, selfish cos we want to make money! 🙂 ) we have to offer each other reasons for and solutions to Issues.
I was hoping the resident PRT Support would have answered this question by now?
This is nonsense. When you show the 6 min chart, you work with 1,2, or 3 minute data
Am I misunderstanding, if your chosen TF is 6 mins then you want data that gives a bar every 6 minutes (as that is the period of your variables etc)? Are you saying it’s nonsense and there is no issue with PRT and 200k bars history on a 6 min Timeframe? Cheers GraHal
A 3 min chart works with 1 minute data. 1 minute data in DAX, for example, ranges back to October 2016. There is no more 1 minute data available from IG. When you load 200.000 bars in a DAX 3 minute chart, you get it back to October 2016. Same with a 6 minute chart : As it uses 1 minute data, you get a chart back to October 2016. On the other hand : Whe you exclude nights in a DAX 1 minute chart, and display only 9-17 h, you will get a 1 minute chart back to October 2016 with 200.000 bars. When you display 24 h, the 1 minute chart only goes back to July 2017, because these are 200.000 1 minute bars. Get it ?
But there is separate data for 5 minute charts that ranges farther back to July 2015 with 200.000 bars (24 hours displayed), which does not use 1 minute data. When you display only 9-17 h in a 1 minute chart, it goes back to October 2013. The same for a 25 minute chart : It uses 5 minute data, and so cannot go back farther back than October 2013, because this is all the 5 minute data there is.
When you display only 9-17 h in a 1 minute chart, it goes back to October 2013.
This should read : When you display only 9-17 h in a 5 minute chart, it goes back to October 2013.
To summarize : A 6 min chart uses 1 minute data to calculate the 6 min bars, as there are no separate 6 minute bars.
A 25 minute chart uses data of 5 minute bars to calculate the 25 min bars.
In both cases, you cannot get longer charts than for the time that is available on the shorter, basic timescale.
The setting “200 000 x units” allows to view the maximum amount of historical data available for the security you are looking at and the chosen time frame. It is therefore possible that for some time units there are less than 200 000 units displayed. As already outlined by @Despair and @verdi55 the 6 minute chart is based indeed on 1 minute data; therefore, the 6 minute chart has less data available than the 5 minute chart (which goes back to July 2015).
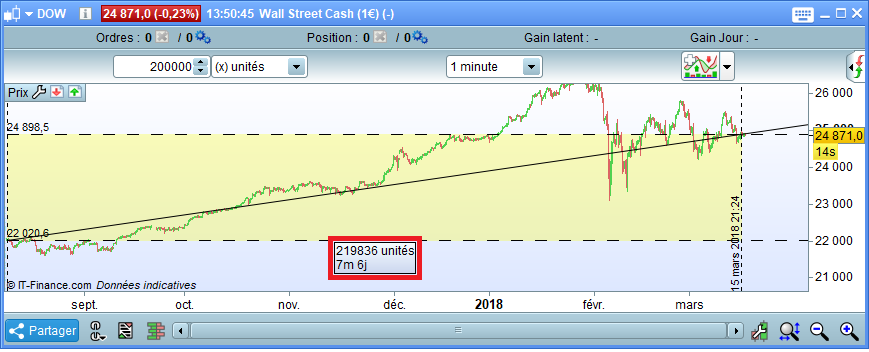
However, some charts show even more than 200 000 units as for example the Dow Jones 1 minute chart.
[attachment file=65424]
Note also that major securities (this concerns especially stocks) will show a higher amount of historical intraday data than less liquid instruments.
Please click on the following link in order to see a comparison concerning the maximum amount of historical data available in the Complete and Premium versions: Premium version benefits
The setting “200 000 x units” allows to view the maximum amount of historical data available for the security you are looking at and the chosen time frame.
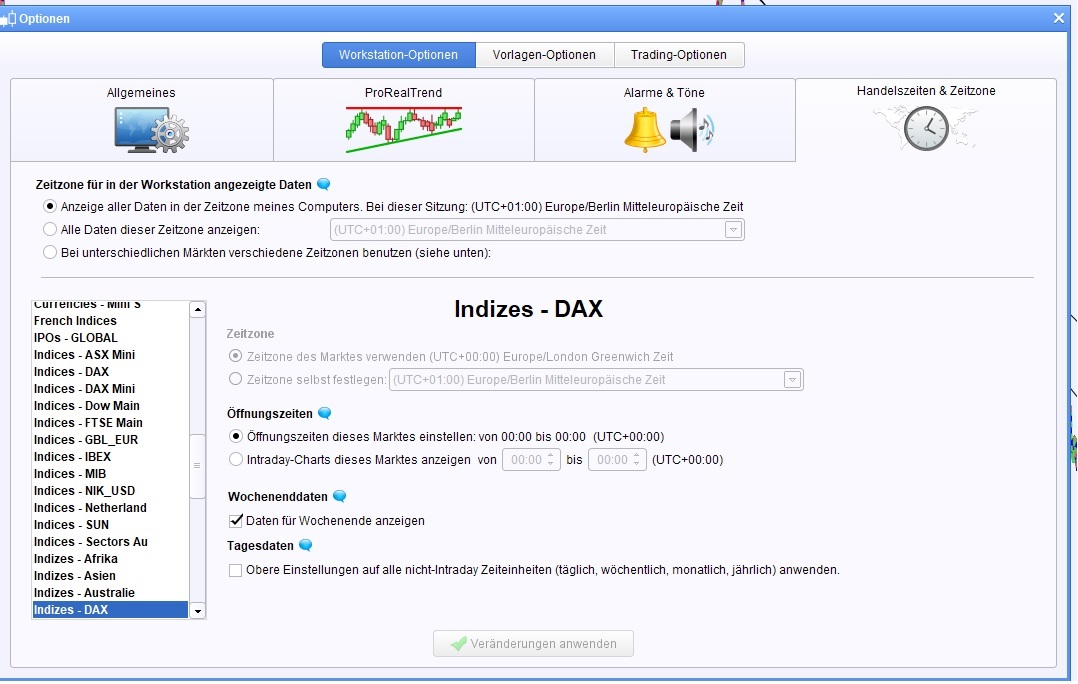
Well, this may depend on the time settings chosen in
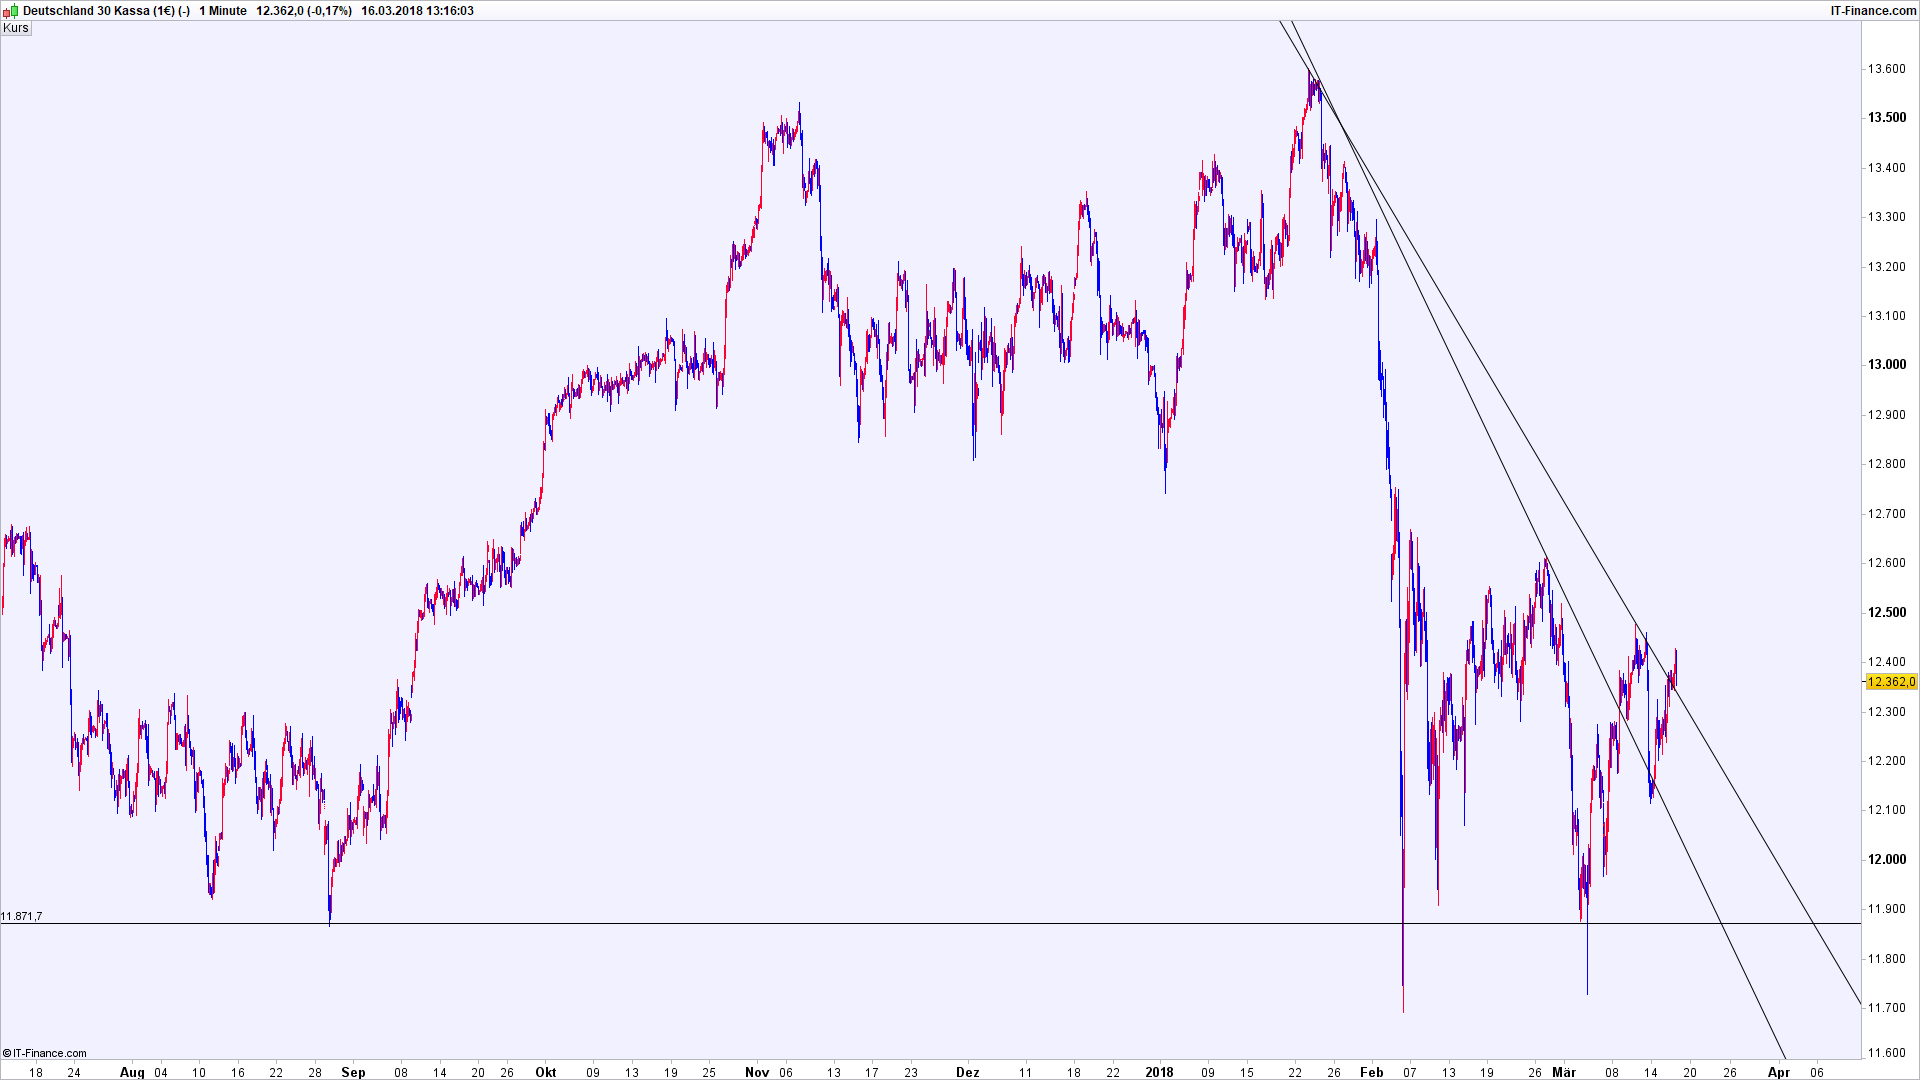
[attachment file=65428]
As I said, when you select 0-24 h displayed in a DAX 1 minute chart, you get data back to July 2017, which is not all the 1 minute data available, but about 200.400 bars :
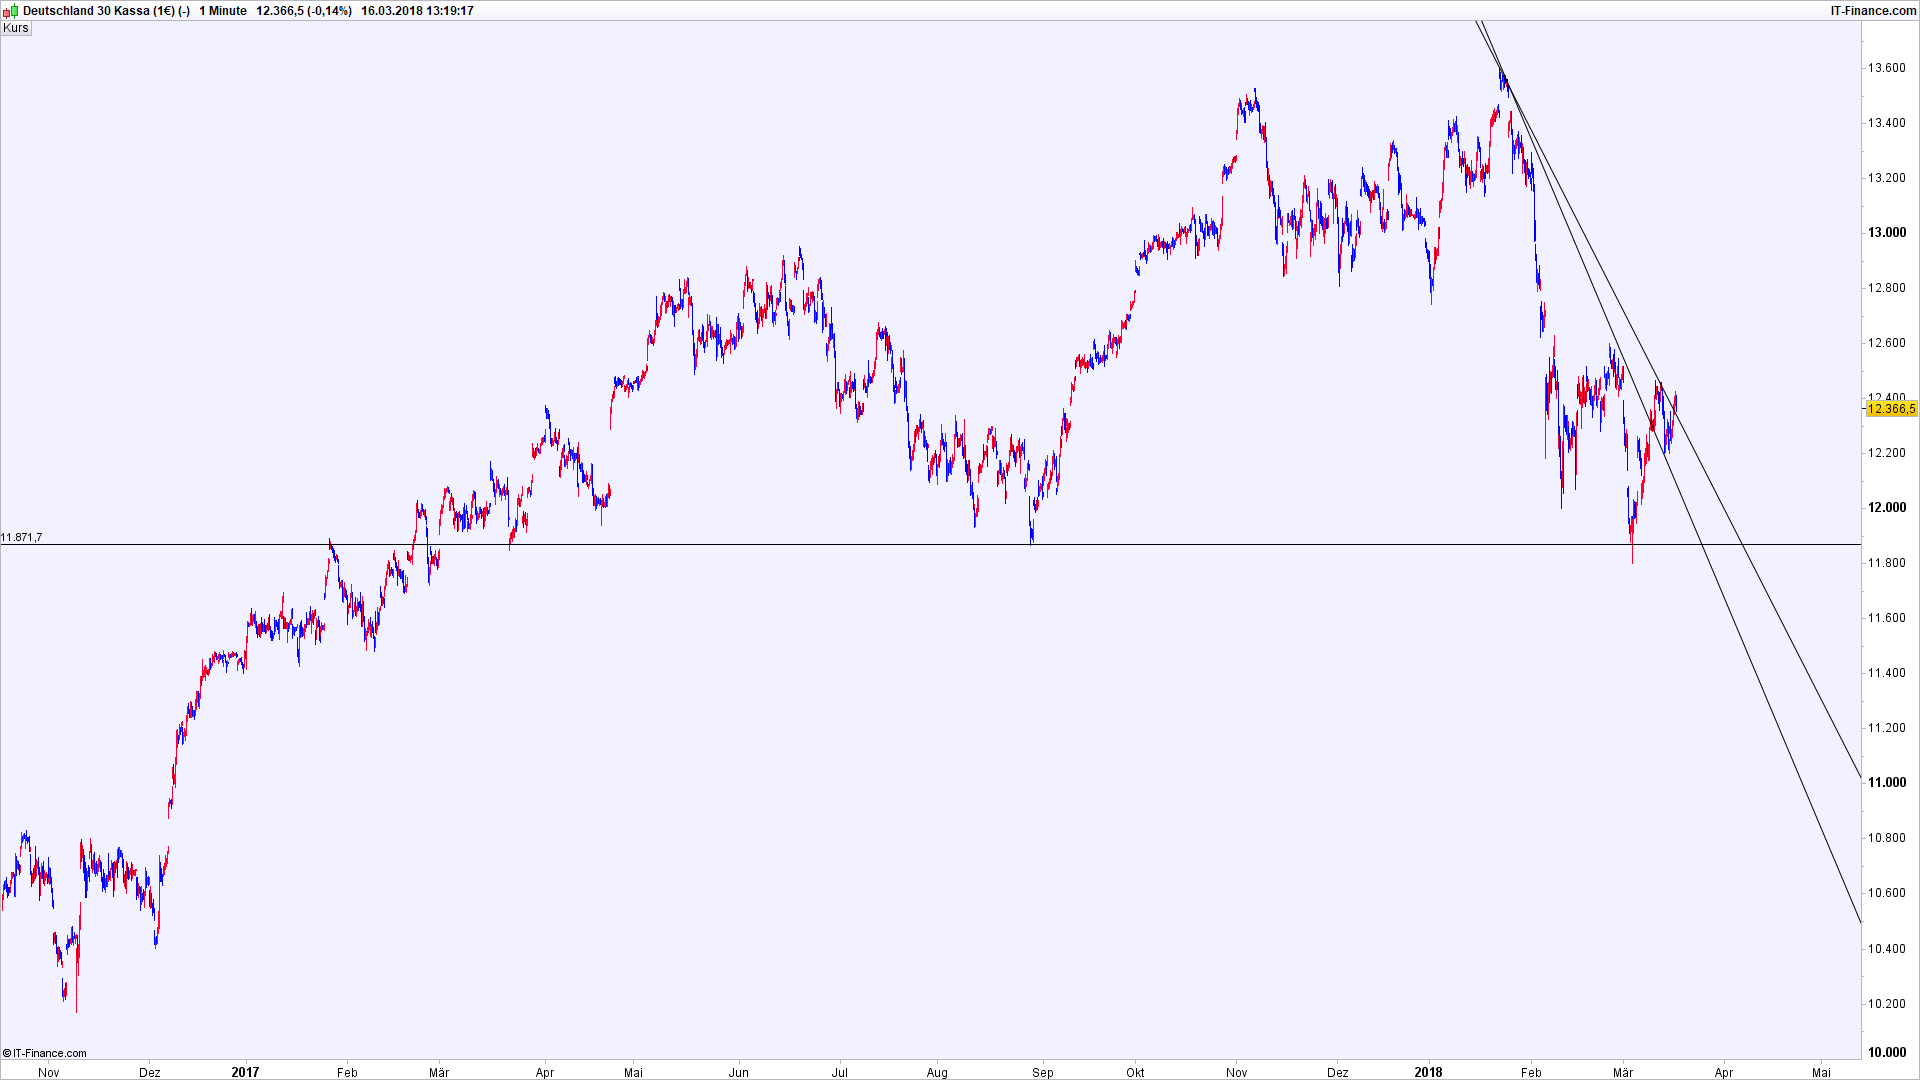
[attachment file=65429]
DAX 1 minute data is available back to October 2016, which you can see when you display only trading hours from 9-17 h local time (8-16 UTC). You then get a 1 minute chart back to October 2016, which is equivalent to 172.500 bars:
[attachment file=65430]
@verdi55
Thank you for these additional images !