DEIO
DEIOParticipant
Veteran
HI,
Here an idea to use MFI that I consider very interesting.
The strategy (ONLY LONG) waits for a cross of a MFI fast and slow.
Moreover the average must always go up in the last period.
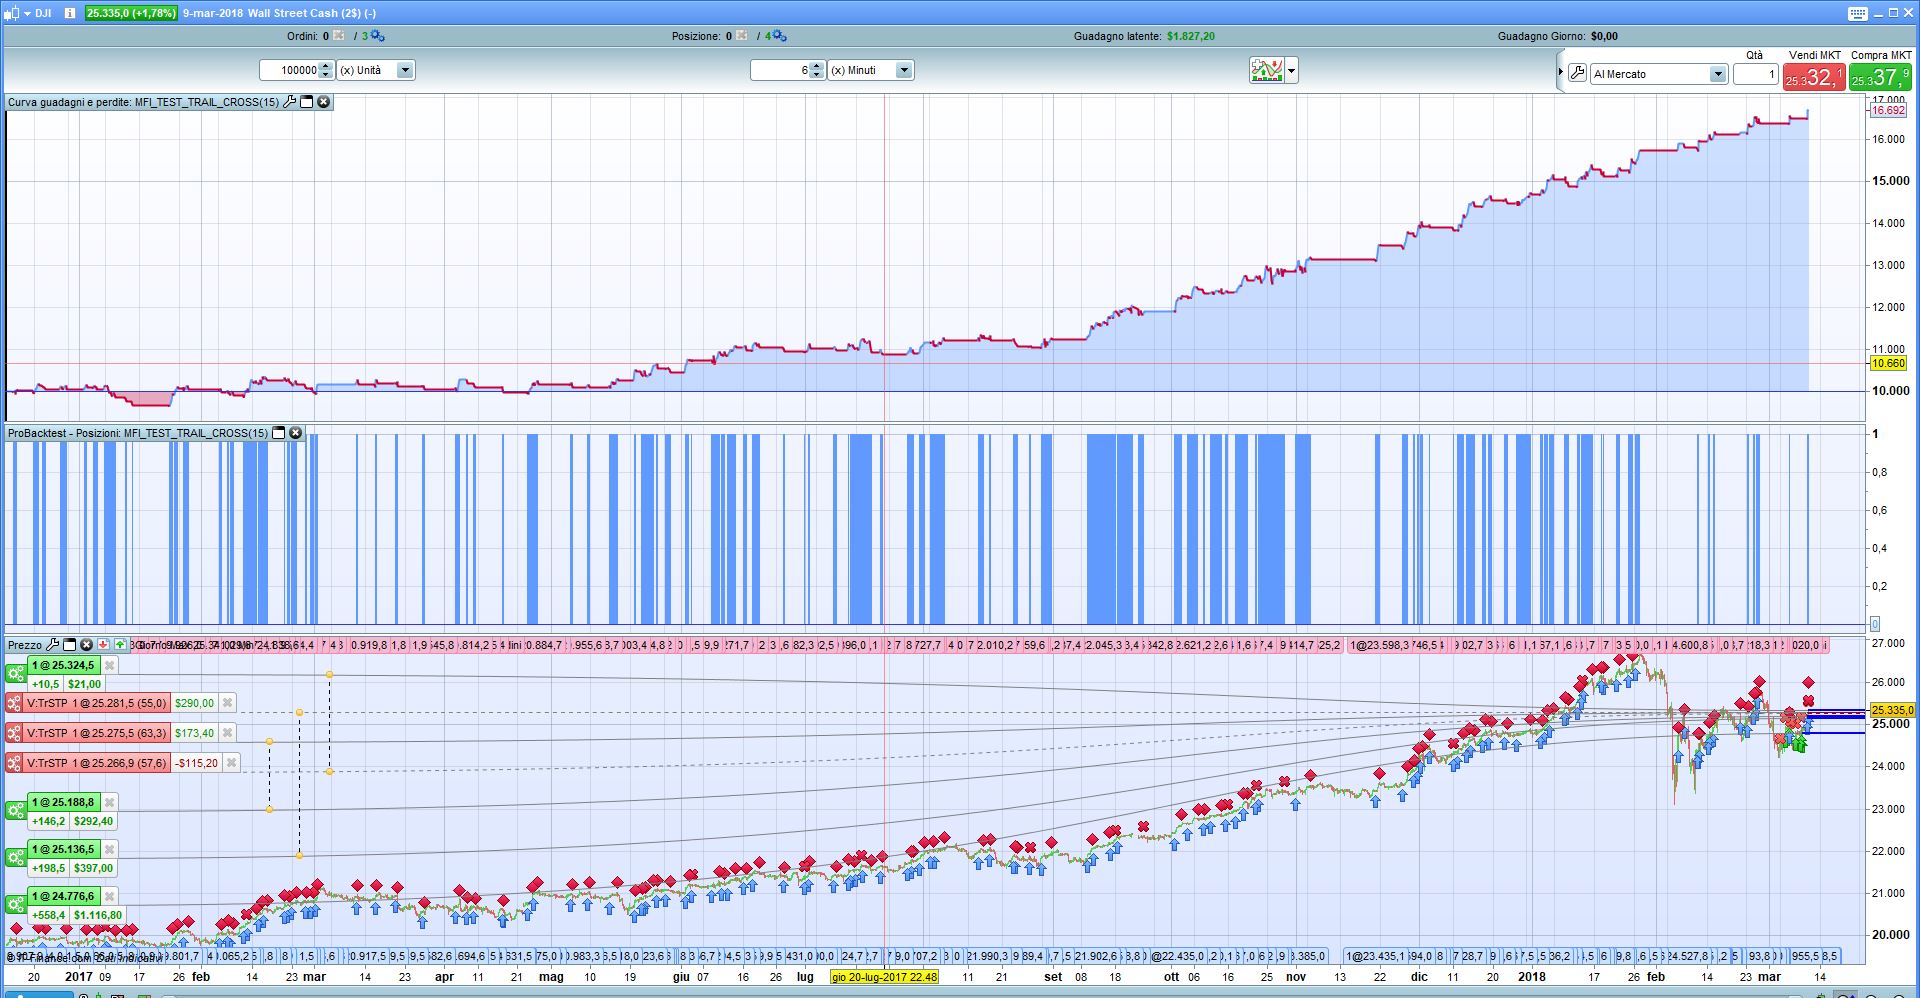
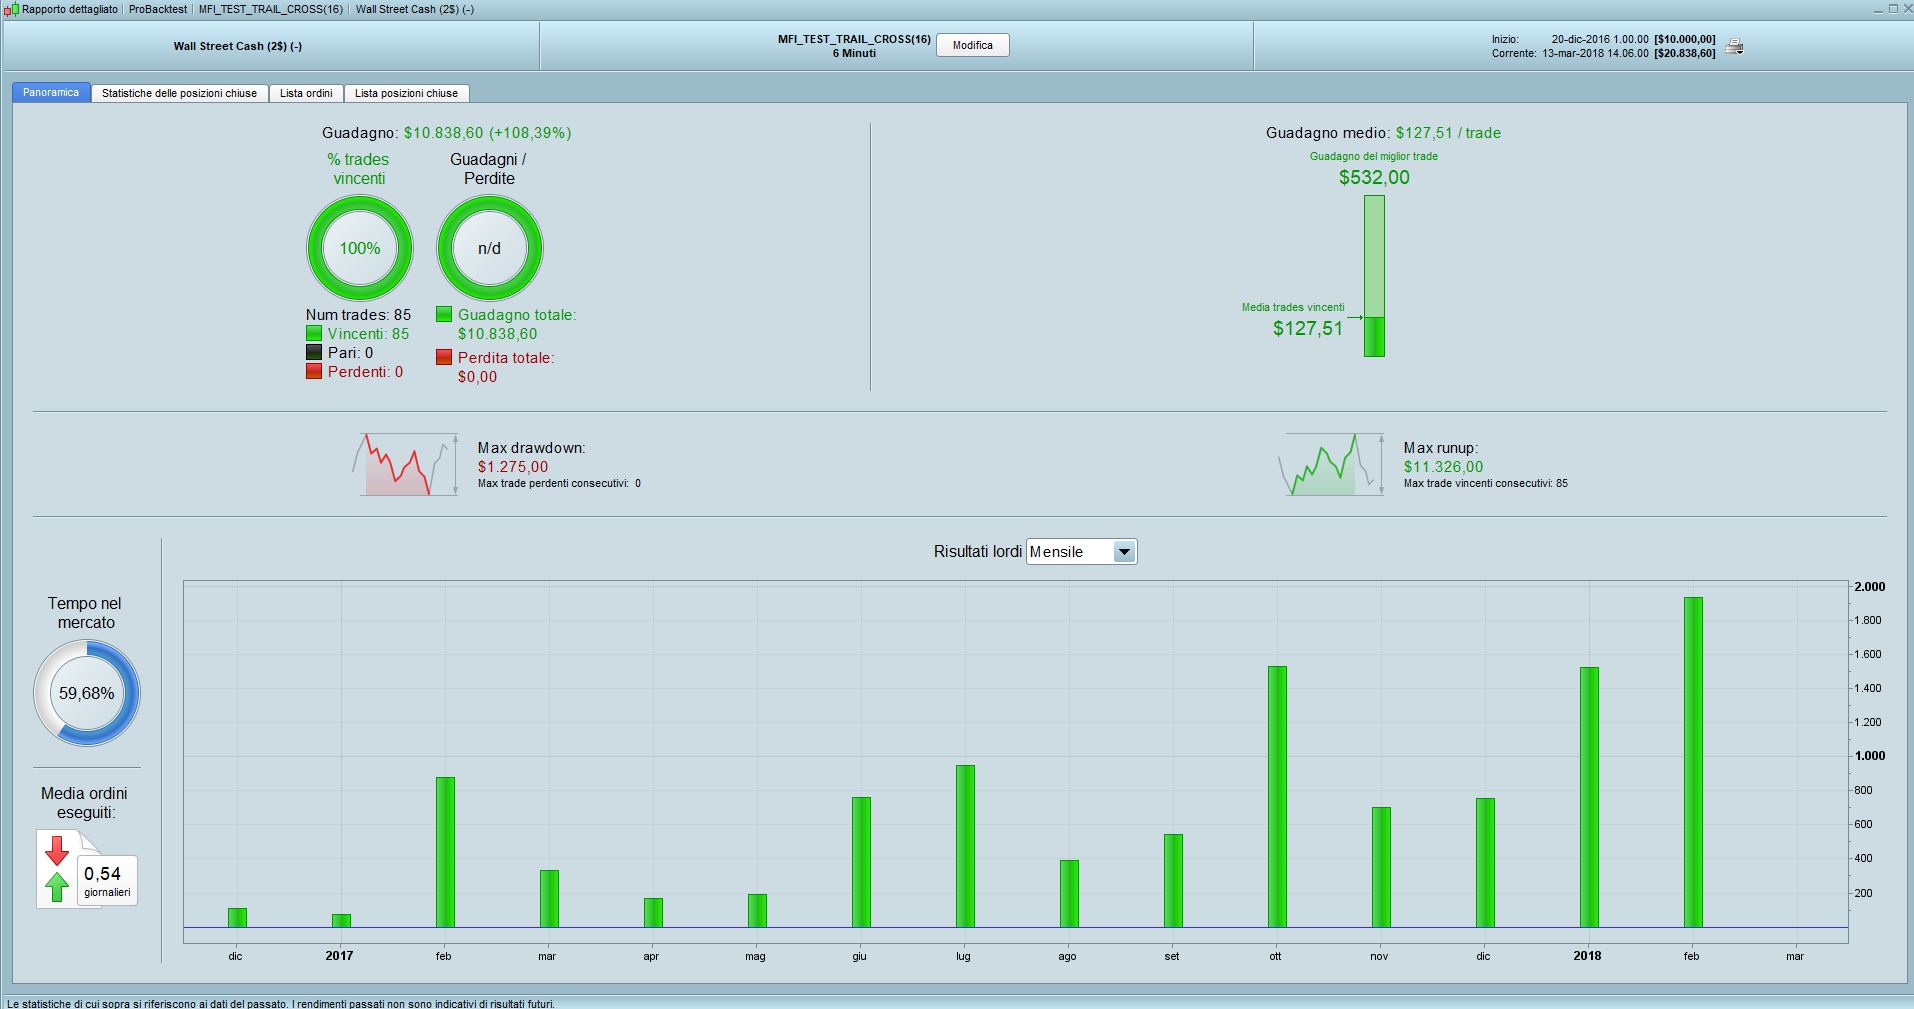
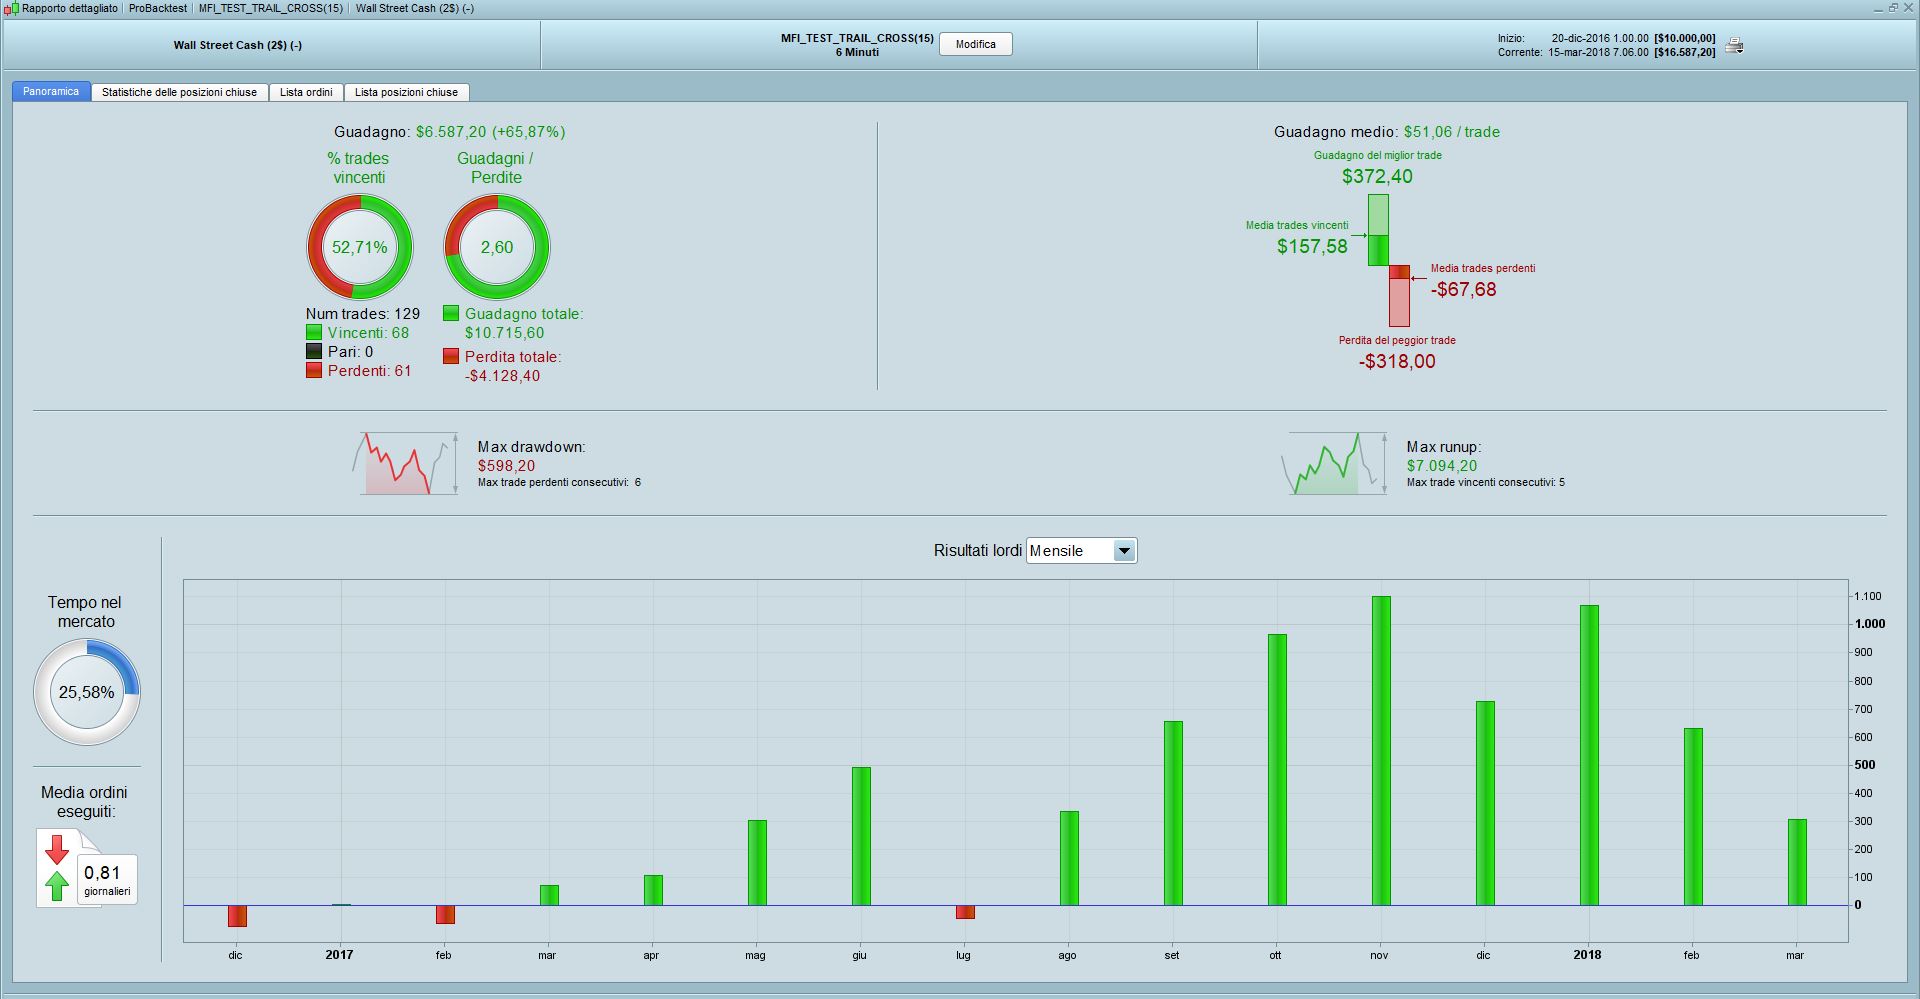
The system perform well on wall street (6 minutes) and has a little DD.
It would be nice if anyone can tests it on a frame of time greater than one year (as I can only do).
Let me know….
bye
//-----------------------------------------------------------------------------------------------
//WALL STREET
// 6 MIN.

DEFPARAM cumulateorders = FALSE

CONDAVG = 1

AVG = Average[S](close)

FOR C = 1 TO F
IF AVG[C-1] > AVG[C] THEN
IF CONDAVG = 1 THEN
CONDAVG = 1
ENDIF
ELSE
CONDAVG = 0
ENDIF
NEXT


TIMEWORK = 000000
TIMESTOP = 240000
F = 20
S = 200

MFIFAST = MoneyFlowIndex[F]
MFISLOW = MoneyFlowIndex[S]

BASEMFI = MFISLOW[0] > MFISLOW[F] AND MFISLOW[0] > MFISLOW[ROUND(F/2)] AND MFISLOW[0] > MFISLOW[ROUND(F/8)]
CONDMFIL =  MFIFAST[0] CROSSES OVER  MFISLOW[0]


//TRAILINGSTART = 50 * PIPSIZE
TRAILINGSTART = (close/((S*2)+(F*2))) * PIPSIZE

AMNT = TRAILINGSTART * POINTVALUE * COUNTOFPOSITION
//GRAPH AMNT

SIZEBUY = 1

IF CURRENTTIME >= TIMEWORK AND TIME <= TIMESTOP THEN
if not onmarket THEN
IF CONDMFIL AND BASEMFI   AND CONDAVG  THEN
BUY sizebuy SHARES AT highest[F](HIGH) STOP
endif
ENDIF
endif

IF ONMARKET THEN
PERFP = CLOSE - TRADEPRICE
PERFN = (PERFP / TRAILINGSTART)
TRAIL = (TRAILINGSTART/PERFN) *POINTVALUE * COUNTOFPOSITION

IF PERFP > TRAILINGSTART THEN
SET STOP $TRAILING TRAIL
ELSE
SET STOP $TRAILING AMNT
ENDIF

IF OPENTIME > 213000  AND DayOfWeek = 5 THEN
SELL AT MARKET
ENDIF

ENDIF
Even with in 200k bars, I don’ have a longer history than you. Tested with 2 points spread, the strategy shares the same equity curve than your test in tick mode. Did you try to change the trailing stop instruction with the code versions I made?
https://www.prorealcode.com/blog/learning/trailing-stop-max-favorable-excursion-mfe/
https://www.prorealcode.com/blog/trading/complete-trailing-stop-code-function/
DEIOParticipant
Veteran
hi Nicolas,
It is true….. I started from your code about trailng stop… but then I tried to use the feature of PRT (using $trailing in this case)
As you can see I tried to manage o sort of max favorable excursion identifying the explosion bar (not so frequent..)
The reason why I didn’t use your code is why I feel more comfortable when I can see the line of stop loss, which I can’t see
using the code which calculate an invisible stop loss.
Maybe you consider this approach a little bit strange but It’s a problem of my mind !!! 🙂
Regarding the strategy in a fist step I was very happy to see such results but it’s would be nice can see a larger frame of time as I said before.
The best thing I noticed about the strategy is that during the strong market fall (as recently happened) the strategy remain out of market correctly
and I think it’s a good quality notso banal …
Regarding DD it’s quite low compared to the gains.
Let me know if you intend to publish it or not.
Thx for any suggestion.
bye
@DEIO did you try the Nicolas TS Code on the Link below? You do get a Stop Line moving up / down with this code.
https://www.prorealcode.com/blog/trading/complete-trailing-stop-code-function/
I’m a tad confused, I got 10 months history if I recall correctly with 100,000 bars so why didn’t Nicolas get 20 months or so with 200,000 bars??
Cheers
GraHal
DEIOParticipant
Veteran
HI GraHal,
I modified the code as suggested and results (on 100K bars) are good but with less protection during the bear market phases.
I have to test it on demo in order to check if actually I can see the stop loss line moving (but I quite sure that is not so – sorry if I insist on it – maybe I am wrong…)
The reason why Nicolas couldn’t see on 200k is unknown to me, I can’t understand it as I can see only 100k (if I have correctly understood your affermation).
This the code modified:
//-----------------------------------------------------------------------------------------------
//-----------------------------------------------------------------------------------------------
//WALL STREET
// 6 MIN.
DEFPARAM cumulateorders = FALSE
CONDAVG = 1
AVG = Average[S](close)
FOR C = 1 TO F
IF AVG[C-1] > AVG[C] THEN
IF CONDAVG = 1 THEN
CONDAVG = 1
ENDIF
ELSE
CONDAVG = 0
ENDIF
NEXT
TIMEWORK = 000000
TIMESTOP = 240000
F = 20
S = 200
MFIFAST = MoneyFlowIndex[F]
MFISLOW = MoneyFlowIndex[S]
BASEMFI = MFISLOW[0] > MFISLOW[F] AND MFISLOW[0] > MFISLOW[ROUND(F/2)] AND MFISLOW[0] > MFISLOW[ROUND(F/8)]
CONDMFIL = MFIFAST[0] CROSSES OVER MFISLOW[0]
//TRAILINGSTART = 50 * PIPSIZE
TRAILINGSTART = ROUND((close/((S*2)+(F*2)))) * PIPSIZE
TRAILINGSTEP = ROUND(TRAILINGSTART / 4)
//AMNT = TRAILINGSTART * POINTVALUE * COUNTOFPOSITION
//GRAPH AMNT
SIZEBUY = 1
IF CURRENTTIME >= TIMEWORK AND TIME <= TIMESTOP THEN
if not onmarket THEN
IF CONDMFIL AND BASEMFI AND CONDAVG THEN
BUY sizebuy SHARES AT highest[F](HIGH) STOP
endif
ENDIF
endif

//reset the stoploss value
IF NOT ONMARKET THEN
newSL=0
ENDIF

//manage long positions
IF LONGONMARKET THEN
//first move (breakeven)
IF newSL=0 AND close-tradeprice(1)>=trailingstart*pipsize THEN
newSL = tradeprice(1)+trailingstep*pipsize
ENDIF
//next moves
IF newSL>0 AND close-newSL>=trailingstep*pipsize THEN
newSL = newSL+trailingstep*pipsize
ENDIF
ENDIF
IF newSL>0 THEN
SELL AT newSL STOP
ENDIF
Moderator’s edit: code edited to apply the correct PRT code format, please use “insert PRT code” button for future occurences (last one at end of first line of tools in message editor), thanks
I’ll give it a go later and let you know any findings.
Due to //TRAILINGSTART = 50 * PIPSIZE you won’t see the stop line even or any movement of the stop Line until price has moved 50 points into profit. I guess you knew that?
Also the stop line only gets a chance to move every TF period (6 mins in this case).
Did you optimise //TRAILINGSTART = 50 * PIPSIZE?
Maybe Nicolas will be along soon to tell us why he couldn’t get any more History than our 100k bars?
DEIOParticipant
Veteran
HI GraHal,
sorry to appear so unskilled…:) anyway you are right about the stop line which will appear only over a trailingstart points of gain and only
afer the code is proccessed every x minutes and the palcing of the sell order stop … 🙂
Yes I tried to optimize trailingstart value according to the close of the instrument which can change a lot during the years, so 50 points
on wall street NOW means a certain risk, while 2 years ago a different one.
The way I did can seem a little strange but it’s enough find a simply way like – for example- TRAILINGSTART = ROUND(close/400) * PIPSIZE
.. waiting for Nicolas tests on 200k….. (maybe could be troubles about the availability of the MFI indicator when tests are made on data older than 1 years?)
thx to all
No problemo DEIO … I am unskilled also compared to many on here! 🙂
Ah yes MFI needs volume and volume has prob only been available via IG on DJI since 12 months as you say … ah well we solved our own conundrum! Well done to us! 🙂
DEIOParticipant
Veteran
hi all,
I am making other test on the strategy and I would take advantage from your experience and the question is:
if the statement TRADEPRICE(1) contains the price of the last trade executed…..
what contains TRADEPRICE(0) ???
I ask that because I make an error editing my code using TRADEPRICE(0) instead of TRADEPRICE(1)
and I see strange results (no bad results I mean..) …. so I wonder what contains TRADEPRICE(0)….
could you help me ??
thx
TradePrice(0) is the price of the most recent trade … which may even still be trading (not yet ended).
TradePrice(1) is the price of the trade before the most recent trade (so 2 trades ago).
DO you test in Demo account ???
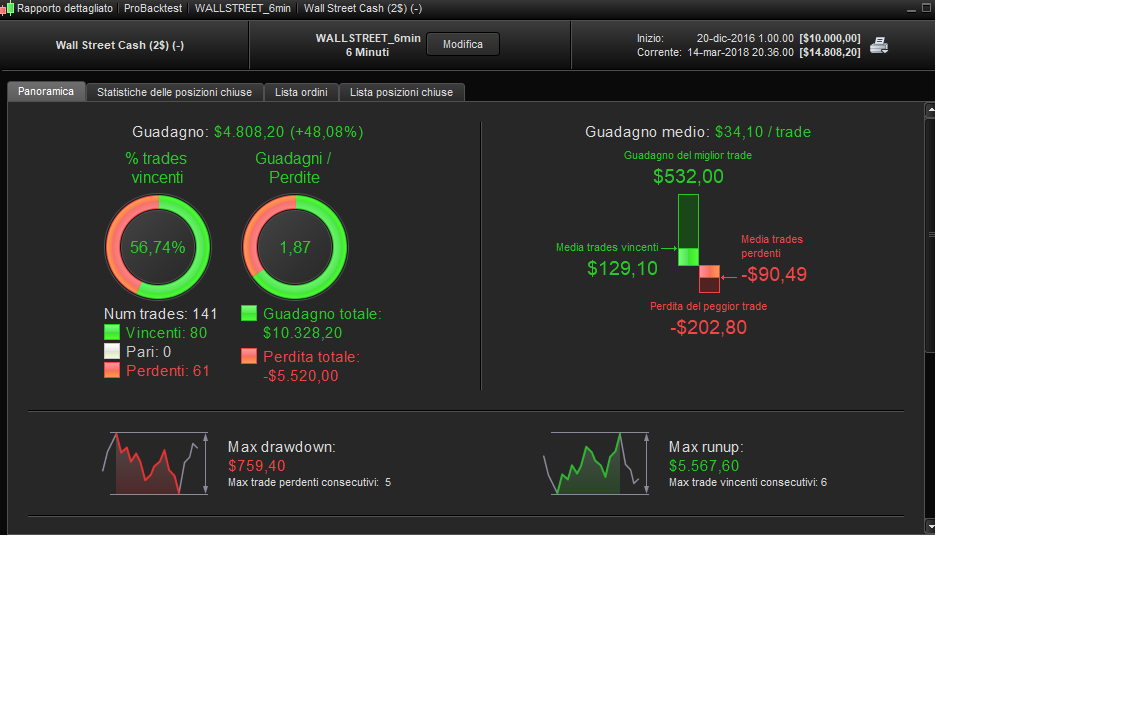
seems interest code , but I think could be more secure with the stop loss set up in the code ….
FOllow the backtest with 0.2 % and with 1.7 % Stop loss
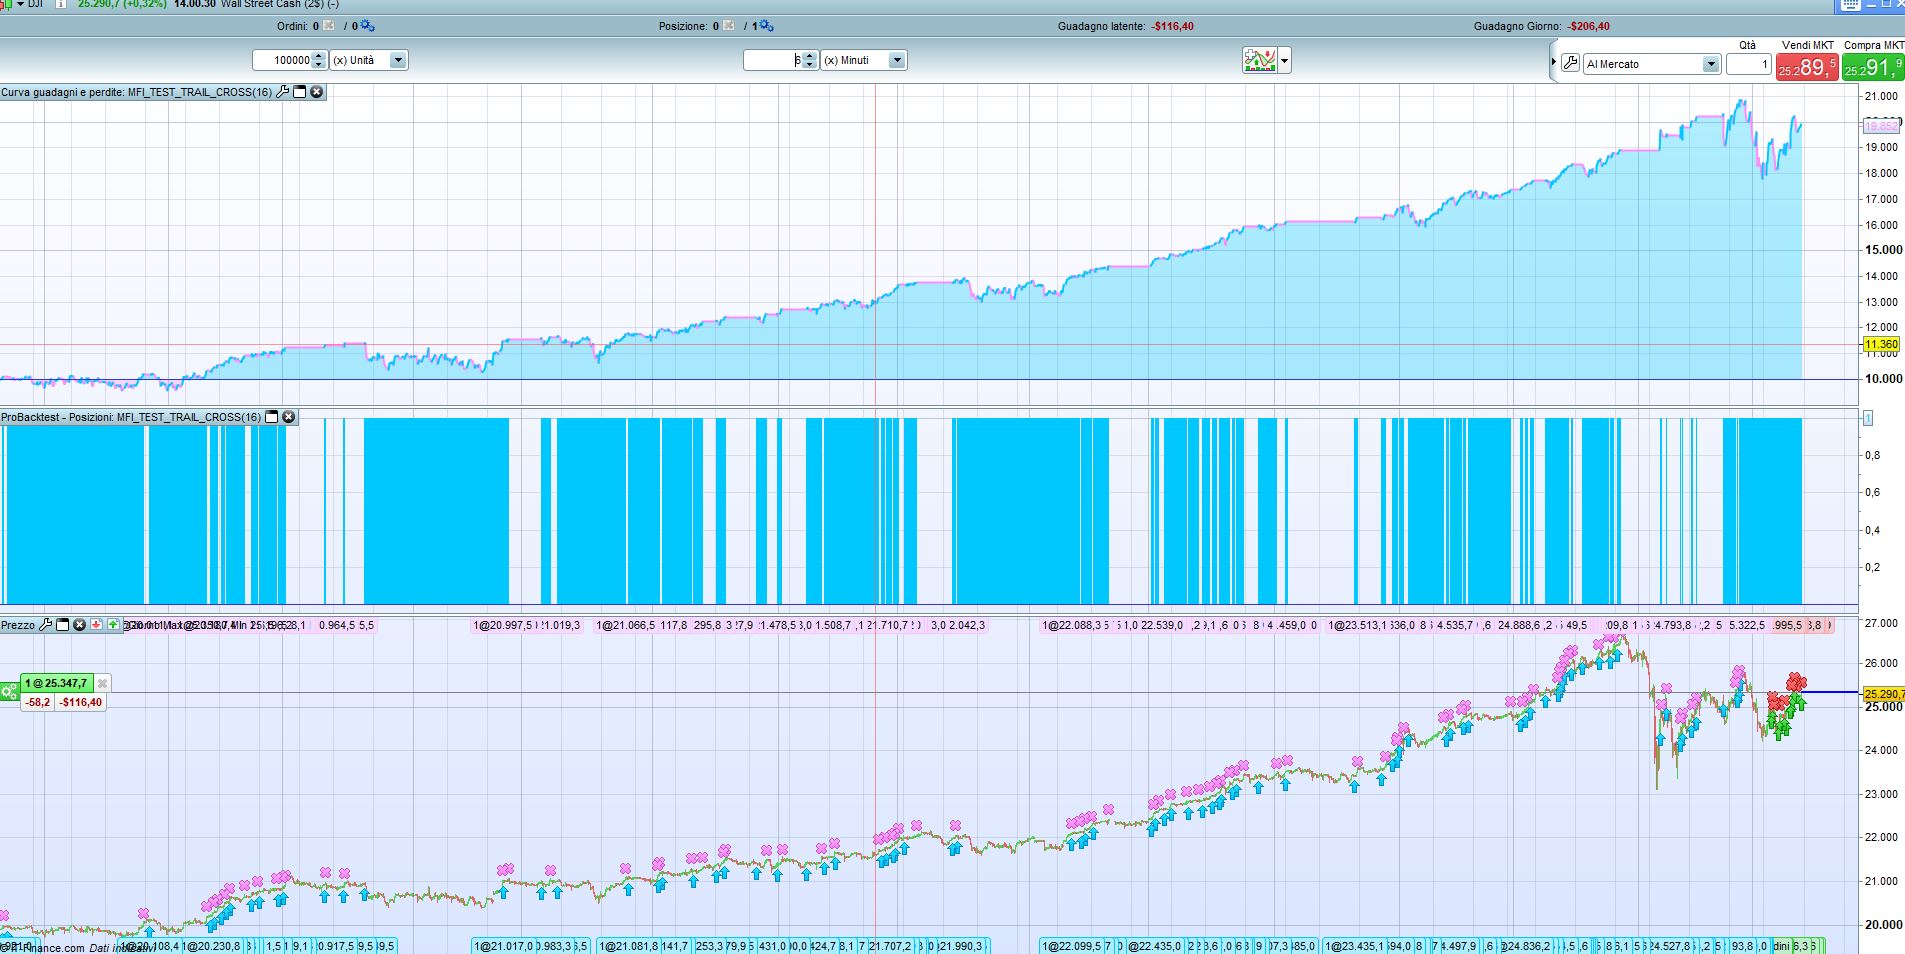
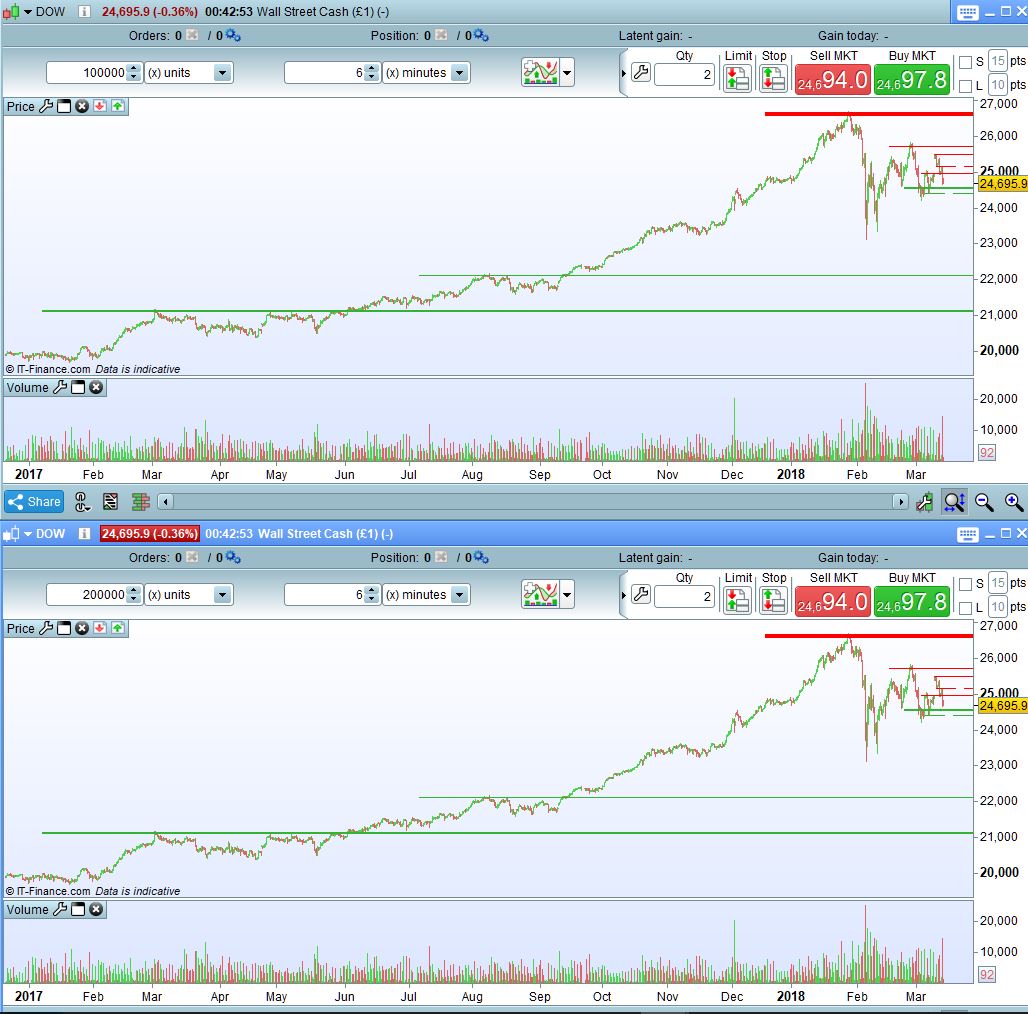
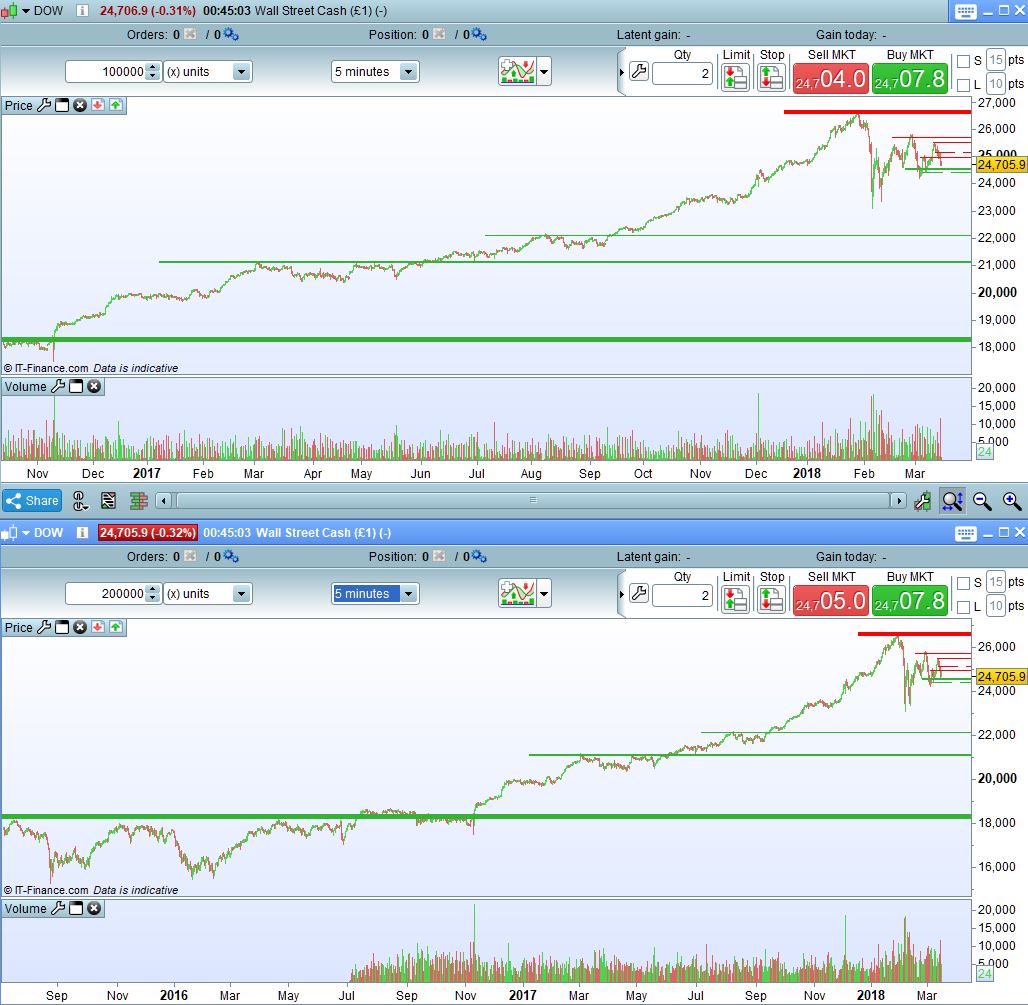
Actually the lack of complete 200k bar history is a known bug in PRT. I’ve raised it a couple of years back with them but it hasn’t been addressed. And also, there is volume history on the Dow going back further than 12mths, in fact it starts on Jul 2016. The reason there is no more data on 200k bars than 100k bars above is because of a weird bug in PRT that only calculates the full 200k bars based on “standard” time units ie those that you get on the drop down menu. At least that’s my theory anyway. See below.
As you see from the first image there is no more data on the 100k chart compared to 200k chart for the 6m TF
On the second image there is twice as much data in 200k units for the 5m period as there is for 100k units – as expected (its the same with 10m tf as well)
Also, I don’t think there is any correlation between the units shown in the drop down menu and the actual time scale on the charts.
Eg. for the 6m tf – 6m x 200,000 = 1.2m / 60/ 24 = 833 days /365 = 2.28 years ie 2yrs and 3mths approx. And as you can see from the history we get only around half that. In fact in reality it should be around 15% more history than even that figure due to the fact that Saturday has no units. I think you just have to accept this limitation in PRT though it’s a shame that if the data is there and is not being made available.
DEIOParticipant
Veteran
HI JR1976,
I’m cheking several version of the strategy(on demo) in order to find the best one.
Anyway I keep in consideration your suggestion and I’m preparing the proper code to manage the SL with the code provided by Nicolas.
Rusults with the version I posted (in attached) are quite good even on DD as your result in % on SL.
I’ll let you know further develops..
thx for you time.
bye
DEIOParticipant
Veteran
Hi manel
Thx a lot for your analisys
I imagined What yo are saying about PRT lackness of data and I really don’t know if they can fix such issue, but I agree with your disappoitment….
Obviously this way traders could fly away on other platforms…….
The again
Bye