Hi. Sorry if this is a stupid question. I am a self taught coder with a useless teacher…
I am trying to build a momentum strategy for the SA40 that uses indicator pull backs.
For the short condition the indicator needs to cross over -20 and then pull back to -50. This could happen in an unknown amount of candles. Is the a way to code that in?
Also you are welcome to comment on the rest of the unfinished code. I jumped to the sort first as there is a downtrend at the moment and wanted to test it
The code SHOULD(not sure if it does)
1. Find the trend, using lowest lows and highest highs( 2 of each)
2. Find Strong candle, I used 1.5 x the ATR of the last 10 candles
3. wait for the Williams R% to cross into over bought(>-20) and then pull back to -50
Any assistance will be highly appreciated.
Code:
// Conditions to enter long positions
For i = 1 to 10 do
HH1= Highest[i](high)// Latest Highest high
LL1 = Lowest[i](low)// Latest Lowest Low
next
for i1 = 11 to 20 do
HH2 = Highest[i1](high)//Second Highest high
LL2 = Lowest[i1](low)//Second lowest low
Next
c1 = hh1 > hh2
c2 = ll1 >ll2

// Conditions to exit long positions

// Conditions to enter short positions
ATR = ((high[10]-low[10])+(high[9]-low[9])+(high[8]-low[8])+(high[7]-low[17])+(high[6]-low[6])+(high[5]-low[5])+(high[4]-low[4])+(high[3]-low[3])+(high[2]-low[2])+(high[1]-low[1])/10)
BC = ATR*1.5// Big candle
c3 = hh1 < hh2//Downtrend
c4 = ll1 < ll2//Downtrend
c5 = Close > BC //Large bearish candle
To write code, please use the <> “insert PRT code” button. This will make our code easier to read and understand.
Thank you.
Here some code you might add to your strategy
ONCE CrossingFlag = 0                            //Set initial value to false
.
.
IF your_indicator CROSSES OVER -20 THEN
   CrossingFlag = 1                              //Set it on desidered crossing
ENDIF
.
.
IF your_indicator <= -50 AND CrossingFlag THEN   //If it pullbacks to 50%+ do what you want to do...
   .
   .
   CrossingFlag = 0                              //... then reset flag to false to start it all over
ENDIF
Roberto
@robertogozzi
You are too fast for me 😆
I added the code syntax window in the first post.
Thanks for the quick response. Will try that.
Sorry for posting incorrectly.
@robertogozzi You are too fast for me 😆 I added the code syntax window in the first post.
I try not to work too much…. that’s why (that’s the bad and the good of being older)!
Thanks Roberto, Works Great. The rest of my code does not, it does not make any trades. I think its got something to do with the static way I try to find the trend.
Is there a way to find the 2 most recent high and lows to compare to determine the trend?
This post, written by Nicolas to help me, checks the highest high and the lowest low within the last 50 bars, then assigns the difference to the variable TEST and compares it to 20 pips.
This might be a solution, if TEST is above “n” pips you can assume there is an ongoing trend.
https://www.prorealcode.com/topic/detecting-a-range/#post-10338
That would give you an indication that the market is trending yes, but in what direction. The conditions of the strategy is to look for a up or down trend and then decide to long or short. It needs to find and compare the 2 most recent highs and lows. If the market is making lower lows, the short conditions should apply and vise versa
You can tell a market is rallying or fallind by comparing, say, if price is above a long-term MA (100 or 200-period) and it’s been sitting there for n bars, or if an MA is on the rise (greater than n previous bars).
You may also check if the price is making higher highs and higher lows (or viceversa) since n bars.
It’s up to you to find a a way you like most and you think it’s trustworthy.
I am still Struggling with finding 2 consecutive higher highs and higher lows. The code suggested does not work as the range overlaps.
hh = highest[50](high)
ll = lowest[50](low)
hh1 = highest[25](high)
ll1 = lowest[25](low)
This will return the same point. I an uptrend the highest point within 50 will be the same as the highest point in 25.
The code I tried using the FOR statement does not work at all. Any other suggestions?
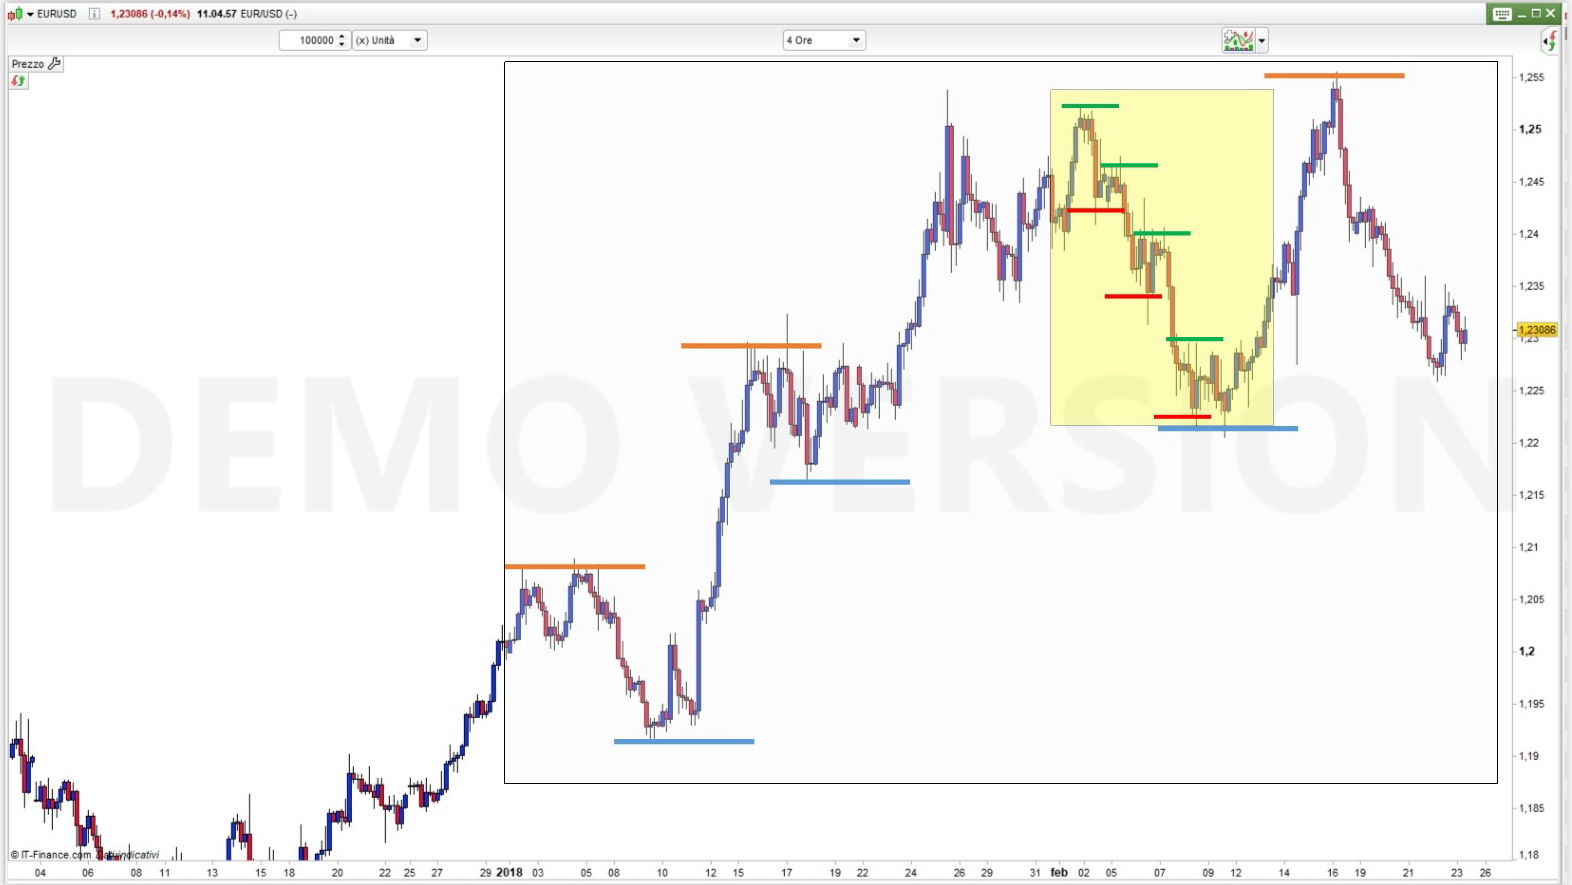
As you can see from the attached screenshot of Eur/Usd, h4, different scenarios often happens within the same chart.
The greater area shows an UpTrend (higher highs & higher lows), but inside that area there’s a smaller one going the other way round!
It all depends on the picture you want to see as a trader, if you are intraday trading you may want to look at the smaller area and have a closer goal to achieve, while in multiday trading you will likely look at the greater area for greater goals (in more time spent on market).
It’s up to you to tell how many bars you want to look back!
lets say i am interested in the shorter trend, how would i code it to pick that up. I tried the moving averages but it does not perform well
There is no way of making a code that always works well, everyone would (unlikely) be rich!
You tried with averages, well… say the price is above a 100-period MA and there’s been a Bullish crossing between a fast and a slow MA within the last 4 (or whatever) bars and the two MAs are widening their distance. You may assume an
UPtrend is ongoing. This is the code for you to evaluate and further develop or maybe put it in the trash bin:
//DEFPARAM CalculateOnLastBars = 1000
LongTermAVG = Average[100,1](close)
FastAVG     = Average[5,1](close)
SlowAVG     = Average[20,1](close)
AvgGap      = abs(FastAVG - SlowAVG)
IF (close > LongTermAVG) AND summation[4](FastAVG CROSSES OVER SlowAVG) AND (summation[2](AvgGap > AvgGap[1]) = 2) THEN
   UPtrend = 1
ELSE
   UPtrend = 0
ENDIF
//RETURN UPtrend
IF UPtrend THEN
   BUY 1 CONTRACT AT MARKET
ENDIF
summation[4](FastAVG CROSSES OVER SlowAVG), when true, reports a BULLish crossing within the last 4 bars.
summation[2](AvgGap > AvgGap[1]) = 2, when true, reports a widening of the distance between the two MAs for 2 consecutive bars.
If you comment out the last 3 lines and UNcomment the previous line (with RETURN) and line 1 you’ll have a very stupid indicator that may be useful to understand something about trends, just try it and change it tens of times!
I actually tested it on DAX , 1-minute chart. It’s funny!