Hello
I found this system that could be basic and adptable to several instrument but I have difficulties to code it.
This idea is to trade triangle pattern using volatity indicator and volume indicator. ( i know that it is difficult to detect trendline compression)
During triangle , volatility and volumes are decreasing and a proper moving average is flat (according to the article in doc enclosed).
Does someone has the idea how to code it? (specialy with decrease of volume and volatily)
Volume decrease could be code with a decrease of the average of volume
Volatily decrease could be code with a decrease of the average of volatily.
If both are decreasing, a buy or sell stop order is generated at last low/high
Triangle amplitude is equal to the highest(high)[x periods]-lowest(low)[x periods]
Thanks
 Leo
LeoParticipant
Veteran
Hi,
I posted a method to find local maximums and minimums, maybe you can find a way to detects triangles based on that method
Double bottom or double top
Let us know if you get it
I made a triangle pattern detector in this topic if you find it useful: https://www.prorealcode.com/topic/trendline-une-approche-du-trading/
Thanks I will try with wedge detector adding decrease as condition
Hello
I modified your code of the screener to better understand it with some comments (you used a b c d for points and I use High1 High2 Low1 Low2).
I am able to find compression lines with the screener
//PRC_Wedge pattern | screener
//12.09.2016
//Nicolas @ www.prorealcode.com
//Sharing ProRealTime knowledge
// modified by Yannick
//fractals
cp = 50//4 //lookback

//Detection High
if high[cp] >= highest[(cp)*2+1](high) then
LLH = 1
else
LLH = 0
endif

//Value of last High
if LLH = 1 then
High1 = High2[1]
High1bar = High2bar[1]
High2 = high[cp]
High2bar = barindex[cp]
endif

//Detection Low

if low[cp] <= lowest[(cp)*2+1](low)  then
LLL = -1
else
LLL = 0
endif

//Value of last Low

if LLL = -1 then
Low1 = Low2[1]
Low1bar = Low2bar[1]
Low2 = low[cp]
Low2bar = barindex[cp]
endif

// condition of screening
//condition 1 triangle compression contraction Lows are increasings and High are decreasing High1>High2 and Low1<Low2
//condition 2 compression of volatilty Initial swing High1Low1> Last Swing High2Low2 : abs(High1-Low1)> abs(High2-Low2)

risingwedge = High1<High2 and Low1<Low2 and abs(High1bar-High2bar)>abs(Low1bar-Low2bar) and abs(High1-High2)<abs(Low1-Low2) //Rising wedge?
triangle = High1>High2 and Low1<Low2 and abs(High1-Low1)> abs(High2-Low2) //triangle condition contraction Low increasing and High decreasing
fallingwedge = High1>High2 and Low1>Low2 and abs(High1bar-High2bar)<abs(Low1bar-Low2bar) and abs(High1-High2)>abs(Low1-Low2) //Falling weg ?

SCREENER [risingwedge or triangle or fallingwedge]


//triangle drawlinefuction

//Volatility decrease
//AverageVolatity
//Volatilty

//Previous trend detection : triangle should be continuation pattern
//Previous trend detection : trend continuation wedge should a short term reversalpattern and long term continuation
//close > average[X]
and for and indicator, but I have a problem with drawline function which drawlines in the indicator window and not inside pricewindow
//PRC_Wedge pattern | screener
//12.09.2016
//Nicolas @ www.prorealcode.com
//Sharing ProRealTime knowledge
// modified by Yannick
//fractals
cp = 10//4 //lookback

//Detection High
if high[cp] >= highest[(cp)*2+1](high) then
LLH = 1
else
LLH = 0
endif

//Value of last High
if LLH = 1 then
High1 = High2[1]
High1bar = High2bar[1]
High2 = high[cp]
High2bar = barindex[cp]
endif

//Detection Low

if low[cp] <= lowest[(cp)*2+1](low)  then
LLL = -1
else
LLL = 0
endif

//Value of last Low

if LLL = -1 then
Low1 = Low2[1]
Low1bar = Low2bar[1]
Low2 = low[cp]
Low2bar = barindex[cp]
endif

// condition of screening
//condition 1 triangle compression contraction Lows are increasings and High are decreasing High1>High2 and Low1<Low2
//condition 2 compression of volatilty Initial swing High1Low1> Last Swing High2Low2 : abs(High1-Low1)> abs(High2-Low2)

c1 = High1<High2 and Low1<Low2 and abs(High1bar-High2bar)>abs(Low1bar-Low2bar) and abs(High1-High2)<abs(Low1-Low2) //Rising wedge?
c2 = High1>High2 and Low1<Low2 and abs(High1-Low1)> abs(High2-Low2) //triangle condition contraction Low increasing and High decreasing
c3 = High1>High2 and Low1>Low2 and abs(High1bar-High2bar)<abs(Low1bar-Low2bar) and abs(High1-High2)>abs(Low1-Low2) //Falling weg ?


if c1 or c2 or c3 then
DRAWLINE(Low1bar,Low1,Low2bar,Low2)
DRAWLINE(High1bar,High1,High2bar,High2)
endif
Return

//Volatility decrease
//AverageVolatity
//Volatilty
I should use the drawsegment instruction instead of drawline..
Better like this
//PRC_Wedge pattern | screener
//12.09.2016
//Nicolas @ www.prorealcode.com
//Sharing ProRealTime knowledge
// modified by Yannick
//fractals
cp = 10//4 //lookback
//volatilty
HistVolatily=HistoricVolatility[300](close)
//Detection High
if high[cp] >= highest[(cp)*2+1](high) then
LLH = 1
else
LLH = 0
endif
//Value of last High
if LLH = 1 then
High1 = High2[1]
High1bar = High2bar[1]
High2 = high[cp]
High2bar = barindex[cp]
endif
//Detection Low
if low[cp] <= lowest[(cp)*2+1](low) then
LLL = -1
else
LLL = 0
endif
//Value of last Low
if LLL = -1 then
Low1 = Low2[1]
Low1bar = Low2bar[1]
Low2 = low[cp]
Low2bar = barindex[cp]
endif
// condition of screening
//condition 1 triangle compression contraction Lows are increasings and High are decreasing High1>High2 and Low1<Low2
//condition 2 compression of volatilty Initial swing High1Low1> Last Swing High2Low2 : abs(High1-Low1)> abs(High2-Low2)
risingwedge = High1<High2 and Low1<Low2 and abs(High1bar-High2bar)>abs(Low1bar-Low2bar) and abs(High1-High2)<abs(Low1-Low2) //Rising wedge?
triangle = High1>High2 and Low1<Low2 and abs(High1-Low1)> abs(High2-Low2) //triangle condition contraction Low increasing and High decreasing
fallingwedge = High1>High2 and Low1>Low2 and abs(High1bar-High2bar)<abs(Low1bar-Low2bar) and abs(High1-High2)>abs(Low1-Low2) //Falling weg ?
if risingwedge or triangle or fallingwedge then
DRAWsegment(Low1bar,Low1,Low2bar,Low2)
DRAWsegment(High1bar,High1,High2bar,High2) //triangle drawlinefuction
endif
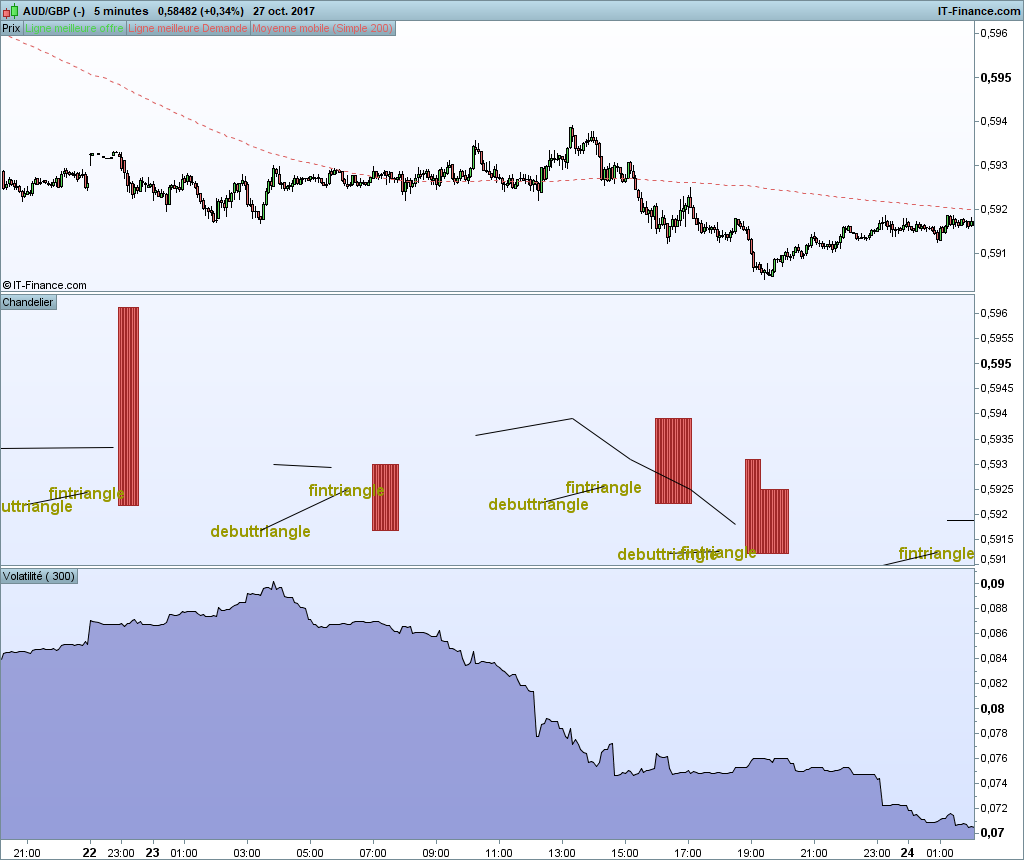
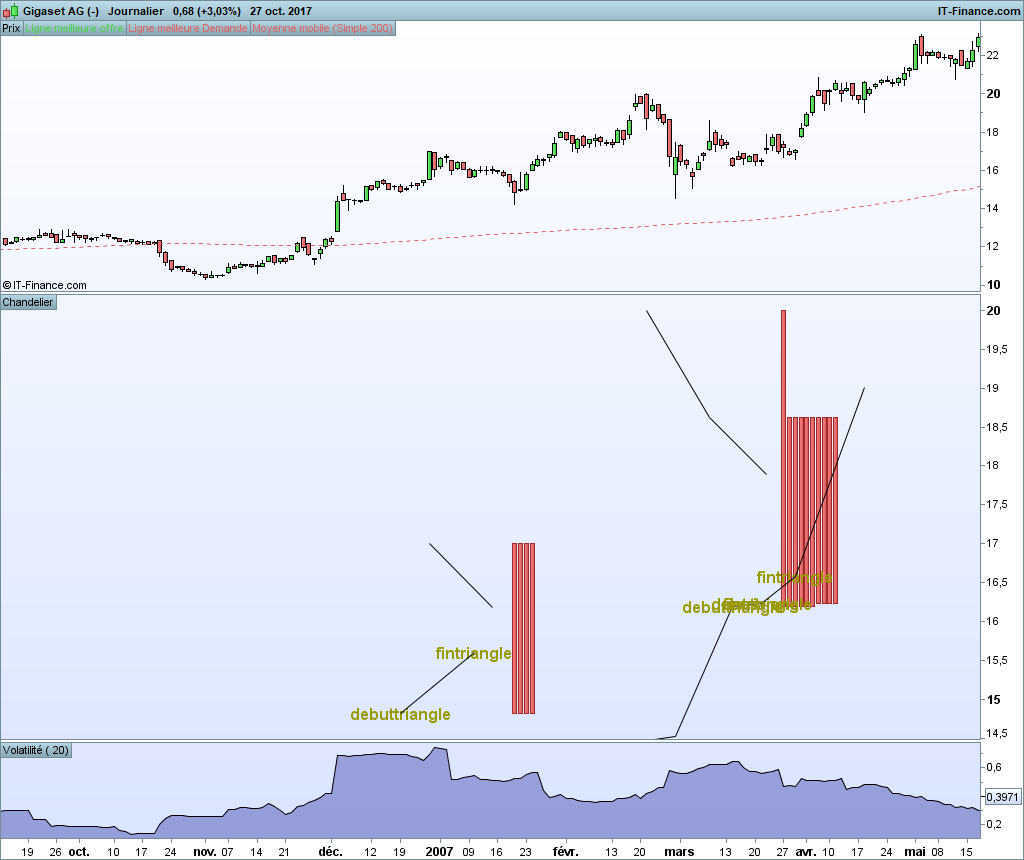
if triangle and HistVolatily< HistVolatily[300] then
DRAWCANDLE(High1,high2,low2,low1)
DRAWTEXT("fintriangle",low2bar,low2,SansSerif,Bold,16)coloured(153,153,0)
DRAWTEXT("debuttriangle",low1bar,low1,SansSerif,Bold,16)coloured(153,153,0)
endif
//Volatility decrease in triangle lowest 300 period volatily
//AverageVolatity
//Volatilty
//Previous trend detection : triangle should be continuation pattern
//Previous trend detection : trend continuation wedge should a short term reversalpattern and long term continuation
//close > average[X]
Return
Good! Do you have screenshots of your indicator in its current state?
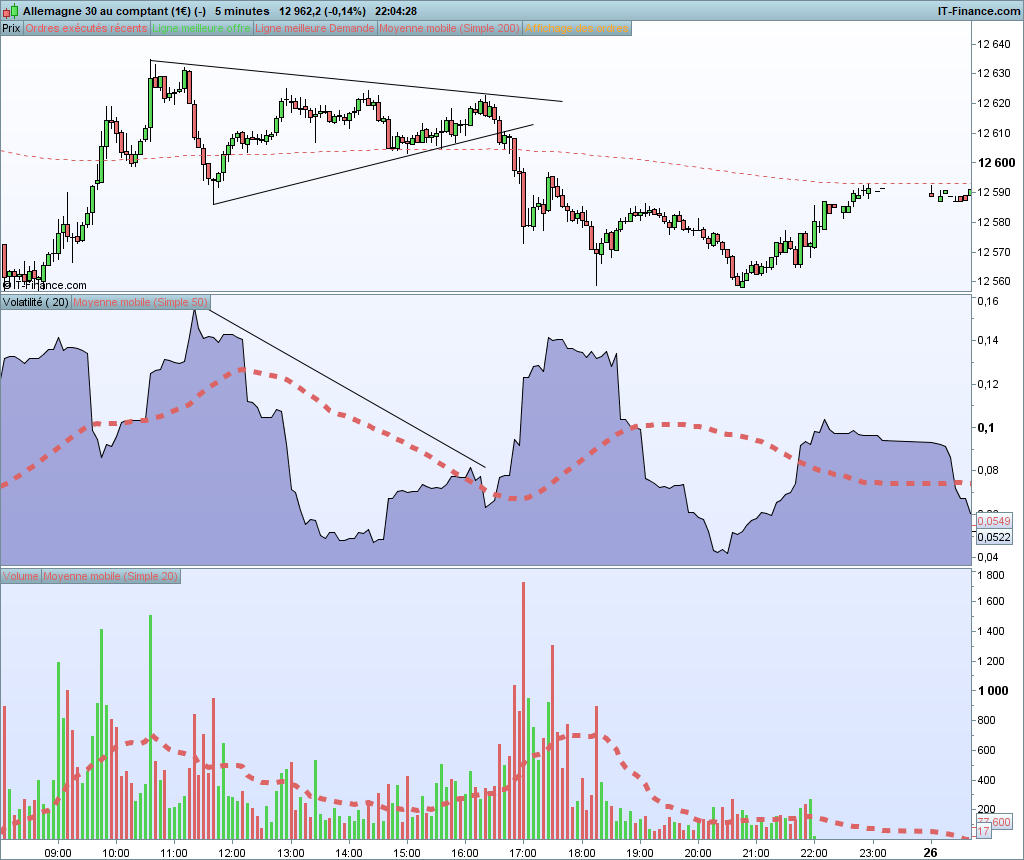
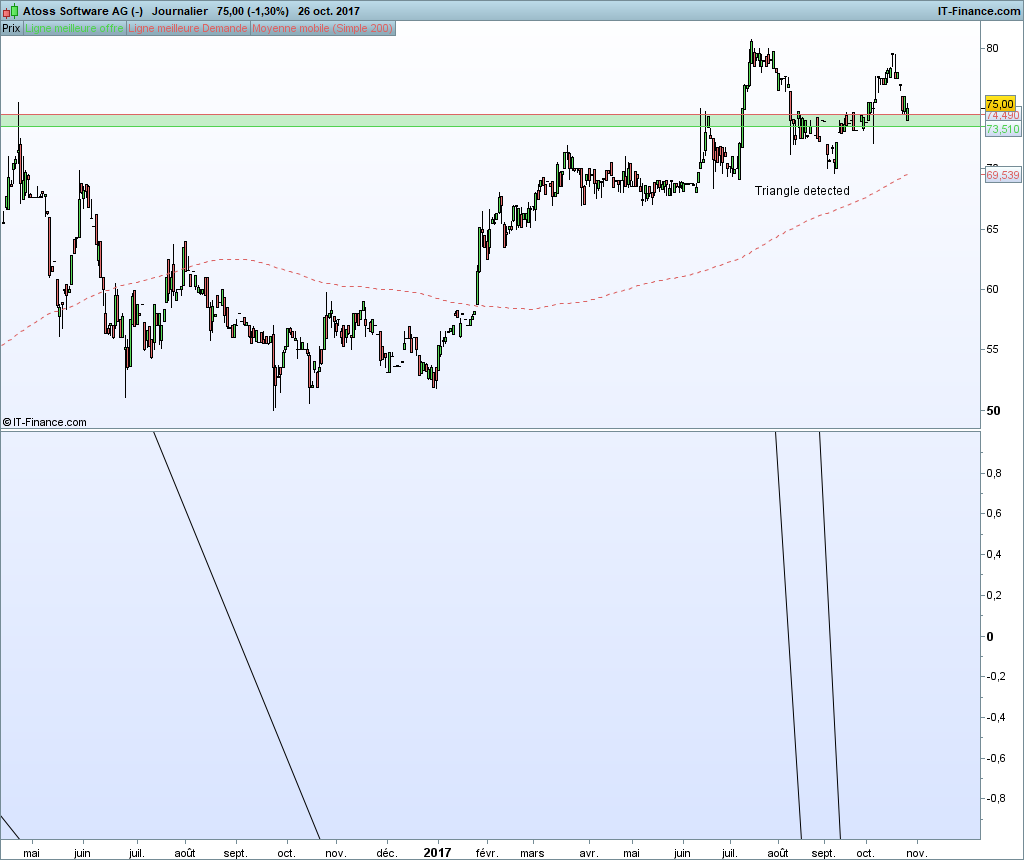
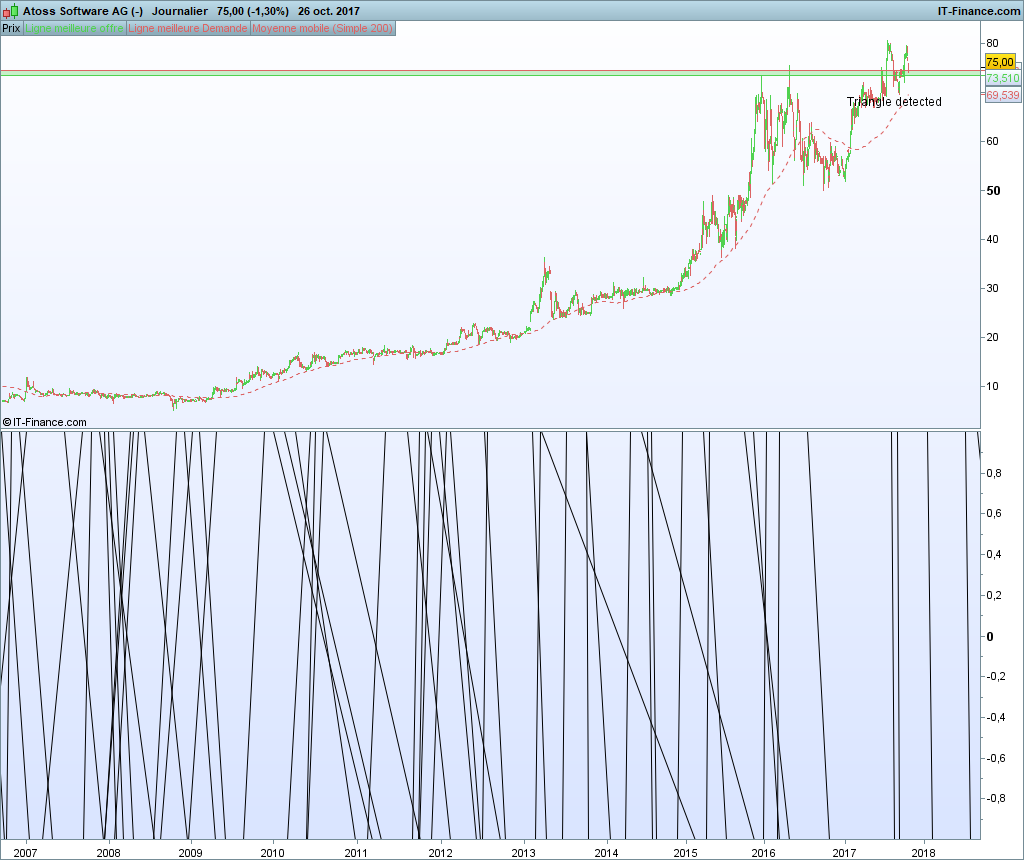
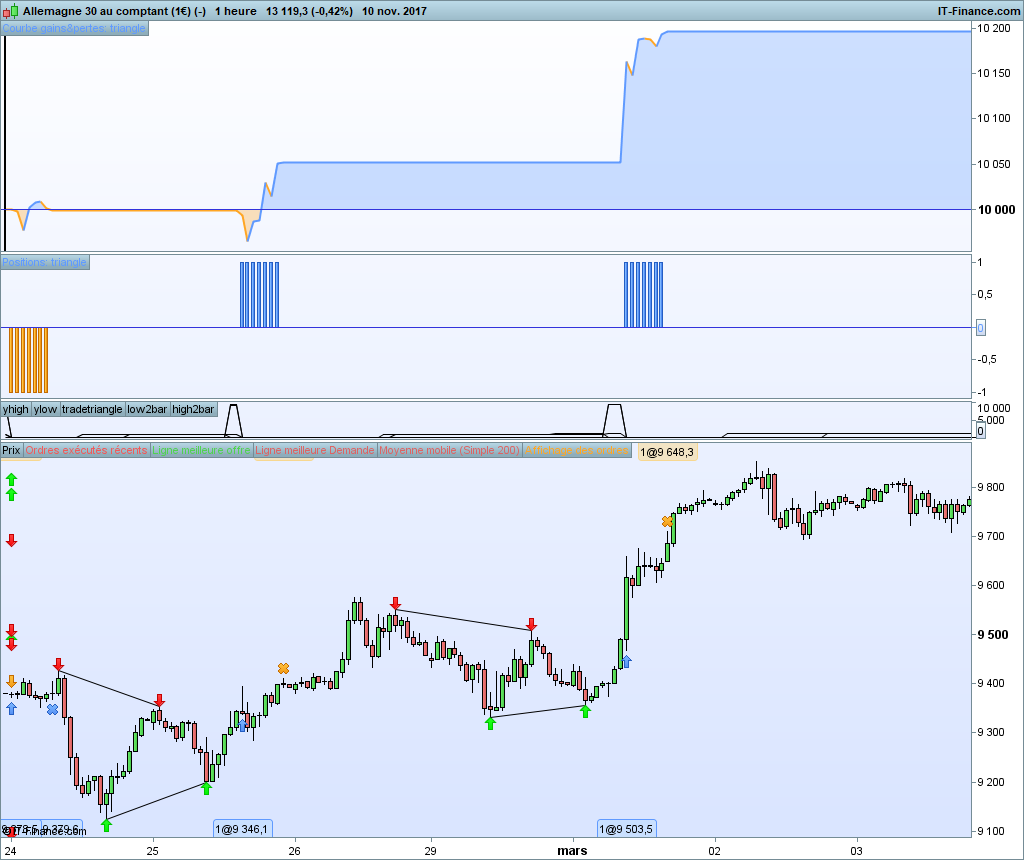
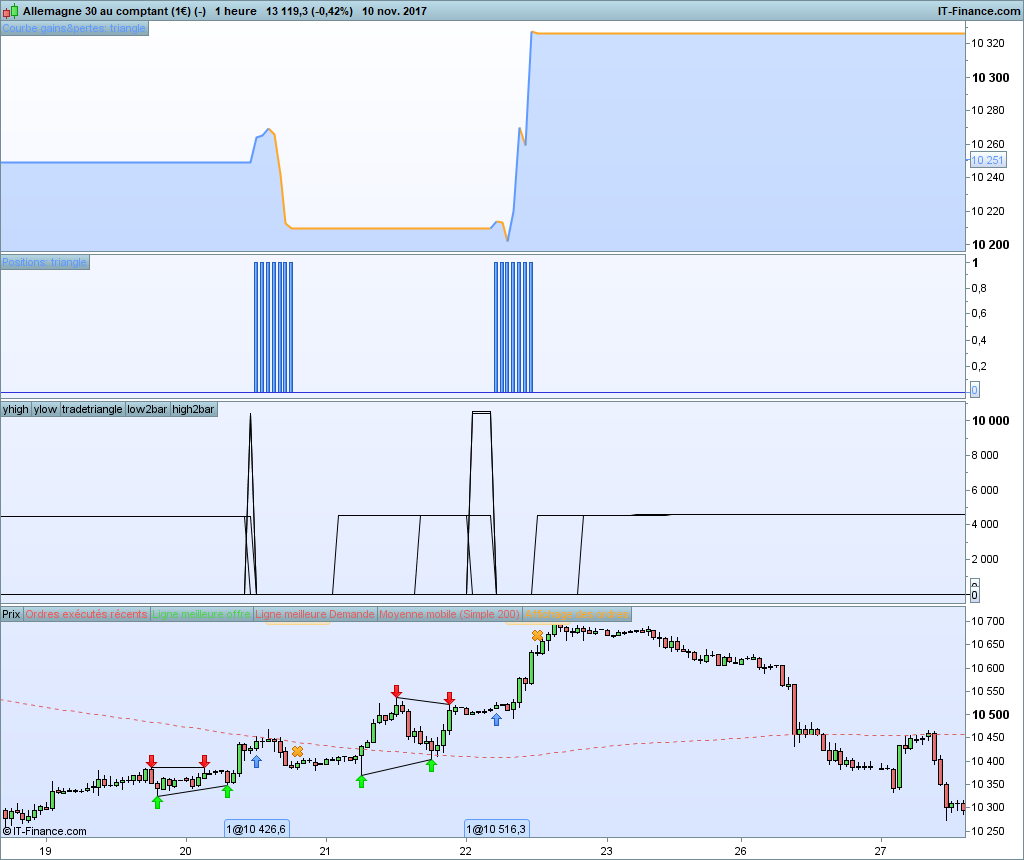
Please find somescreenshots
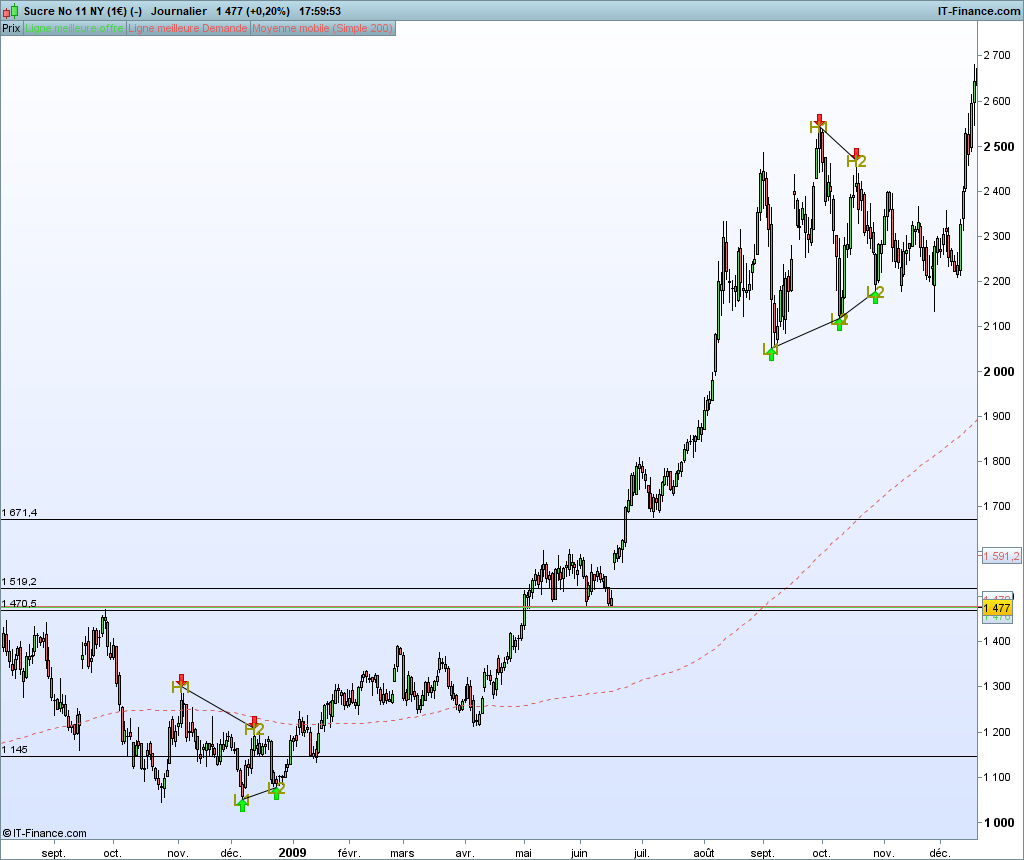
for daily , i look at 20 days volatilty and fractal cp=4
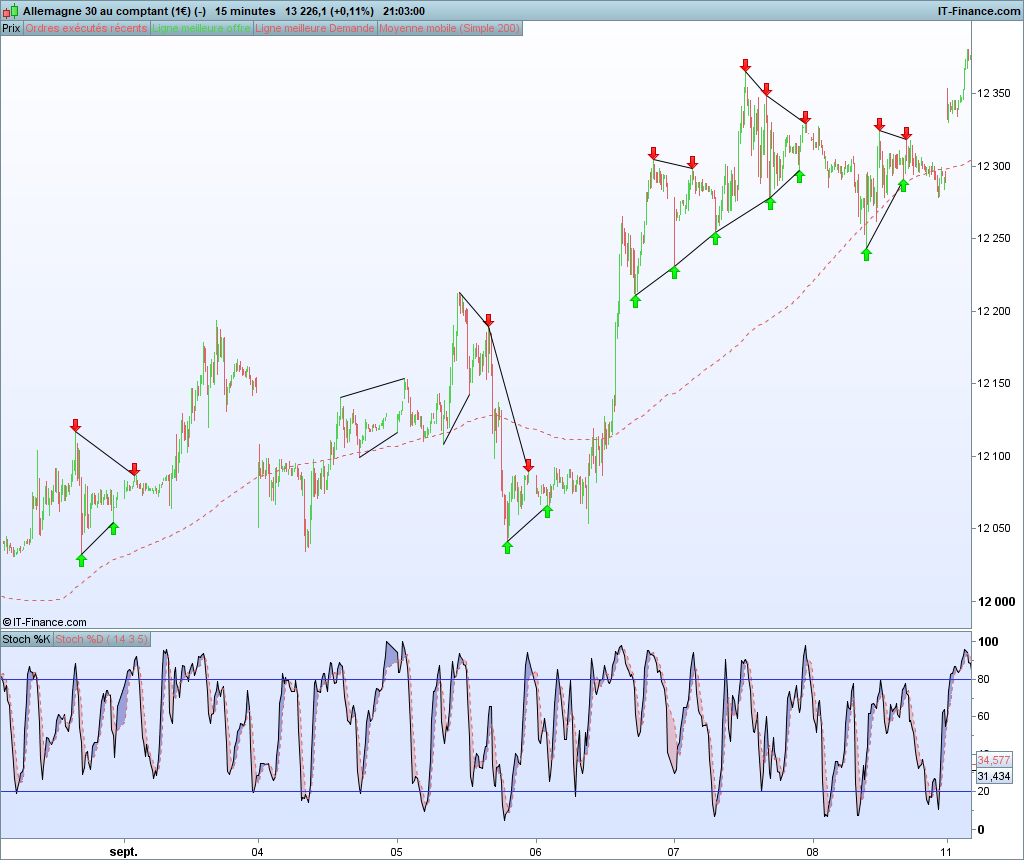
for 5 minutes timeframe, I look at 300 bars volatily and fractal cp=10
How can prt draw directly in price window and not in indicator window?
How can prt draw directly in price window and not in indicator window?
Just add your indicator on price with the wrench icon on the left upper side of your price chart.
Thanks
It is better like this
I have to improve the logic by
-filtering using stochastic oscillation which could give information on the period of fractal to control
-control the angle of the triangle (more symetric triangle pattern),
-preventing fake detection by measuring the time distance between Low1-Low2 and Hig1-High2
I will try to use @juanj code from calculating diagonal trend line using trigonometry for trading of breakout of lines.
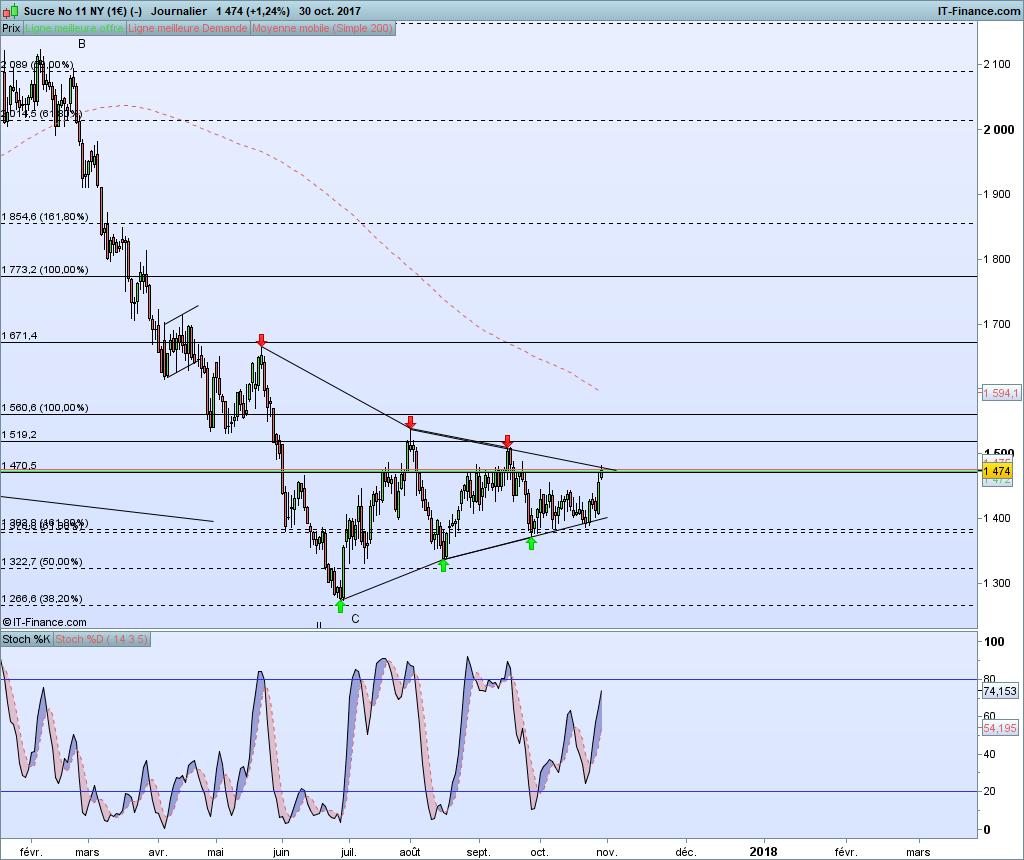
Some picture of my manual trade on sugar that I am following, which is detected
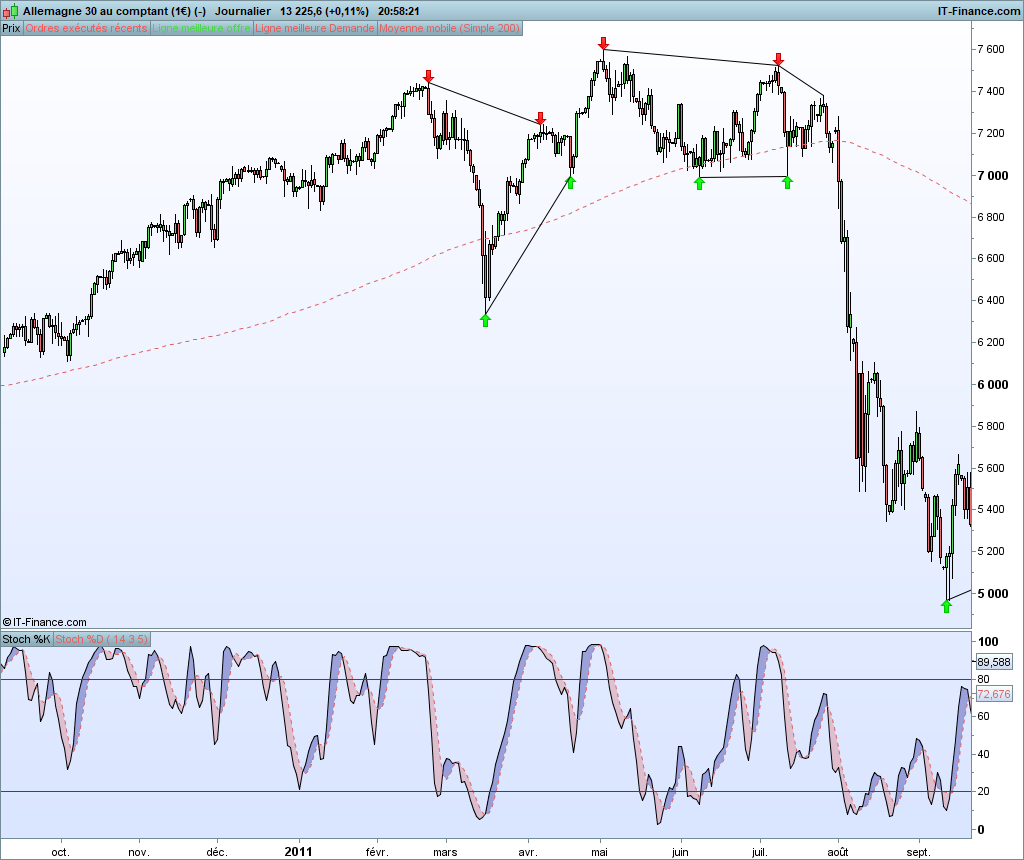
And other time frames
Well done Yannick, great idea about stochastic oscillation, how many times overbought been met after an oversold and so on?
I improved the quality of the triangle signal with some extra logic condition 3 and 4
// condition of screening Triangle
//condition 1 triangle compression contraction Lows are increasings and High are decreasing High1>High2 and Low1<Low2
//condition 2 compression of volatilty Initial swing High1Low1> Last Swing High2Low2 : abs(High1-Low1)> abs(High2-Low2)
//condition 3 triangle oscillation inside the triangle e.g. correct order of bars L/H/L/H or H/L/H/L
//condition 4 triangle amplitude ratio control H1L1< 2 H2L2

triangle = High1>High2 and Low1<Low2 and abs(High1-Low1)> abs(High2-Low2) //triangle conditions 1+2 contraction Low increasing and High decreasing

oscillationH1L1H2L2= High1bar< Low1bar and Low1bar< High2bar and High2bar<Low2bar  //triangle condition 3 oscillation

oscillationL1H1L2H2= Low1bar<High1bar and High1bar<Low2bar and Low2bar< High2bar //triangle condition 3 oscillation

triangleamplitude=abs(High1-Low1)< 2* abs(High2-Low2) //2is value that could be improved
The next question is how to generate stop orders on lines that are calculated at each bar and has to stay valid for1 bar and is modified at each new bar , I need help.
In this case x=0 current bar?
positionsize=1
TP= min(High2-Low1, High1-Low2)
SL = TP/2

//Equation of line y=ax+b
// slope a= (yB-yA)/(xB-xA)= deltay/deltax
// intercept b= yA-xA(YB-YA)/(xB-xA)

//calculation of upperline equation and position yHigh for buystop
//aH=(H2-H1)/(H2bar-H1bar)
bH=High1-High1bar*(High2-High1)/(High2bar-High1bar)

yHigh=bH//aH*????

//calculation of lowerline equation

//aL=(L2-L1)/(L2bar-L1bar)
bL=Low1-Low1bar*(Low2-Low1)/(Low2bar-Low1bar)

yLow=bL//+aL*????

if triangle and triangleamplitude and oscillationH1L1H2L2 or triangle and triangleamplitude and oscillationL1H1L2H2 then
orderloop=1
Endif

for orderloop=1 to cp do
buy positionsize lot at yHigh STOP
Sell positionsize lot at yLow STOP
next
//buy stop at x=0 y=b ????
if onmarket then
set target profit TP
set stop loss SL
orderloop=0
endif
Pending orders are only valid during 1 bar in any case, they expired at each new Close. So each time the code is read, the previous STOP order has already been deleted automatically by the broker.
Thanks I modified the buying and sellingshort logic.
I still have to
-calculate better the buystop and sellstop limite with TP and SL
-improving time limitation on the trade regarding
-improve triangle detection
Plenty of brain work
if not onmarket and Tradetriangle=1  then
yhigh=yhigh+aH
yLow=yLow+aL
buy positionsize contract at yHigh STOP
Sellshort positionsize contract at yLow STOP
Endif