ProRealCode - Trading & Coding with ProRealTime™
Bonjour,
voilà ci-dessous le code ICT KILLZONES.Seul ASIE-LONDRES-NYam sont utilisés.
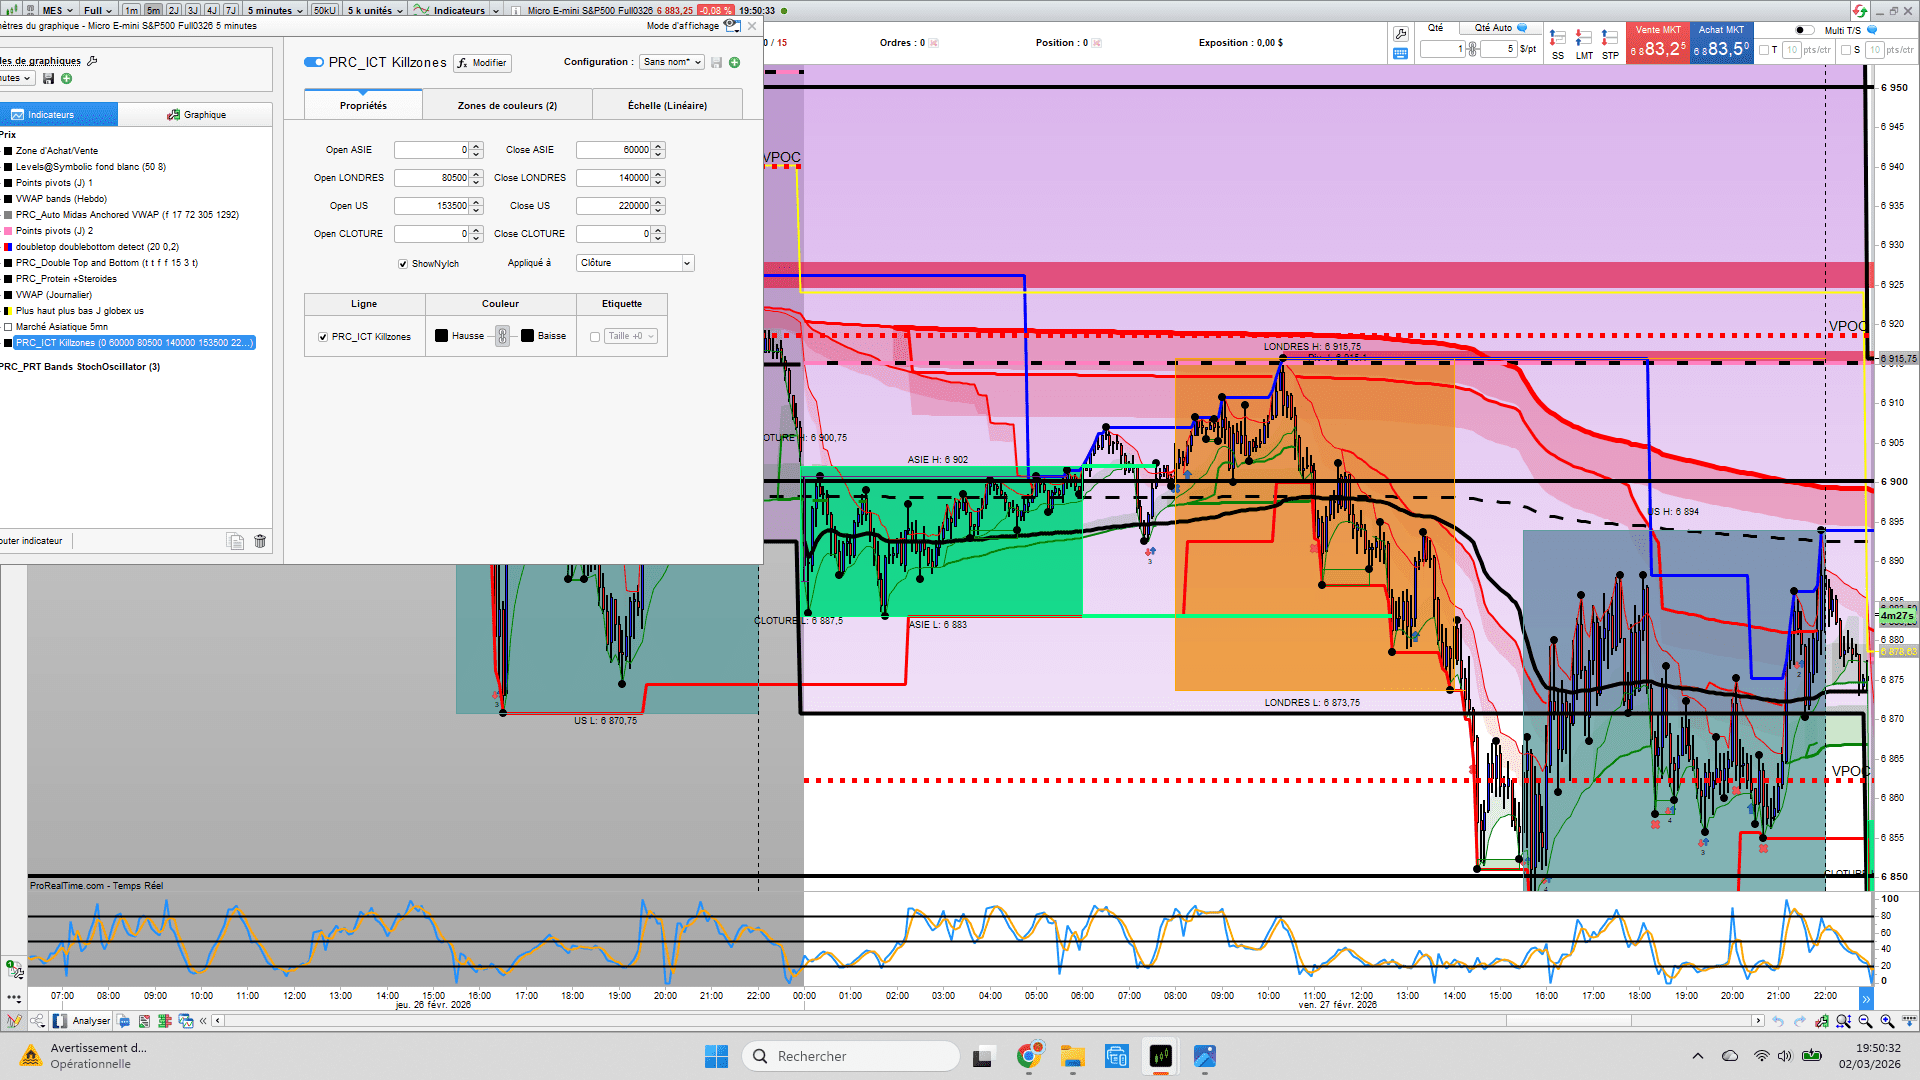
Je cherche à tracer la middle de ces rectangles (en sachant qu’ils ne sont dessinés qu’à la fin du temps de la zone).L’idéal serait que la moyenne se trace au fur et à mesure du timeframe puis s’arrête quand le rectangle se trace ou bien même s’arrête lorsque la nouvelle zone arrive.Puis retrace la nouvelle moyenne de la nouvelle zone (europe) et ainsi de suite jusqu’à la zone NYam.
//----------------------------------------------//
//PRC_ICT Killzones and Pivots
//version = 0
//10.10.2024
//Iván González @ www.prorealcode.com
//Sharing ProRealTime knowledge
//----------------------------------------------//
//-----INPUTS-----------------------------------//
//----------------------------------------------//
//OpenASIE=000000
//CloseASIE=060000
//OpenLONDRES=080000
//CloseLONDRES=140000
//openNYam=153000
//closeNYam=220000
//openNYlch=000000
//closeNYlch=000000
//openNYpm=000000
//closeNYpm=000000
openNY=openNYam
closeNY=closeNYpm
limitday=220000
openTrueDay=010000
if gettimeframe<=3600 then
//----------------------------------------------//
//-----ASIA Zone--------------------------------//
//----------------------------------------------//
once maxHighAS=high
once minLowAS=low
if opentime>=OpenASIE and opentime<=CloseASIE then
barAS=barAS+1
if high>=maxHighAS then
maxHighAS=high
else
maxHighAS=maxHighAS
endif
if low<=minLowAS then
minLowAS=low
else
minLowAS=minLowAS
endif
endif
if opentime=CloseASIE then
drawrectangle(barindex[barAS],minLowAS,barindex,maxHighAS)coloured("SPRINGGREEN")fillcolor("SPRINGGREEN",250)
drawtext("ASIE H: #maxHighAS#",barindex[round(barAS/2)],maxHighAS+0.3*tr)
drawtext("ASIE L: #minLowAS#",barindex[round(barAS/2)],minLowAS-0.3*tr)
prevLowAS=minLowAS
prevHighAS=maxHighAS
previdxAS=barindex
barAS=0
minLowAS=high*100
maxHighAS=0
endif
if low crosses under prevLowAS then
drawsegment(previdxAS,prevLowAS,barindex,prevLowAS)coloured("SPRINGGREEN")style(line,4)
prevLowAS=0
elsif opentime=limitday and prevLowAS<>0 then
drawsegment(previdxAS,prevLowAS,barindex,prevLowAS)coloured("SPRINGGREEN")style(line,4)
prevLowAS=0
elsif islastbarupdate and prevLowAS<>0 then
drawsegment(previdxAS,prevLowAS,barindex,prevLowAS)coloured("SPRINGGREEN")style(line,4)
endif
if high crosses over prevHighAS then
drawsegment(previdxAS,prevHighAS,barindex,prevHighAS)coloured("SPRINGGREEN")style(line,4)
prevHighAS=0
elsif opentime=limitday and prevHighAS<>0 then
drawsegment(previdxAS,prevHighAS,barindex,prevHighAS)coloured("SPRINGGREEN")style(line,4)
prevHighAS=0
elsif islastbarupdate and prevHighAS<>0 then
drawsegment(previdxAS,prevHighAS,barindex,prevHighAS)coloured("SPRINGGREEN")style(line,4)
endif
//----------------------------------------------//
//-----London Zone------------------------------//
//----------------------------------------------//
once maxHighLO=high
once minLowLO=low
if opentime>=OpenLONDRES and opentime<=CloseLONDRES then
barLO=barLO+1
if high>=maxHighLO then
maxHighLO=high
else
maxHighLO=maxHighLO
endif
if low<=minLowLO then
minLowLO=low
else
minLowLO=minLowLO
endif
endif
if opentime=CloseLONDRES then
drawrectangle(barindex[barLO],minLowLO,barindex,maxHighLO)coloured("ORANGE")fillcolor("orange",200)
drawtext("LONDRES H: #maxHighLO#",barindex[round(barLO/2)],maxHighLO+0.3*tr)
drawtext("LONDRES L: #minLowLO#",barindex[round(barLO/2)],minLowLO-0.3*tr)
prevLowLO=minLowLO
prevHighLO=maxHighLO
previdxLO=barindex
barLO=0
minLowLO=high*100
maxHighLO=0
endif
if low crosses under prevLowLO then
drawsegment(previdxLO,prevLowLO,barindex,prevLowLO)coloured("orange")
prevLowLO=0
elsif opentime=limitday and prevLowLO<>0 then
drawsegment(previdxLO,prevLowLO,barindex,prevLowLO)coloured("orange")
prevLowLO=0
elsif islastbarupdate and prevLowLO<>0 then
drawsegment(previdxLO,prevLowLO,barindex,prevLowLO)coloured("orange")
endif
if high crosses over prevHighLO then
drawsegment(previdxLO,prevHighLO,barindex,prevHighLO)coloured("orange")
prevHighLO=0
elsif opentime=limitday and prevHighLO<>0 then
drawsegment(previdxLO,prevHighLO,barindex,prevHighLO)coloured("orange")
prevHighLO=0
elsif islastbarupdate and prevHighLO<>0 then
drawsegment(previdxLO,prevHighLO,barindex,prevHighLO)coloured("orange")
endif
if ShowNylch then
//----------------------------------------------//
//-----New York AM------------------------------//
//----------------------------------------------//
once maxHighNYam=high
once minLowNYam=low
if opentime>=openNYam and opentime<=closeNYam then
barNYam=barNYam+1
if high>=maxHighNYam then
maxHighNYam=high
else
maxHighNYam=maxHighNYam
endif
if low<=minLowNYam then
minLowNYam=low
else
minLowNYam=minLowNYam
endif
endif
if opentime=closeNYam then
drawrectangle(barindex[barNYam],minLowNYam,barindex,maxHighNYam)coloured("cadetblue")fillcolor("cadetblue",200)
drawtext("US H: #maxHighNYam#",barindex[round(barNYam/2)],maxHighNYam+0.3*tr)
drawtext("US L: #minLowNYam#",barindex[round(barNYam/2)],minLowNYam-0.3*tr)
prevLowNYam=minLowNYam
prevHighNYam=maxHighNYam
previdxNYam=barindex
barNYam=0
minLowNYam=high*100
maxHighNYam=0
endif
if low crosses under prevLowNYam then
drawsegment(previdxNYam,prevLowNYam,barindex,prevLowNYam)coloured("cadetblue")
prevLowNYam=0
elsif opentime=limitday and prevLowNYam<>0 then
drawsegment(previdxNYam,prevLowNYam,barindex,prevLowNYam)coloured("cadetblue")
prevLowNYam=0
elsif islastbarupdate and prevLowNYam<>0 then
drawsegment(previdxNYam,prevLowNYam,barindex,prevLowNYam)coloured("cadetblue")
endif
if high crosses over prevHighNYam then
drawsegment(previdxNYam,prevHighNYam,barindex,prevHighNYam)coloured("cadetblue")
prevHighNYam=0
elsif opentime=limitday and prevHighNYam<>0 then
drawsegment(previdxNYam,prevHighNYam,barindex,prevHighNYam)coloured("cadetblue")
prevHighNYam=0
elsif islastbarupdate and prevHighNYam<>0 then
drawsegment(previdxNYam,prevHighNYam,barindex,prevHighNYam)coloured("cadetblue")
endif
//----------------------------------------------//
//-----New York PM -----------------------------//
//----------------------------------------------//
once maxHighNYpm=high
once minLowNYpm=low
if opentime>=openNYpm and opentime<=closeNYpm then
barNYpm=barNYpm+1
if high>=maxHighNYpm then
maxHighNYpm=high
else
maxHighNYpm=maxHighNYpm
endif
if low<=minLowNYpm then
minLowNYpm=low
else
minLowNYpm=minLowNYpm
endif
endif
if opentime=closeNYpm then
drawrectangle(barindex[barNYpm],minLowNYpm,barindex,maxHighNYpm)coloured("purple")fillcolor("purple",150)
drawtext("CLOTURE H: #maxHighNYpm#",barindex[round(barNYpm/2)],maxHighNYpm+0.3*tr)
drawtext("CLOTURE L: #minLowNYpm#",barindex[round(barNYpm/2)],minLowNYpm-0.3*tr)
prevLowNYpm=minLowNYpm
prevHighNYpm=maxHighNYpm
previdxNYpm=barindex
barNYpm=0
minLowNYpm=high*100
maxHighNYpm=0
endif
if low crosses under prevLowNYpm then
drawsegment(previdxNYpm,prevLowNYpm,barindex,prevLowNYpm)coloured("purple")
prevLowNYpm=0
elsif opentime=limitday and prevLowNYpm<>0 then
drawsegment(previdxNYpm,prevLowNYpm,barindex,prevLowNYpm)coloured("purple")
prevLowNYpm=0
elsif islastbarupdate and prevLowNYpm<>0 then
drawsegment(previdxNYpm,prevLowNYpm,barindex,prevLowNYpm)coloured("purple")
endif
if high crosses over prevHighNYpm then
drawsegment(previdxNYpm,prevHighNYpm,barindex,prevHighNYpm)coloured("purple")
prevHighNYpm=0
elsif opentime=limitday and prevHighNYpm<>0 then
drawsegment(previdxNYpm,prevHighNYpm,barindex,prevHighNYpm)coloured("purple")
prevHighNYpm=0
elsif islastbarupdate and prevHighNYpm<>0 then
drawsegment(previdxNYpm,prevHighNYpm,barindex,prevHighNYpm)coloured("purple")
endif
else
once maxHighNY=high
once minLowNY=low
if opentime>=openNY and opentime<=closeNY then
barNY=barNY+1
if high>=maxHighNY then
maxHighNY=high
else
maxHighNY=maxHighNY
endif
if low<=minLowNY then
minLowNY=low
else
minLowNY=minLowNY
endif
endif
if opentime=closeNY then
drawrectangle(barindex[barNY],minLowNY,barindex,maxHighNY)coloured("purple")fillcolor("purple",150)
drawtext("NY.H: #maxHighNY#",barindex[round(barNY/2)],maxHighNY+0.3*tr)
drawtext("NY.L: #minLowNY#",barindex[round(barNY/2)],minLowNY-0.3*tr)
prevLowNY=minLowNY
prevHighNY=maxHighNY
previdxNY=barindex
barNY=0
minLowNY=high*100
maxHighNY=0
endif
if low crosses under prevLowNY then
drawsegment(previdxNY,prevLowNY,barindex,prevLowNY)coloured("purple")
prevLowNY=0
elsif opentime=limitday and prevLowNY<>0 then
drawsegment(previdxNY,prevLowNY,barindex,prevLowNY)coloured("purple")
prevLowNY=0
elsif islastbarupdate and prevLowNY<>0 then
drawsegment(previdxNY,prevLowNY,barindex,prevLowNY)coloured("purple")
endif
if high crosses over prevHighNY then
drawsegment(previdxNY,prevHighNY,barindex,prevHighNY)coloured("purple")
prevHighNY=0
elsif opentime=limitday and prevHighNY<>0 then
drawsegment(previdxNY,prevHighNY,barindex,prevHighNY)coloured("purple")
prevHighNY=0
elsif islastbarupdate and prevHighNY<>0 then
drawsegment(previdxNY,prevHighNY,barindex,prevHighNY)coloured("purple")
endif
endif
//----------------------------------------------//
//-----Limit Day--------------------------------//
//----------------------------------------------//
if opentime=openTrueDay then
openTD=open
barTD=barindex
else
if opentime=limitday then
drawvline(barindex)style(dottedline)
//drawsegment(barTD,openTD,barindex,openTD)style(dottedline1)
endif
endif
else
drawtext("Change timeframe to 1hr or less",0,0,SansSerif,bold,34)anchor(middle,xshift,yshift)
endif
return
merci à vous je joins un graphe
Vous pouvez ajouter une variable qui calcule constamment le point médian.
//----------------------------------------------//
//PRC_ICT Killzones and Pivots
//version = 0
//10.10.2024
//Iván González @ www.prorealcode.com
//Sharing ProRealTime knowledge
//----------------------------------------------//
//-----INPUTS-----------------------------------//
//----------------------------------------------//
openAS=020000
closeAS=060000
openLO=080000
closeLO=110000
openNYam=153000
closeNYam=170000
openNYlch=180000
closeNYlch=190000
openNYpm=193000
closeNYpm=220000
showNylch=1
openNY=openNYam
closeNY=closeNYpm
limitday=180000
openTrueDay=060000
//ShowNylch=1
midZone = undefined
if gettimeframe<=3600 then
//----------------------------------------------//
//-----ASIA Zone--------------------------------//
//----------------------------------------------//
once maxHighAS=high
once minLowAS=low
if opentime>=openAS and opentime<=closeAS then
barAS=barAS+1
if high>=maxHighAS then
maxHighAS=high
else
maxHighAS=maxHighAS
endif
if low<=minLowAS then
minLowAS=low
else
minLowAS=minLowAS
endif
midZone = (maxHighAS + minLowAS) / 2
endif
if opentime=closeAS then
drawrectangle(barindex[barAS],minLowAS,barindex,maxHighAS)coloured("blue")fillcolor("blue",30)
drawtext("AS.H: #maxHighAS#",barindex[round(barAS/2)],maxHighAS+0.3*tr)
drawtext("AS.L: #minLowAS#",barindex[round(barAS/2)],minLowAS-0.3*tr)
prevLowAS=minLowAS
prevHighAS=maxHighAS
previdxAS=barindex
barAS=0
minLowAS=high*100
maxHighAS=0
endif
if low crosses under prevLowAS then
drawsegment(previdxAS,prevLowAS,barindex,prevLowAS)coloured("blue")
prevLowAS=0
elsif opentime=limitday and prevLowAS<>0 then
drawsegment(previdxAS,prevLowAS,barindex,prevLowAS)coloured("blue")
prevLowAS=0
elsif islastbarupdate and prevLowAS<>0 then
drawsegment(previdxAS,prevLowAS,barindex,prevLowAS)coloured("blue")
endif
if high crosses over prevHighAS then
drawsegment(previdxAS,prevHighAS,barindex,prevHighAS)coloured("blue")
prevHighAS=0
elsif opentime=limitday and prevHighAS<>0 then
drawsegment(previdxAS,prevHighAS,barindex,prevHighAS)coloured("blue")
prevHighAS=0
elsif islastbarupdate and prevHighAS<>0 then
drawsegment(previdxAS,prevHighAS,barindex,prevHighAS)coloured("blue")
endif
//----------------------------------------------//
//-----London Zone------------------------------//
//----------------------------------------------//
once maxHighLO=high
once minLowLO=low
if opentime>=openLO and opentime<=closeLO then
barLO=barLO+1
if high>=maxHighLO then
maxHighLO=high
else
maxHighLO=maxHighLO
endif
if low<=minLowLO then
minLowLO=low
else
minLowLO=minLowLO
endif
midZone = (maxHighLO + minLowLO) / 2
endif
if opentime=closeLO then
drawrectangle(barindex[barLO],minLowLO,barindex,maxHighLO)coloured("red")fillcolor("red",30)
drawtext("LO.H: #maxHighLO#",barindex[round(barLO/2)],maxHighLO+0.3*tr)
drawtext("LO.L: #minLowLO#",barindex[round(barLO/2)],minLowLO-0.3*tr)
prevLowLO=minLowLO
prevHighLO=maxHighLO
previdxLO=barindex
barLO=0
minLowLO=high*100
maxHighLO=0
endif
if low crosses under prevLowLO then
drawsegment(previdxLO,prevLowLO,barindex,prevLowLO)coloured("red")
prevLowLO=0
elsif opentime=limitday and prevLowLO<>0 then
drawsegment(previdxLO,prevLowLO,barindex,prevLowLO)coloured("red")
prevLowLO=0
elsif islastbarupdate and prevLowLO<>0 then
drawsegment(previdxLO,prevLowLO,barindex,prevLowLO)coloured("red")
endif
if high crosses over prevHighLO then
drawsegment(previdxLO,prevHighLO,barindex,prevHighLO)coloured("red")
prevHighLO=0
elsif opentime=limitday and prevHighLO<>0 then
drawsegment(previdxLO,prevHighLO,barindex,prevHighLO)coloured("red")
prevHighLO=0
elsif islastbarupdate and prevHighLO<>0 then
drawsegment(previdxLO,prevHighLO,barindex,prevHighLO)coloured("red")
endif
if ShowNylch then
//----------------------------------------------//
//-----New York AM------------------------------//
//----------------------------------------------//
once maxHighNYam=high
once minLowNYam=low
if opentime>=openNYam and opentime<=closeNYam then
barNYam=barNYam+1
if high>=maxHighNYam then
maxHighNYam=high
else
maxHighNYam=maxHighNYam
endif
if low<=minLowNYam then
minLowNYam=low
else
minLowNYam=minLowNYam
endif
midZone = (maxHighNYam + minLowNYam) / 2
endif
if opentime=closeNYam then
drawrectangle(barindex[barNYam],minLowNYam,barindex,maxHighNYam)coloured("green")fillcolor("green",30)
drawtext("NYam.H: #maxHighNYam#",barindex[round(barNYam/2)],maxHighNYam+0.3*tr)
drawtext("NYam.L: #minLowNYam#",barindex[round(barNYam/2)],minLowNYam-0.3*tr)
prevLowNYam=minLowNYam
prevHighNYam=maxHighNYam
previdxNYam=barindex
barNYam=0
minLowNYam=high*100
maxHighNYam=0
endif
if low crosses under prevLowNYam then
drawsegment(previdxNYam,prevLowNYam,barindex,prevLowNYam)coloured("green")
prevLowNYam=0
elsif opentime=limitday and prevLowNYam<>0 then
drawsegment(previdxNYam,prevLowNYam,barindex,prevLowNYam)coloured("green")
prevLowNYam=0
elsif islastbarupdate and prevLowNYam<>0 then
drawsegment(previdxNYam,prevLowNYam,barindex,prevLowNYam)coloured("green")
endif
if high crosses over prevHighNYam then
drawsegment(previdxNYam,prevHighNYam,barindex,prevHighNYam)coloured("green")
prevHighNYam=0
elsif opentime=limitday and prevHighNYam<>0 then
drawsegment(previdxNYam,prevHighNYam,barindex,prevHighNYam)coloured("green")
prevHighNYam=0
elsif islastbarupdate and prevHighNYam<>0 then
drawsegment(previdxNYam,prevHighNYam,barindex,prevHighNYam)coloured("green")
endif
//----------------------------------------------//
//-----New York lunch Zone----------------------//
//----------------------------------------------//
once maxHighNYlch=high
once minLowNYlch=low
if opentime>=openNYlch and opentime<=closeNYlch then
barNYlch=barNYlch+1
if high>=maxHighNYlch then
maxHighNYlch=high
else
maxHighNYlch=maxHighNYlch
endif
if low<=minLowNYlch then
minLowNYlch=low
else
minLowNYlch=minLowNYlch
endif
endif
if opentime=closeNYlch then
drawrectangle(barindex[barNYlch],minLowNYlch,barindex,maxHighNYlch)coloured("yellow")fillcolor("yellow",30)
prevLowNYlch=minLowNYlch
prevHighNYlch=maxHighNYlch
previdxNYlch=barindex
barNYlch=0
minLowNYlch=high*100
maxHighNYlch=0
endif
//----------------------------------------------//
//-----New York PM -----------------------------//
//----------------------------------------------//
once maxHighNYpm=high
once minLowNYpm=low
if opentime>=openNYpm and opentime<=closeNYpm then
barNYpm=barNYpm+1
if high>=maxHighNYpm then
maxHighNYpm=high
else
maxHighNYpm=maxHighNYpm
endif
if low<=minLowNYpm then
minLowNYpm=low
else
minLowNYpm=minLowNYpm
endif
midZone = (maxHighNYpm + minLowNYpm) / 2
endif
if opentime=closeNYpm then
drawrectangle(barindex[barNYpm],minLowNYpm,barindex,maxHighNYpm)coloured("purple")fillcolor("purple",30)
drawtext("NYpm.H: #maxHighNYpm#",barindex[round(barNYpm/2)],maxHighNYpm+0.3*tr)
drawtext("NYpm.L: #minLowNYpm#",barindex[round(barNYpm/2)],minLowNYpm-0.3*tr)
prevLowNYpm=minLowNYpm
prevHighNYpm=maxHighNYpm
previdxNYpm=barindex
barNYpm=0
minLowNYpm=high*100
maxHighNYpm=0
endif
if low crosses under prevLowNYpm then
drawsegment(previdxNYpm,prevLowNYpm,barindex,prevLowNYpm)coloured("purple")
prevLowNYpm=0
elsif opentime=limitday and prevLowNYpm<>0 then
drawsegment(previdxNYpm,prevLowNYpm,barindex,prevLowNYpm)coloured("purple")
prevLowNYpm=0
elsif islastbarupdate and prevLowNYpm<>0 then
drawsegment(previdxNYpm,prevLowNYpm,barindex,prevLowNYpm)coloured("purple")
endif
if high crosses over prevHighNYpm then
drawsegment(previdxNYpm,prevHighNYpm,barindex,prevHighNYpm)coloured("purple")
prevHighNYpm=0
elsif opentime=limitday and prevHighNYpm<>0 then
drawsegment(previdxNYpm,prevHighNYpm,barindex,prevHighNYpm)coloured("purple")
prevHighNYpm=0
elsif islastbarupdate and prevHighNYpm<>0 then
drawsegment(previdxNYpm,prevHighNYpm,barindex,prevHighNYpm)coloured("purple")
endif
else
once maxHighNY=high
once minLowNY=low
if opentime>=openNY and opentime<=closeNY then
barNY=barNY+1
if high>=maxHighNY then
maxHighNY=high
else
maxHighNY=maxHighNY
endif
if low<=minLowNY then
minLowNY=low
else
minLowNY=minLowNY
endif
midZone = (maxHighNY + minLowNY) / 2
endif
if opentime=closeNY then
drawrectangle(barindex[barNY],minLowNY,barindex,maxHighNY)coloured("purple")fillcolor("purple",30)
drawtext("NY.H: #maxHighNY#",barindex[round(barNY/2)],maxHighNY+0.3*tr)
drawtext("NY.L: #minLowNY#",barindex[round(barNY/2)],minLowNY-0.3*tr)
prevLowNY=minLowNY
prevHighNY=maxHighNY
previdxNY=barindex
barNY=0
minLowNY=high*100
maxHighNY=0
endif
if low crosses under prevLowNY then
drawsegment(previdxNY,prevLowNY,barindex,prevLowNY)coloured("purple")
prevLowNY=0
elsif opentime=limitday and prevLowNY<>0 then
drawsegment(previdxNY,prevLowNY,barindex,prevLowNY)coloured("purple")
prevLowNY=0
elsif islastbarupdate and prevLowNY<>0 then
drawsegment(previdxNY,prevLowNY,barindex,prevLowNY)coloured("purple")
endif
if high crosses over prevHighNY then
drawsegment(previdxNY,prevHighNY,barindex,prevHighNY)coloured("purple")
prevHighNY=0
elsif opentime=limitday and prevHighNY<>0 then
drawsegment(previdxNY,prevHighNY,barindex,prevHighNY)coloured("purple")
prevHighNY=0
elsif islastbarupdate and prevHighNY<>0 then
drawsegment(previdxNY,prevHighNY,barindex,prevHighNY)coloured("purple")
endif
endif
//----------------------------------------------//
//-----Limit Day--------------------------------//
//----------------------------------------------//
if opentime=openTrueDay then
openTD=open
barTD=barindex
else
if opentime=limitday then
drawvline(barindex)style(dottedline)
drawsegment(barTD,openTD,barindex,openTD)style(dottedline1)
endif
endif
//----------------------------------------------//
//-----% variation Day--------------------------//
//----------------------------------------------//
if intradaybarindex=0 then
varhigh=round((dhigh(1)/dopen(1)-1)*100,2)
varlow=round((dlow(1)/dopen(1)-1)*100,2)
drawtext("VarHigh=#varhigh#%",barindex[round(variationbars*0.5)],dhigh(1))coloured("Green")
drawtext("VarLow=#varlow#%",barindex[round(variationbars*0.5)],dlow(1))coloured("red")
variationbars=0
else
variationbars=variationbars+1
endif
else
drawtext("Change timeframe to 1hr or less",0,0,SansSerif,bold,34)anchor(middle,xshift,yshift)
endif
return midZone AS "Middle Zone"
merci beaucoup
Indicateur ICT Killzones : tracer la middle des zones
This topic contains 2 replies,
has 2 voices, and was last updated by
larouedegann
2 days, 15 hours ago.
| Forum: | Support Plateforme : Graphiques, Données & Courtiers |
| Language: | French |
| Started: | 03/02/2026 |
| Status: | Active |
| Attachments: | 1 files |
The information collected on this form is stored in a computer file by ProRealCode to create and access your ProRealCode profile. This data is kept in a secure database for the duration of the member's membership. They will be kept as long as you use our services and will be automatically deleted after 3 years of inactivity. Your personal data is used to create your private profile on ProRealCode. This data is maintained by SAS ProRealCode, 407 rue Freycinet, 59151 Arleux, France. If you subscribe to our newsletters, your email address is provided to our service provider "MailChimp" located in the United States, with whom we have signed a confidentiality agreement. This company is also compliant with the EU/Swiss Privacy Shield, and the GDPR. For any request for correction or deletion concerning your data, you can directly contact the ProRealCode team by email at privacy@prorealcode.com If you would like to lodge a complaint regarding the use of your personal data, you can contact your data protection supervisory authority.