I have coded after your kind help. A few queries……….
ahh see that they appear after sent
It runs but only buys and not sells
It does sell … I tested it.
Do you mean it doesn’t sellshort?
Change to below and the code will open short trades ( I tested it) …
IF flag = 3 AND c6 THEN
SELLshort 1 PERPOINT AT MARKET
flag = 0
ENDIF

IF flag = 4 AND c8 THEN
exitshort 1 PERPOINT AT MARKET
flag = 0
ENDIF
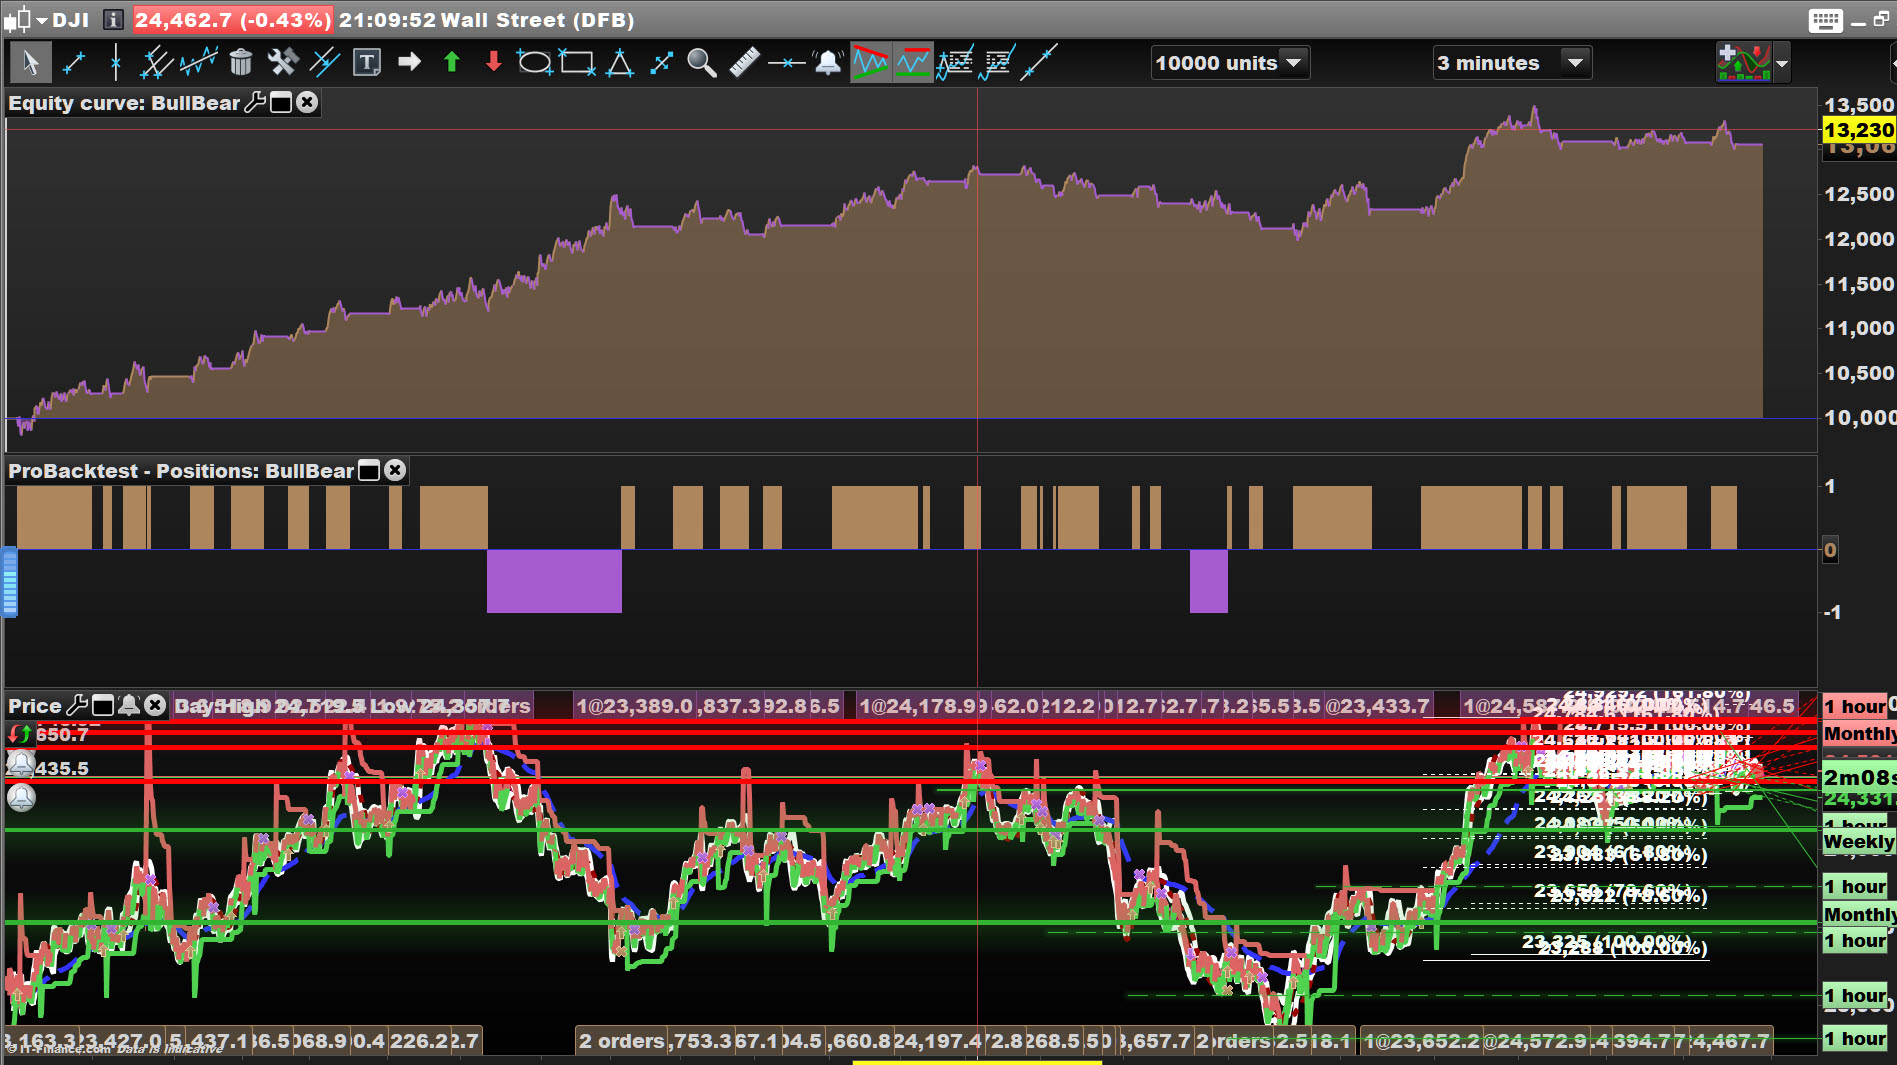
I changed your buy and sell to sellshort and exitshort and vice versa and ran on 3min TF and got attached … looks like good potential??
Spread = 4
Hi bearbull, glad to see you’ve got your code working. Just so you know, you don’t have to re-enter the Hull code every time you refer to it. Once HULLa and HULLb have been defined you can reference them anywhere in the code.
Similarly, your c4 and c6 are the same, as are c2 and c8. Once a condition is defined it can be re-used anywhere.
This won’t make any difference to the way it works, but should make the logic of it clearer.
GraHal thanks for that.
Unfortunately, it only SELLS now and does not BUY,
The idea is say when it sells and reaches the point where it exits (NB the exit is now the signal to go long – in the long criteria). The trade is then long until it exits which would trigger the short and so forth………………….I think i have explained it in my gibberish – LOL.
// Definition of code parameters
DEFPARAM CumulateOrders = False // Cumulating positions deactivated

// Conditions to enter long positions
if RSI[14](close) crosses under 29 then
flag = 1
endif

Perioda= 15
innera = 2*weightedaverage[round( Perioda/2)](close)-weightedaverage[Perioda](close)
HULLa = weightedaverage[round(sqrt(Perioda))](innera)

Periodb= 30
innerb = 2*weightedaverage[round( Periodb/2)](close)-weightedaverage[Periodb](close)
HULLb = weightedaverage[round(sqrt(Periodb))](innerb)

c2 = HULLa crosses over HULLb

IF flag = 1 AND c2 THEN
BUY 1 PERPOINT AT MARKET
flag = 0
ENDIF

// Conditions to exit long positions
if RSI[14](close) crosses over 71 then
flag = 2
endif

Perioda= 15
innera = 2*weightedaverage[round( Perioda/2)](close)-weightedaverage[Perioda](close)
HULLa = weightedaverage[round(sqrt(Perioda))](innera)

Periodb= 30
innerb = 2*weightedaverage[round( Periodb/2)](close)-weightedaverage[Periodb](close)
HULLb = weightedaverage[round(sqrt(Periodb))](innerb)

c4 = HULLa crosses under HULLb

IF flag = 2 AND c4 THEN
SELL 1 PERPOINT AT MARKET
flag = 0
ENDIF

// Conditions to enter short positions
if RSI[14](close) crosses over 71 then
flag = 3
endif

Perioda= 15
innera = 2*weightedaverage[round( Perioda/2)](close)-weightedaverage[Perioda](close)
HULLa = weightedaverage[round(sqrt(Perioda))](innera)

Periodb= 30
innerb = 2*weightedaverage[round( Periodb/2)](close)-weightedaverage[Periodb](close)
HULLb = weightedaverage[round(sqrt(Periodb))](innerb)

c6 = HULLa crosses under HULLb

IF flag = 3 AND c6 THEN
sellshort 1 PERPOINT AT MARKET
flag = 0
ENDIF

// Conditions to exit short positions
if RSI[14](close) crosses under 29 then
flag = 4
endif

Perioda= 15
innera = 2*weightedaverage[round( Perioda/2)](close)-weightedaverage[Perioda](close)
HULLa = weightedaverage[round(sqrt(Perioda))](innera)

Periodb= 30
innerb = 2*weightedaverage[round( Periodb/2)](close)-weightedaverage[Periodb](close)
HULLb = weightedaverage[round(sqrt(Periodb))](innerb)

c8 = HULLa crosses over HULLb

IF flag = 4 AND c8 THEN
exitshort 1 PERPOINT AT MARKET
flag = 0
ENDIF
What does “DEFPARAM CumulateOrders = False // Cumulating positions deactivated” mean??
CumulateOrders
The documentation found under ‘Help’ on these forums is a very useful source of information.
Unfortunately, it only SELLS now and does not BUY,
Hahaha it can’t sell what it has not bought! 🙂
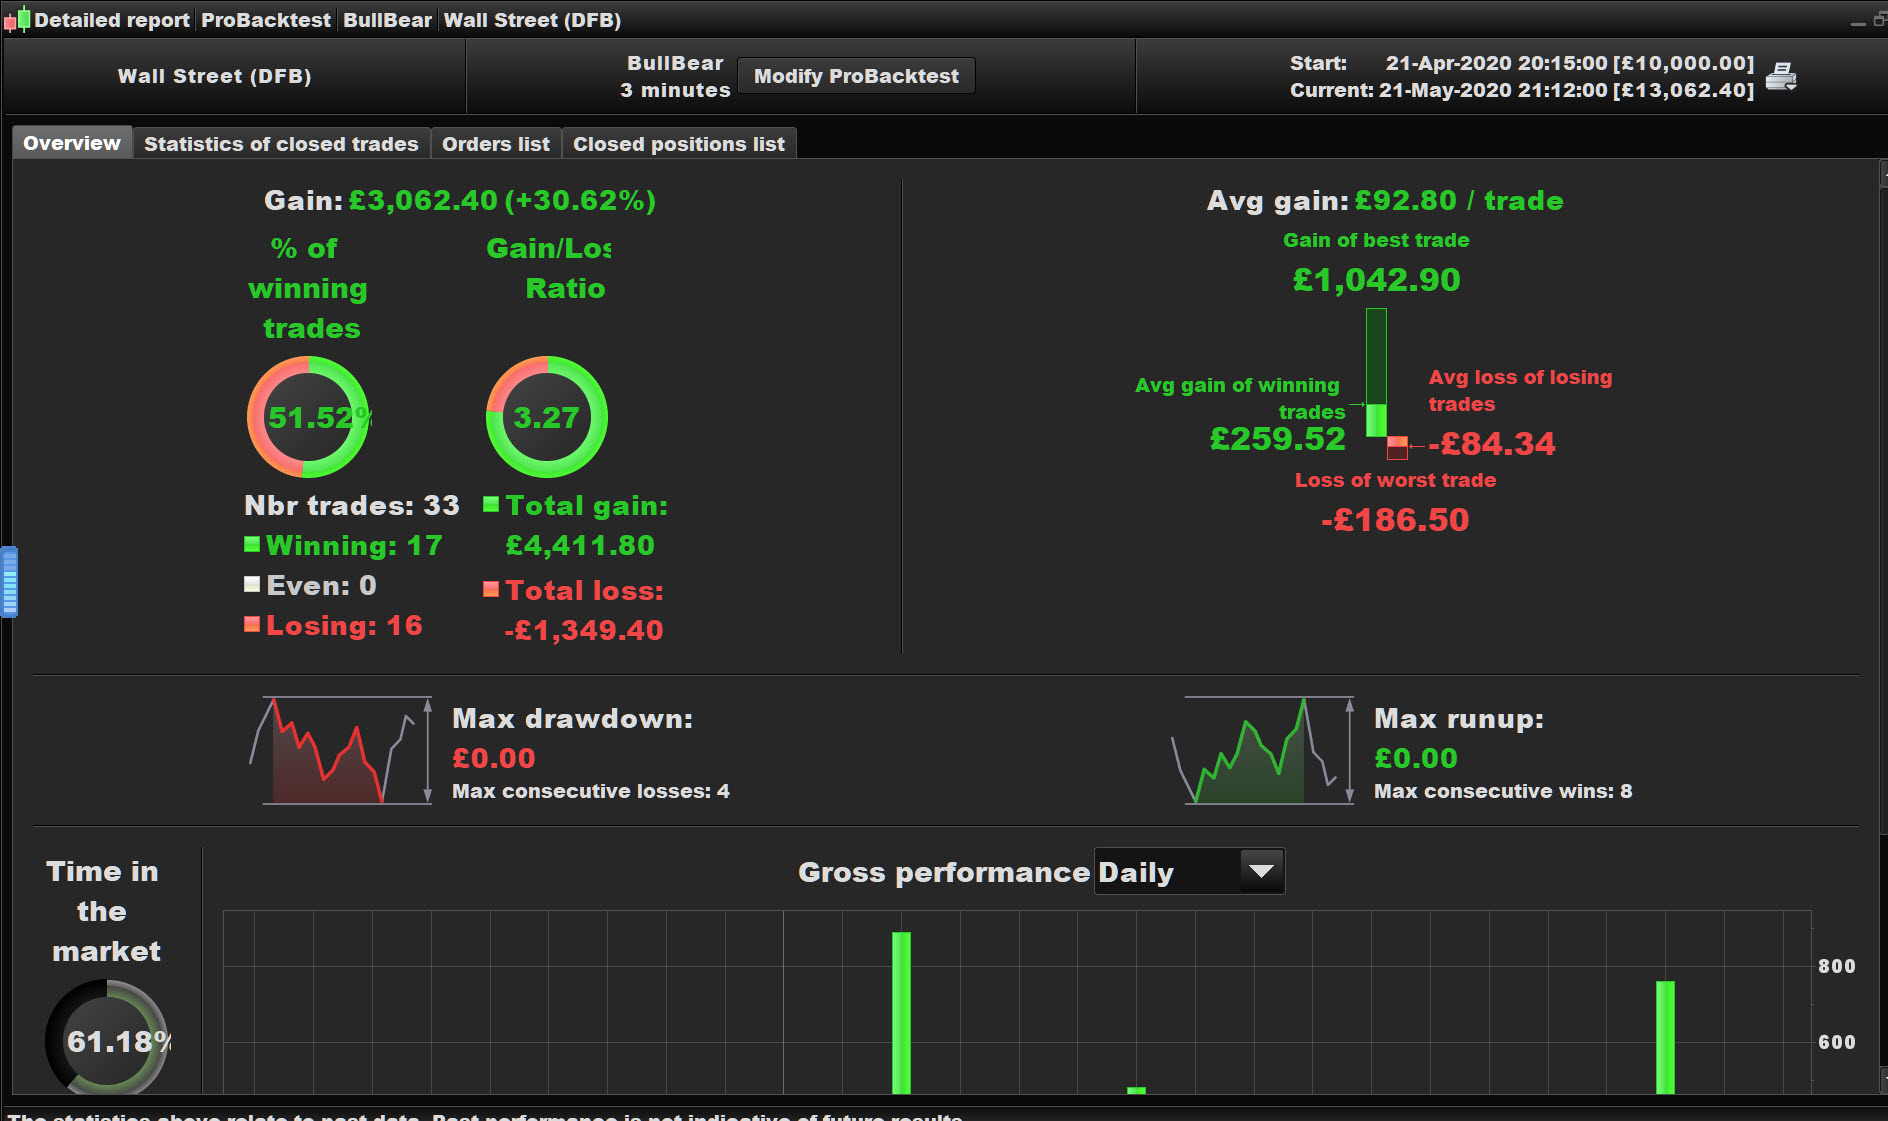
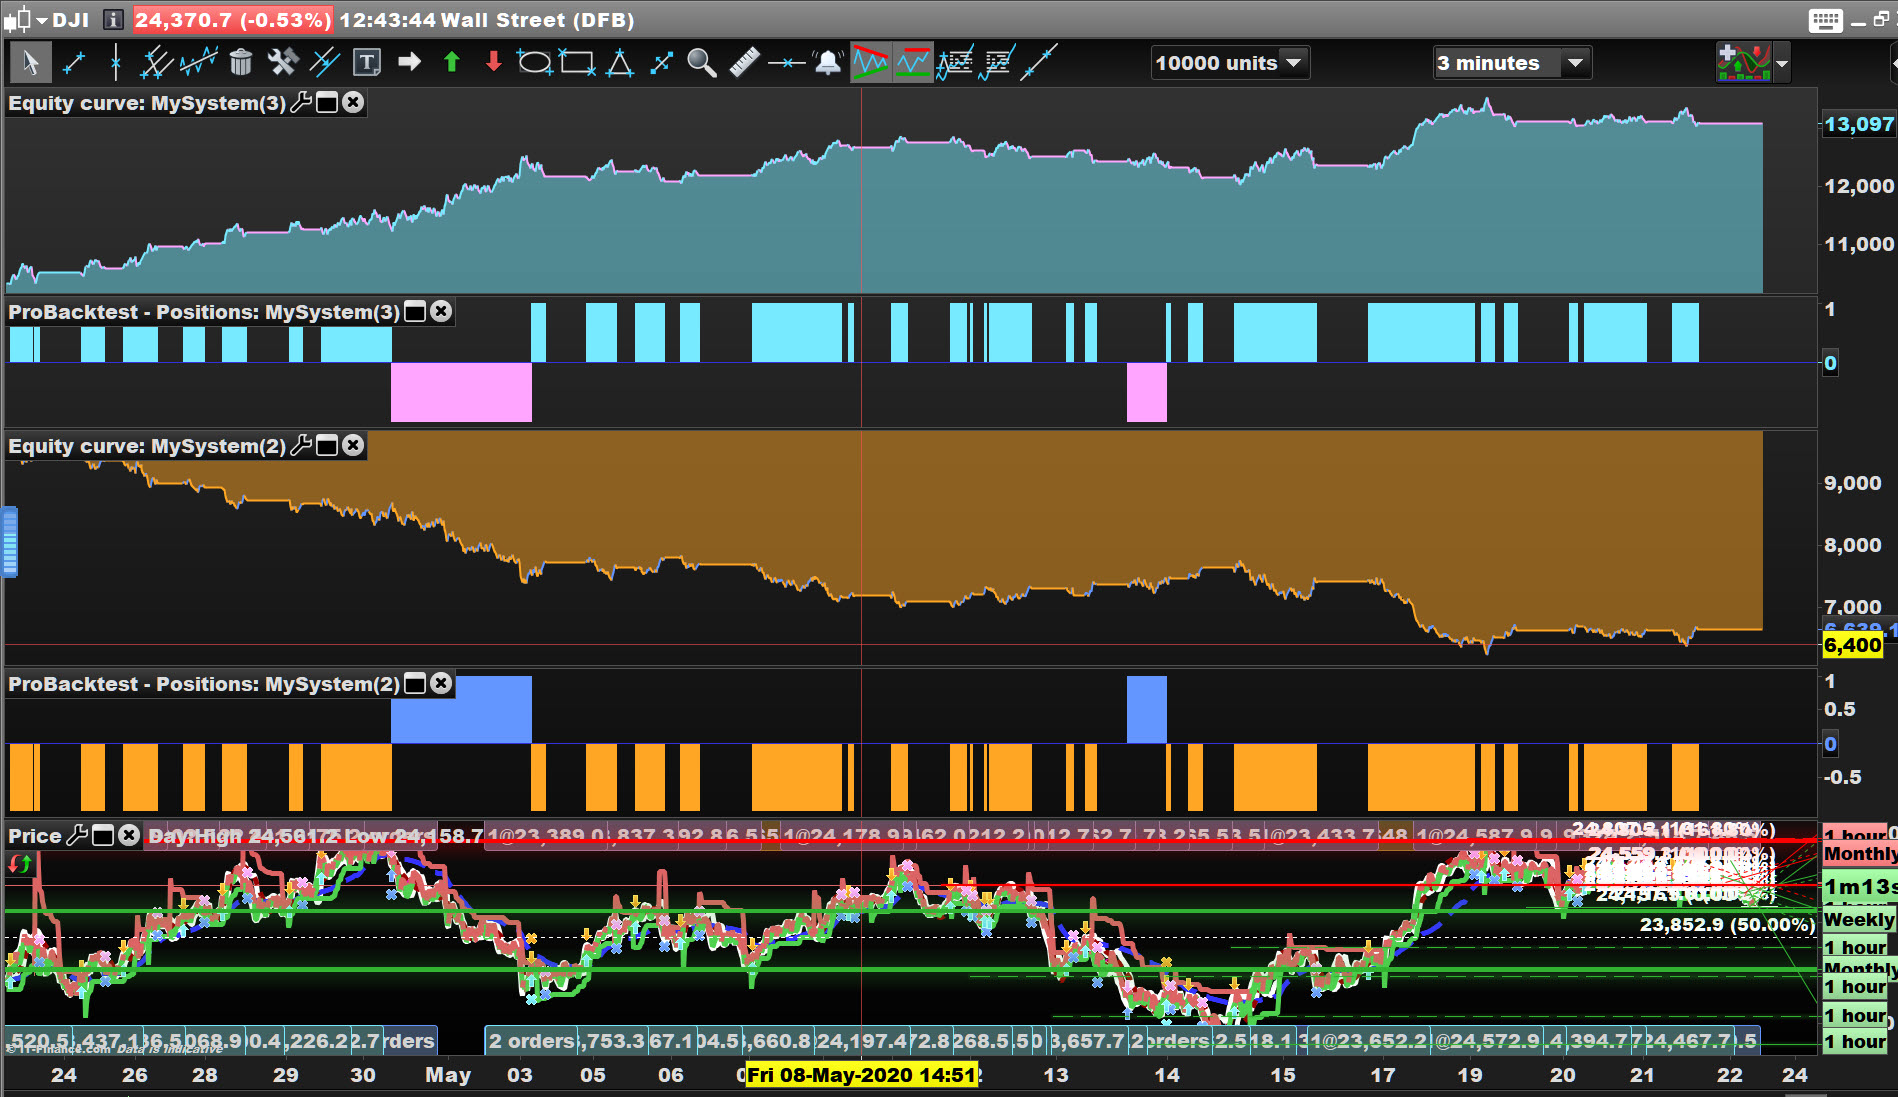
Attached shows your code as the lower curve.
I swapped buy, sell, sellshort, exitshort and I got the upper curve.
Attached is the code for the upper curve.
Grahal, the two charts look like identical opposites LOL.
I will take a look on my system and see………but what a vast improvement just by looking at it. Thank you Grahal for your help.
Grahal,
LOL, So its now buying at the top of the RSI and selling at the bottom of the RSI………………………I want the opposite…..heh. heh……thank you for your help anyway.
SELL at top of the RSI when conditions are met and exit at the bottom of the RSI when conditions are met. Of course after the short exit at the bottom of the RSI the conditions will have met of a buy signal which then will only be closed or exited at the top of the RSI this all in conjunction of the 15/30 HULL moving average.
I trade it manually but have been thinking of programming it automatically.
…I want the opposite
Didn’t you have the opposite though and it was a loser on every time frame I tried it on … 5 secs to 1 hour.
What timeframe and instrument are you designing the strategy for? You have never mentioned?
I feel that Markets / Professionals are faking us … they get in early and have made their profit and are selling just about when we are thinking about buying?? So then we end up sitting on losses until the next wave / cycle??
Maybe it’s time to play them at their own game!!?? 🙂
So its now buying at the top of the RSI and selling at the bottom of the RSI
Maybe it just needs the values tweaking that you consider RSI top and bottom?
For example RSI 60 and 40 (instead of 79 and 21) … have you tried optimising RSI values?
GraHal
I like your ‘out of the box’ contrarian thinking with this. And doing the opposite seems to be working LOL.
I haven’t fiddled with the RSI, that is a good point and will take a look.
Just that I wanted to capture the up moves together with the down moves, currently only the down moves are captured.
I was using the 5000 tick time frame for smoothness, this to be applied to equities Dow, FTSE, DAX and US500 for starters.
Thanking you in advance
currently only the down moves are captured.
Check out the price curve against the upper equity curve … its making money during up and down trends.
And see that pink block of short only during that long down trend and 4 or 5 turqouise ( 🙂 ) blocks of Longs during the long uptrend?
I know which I’d rather put my money against? 🙂