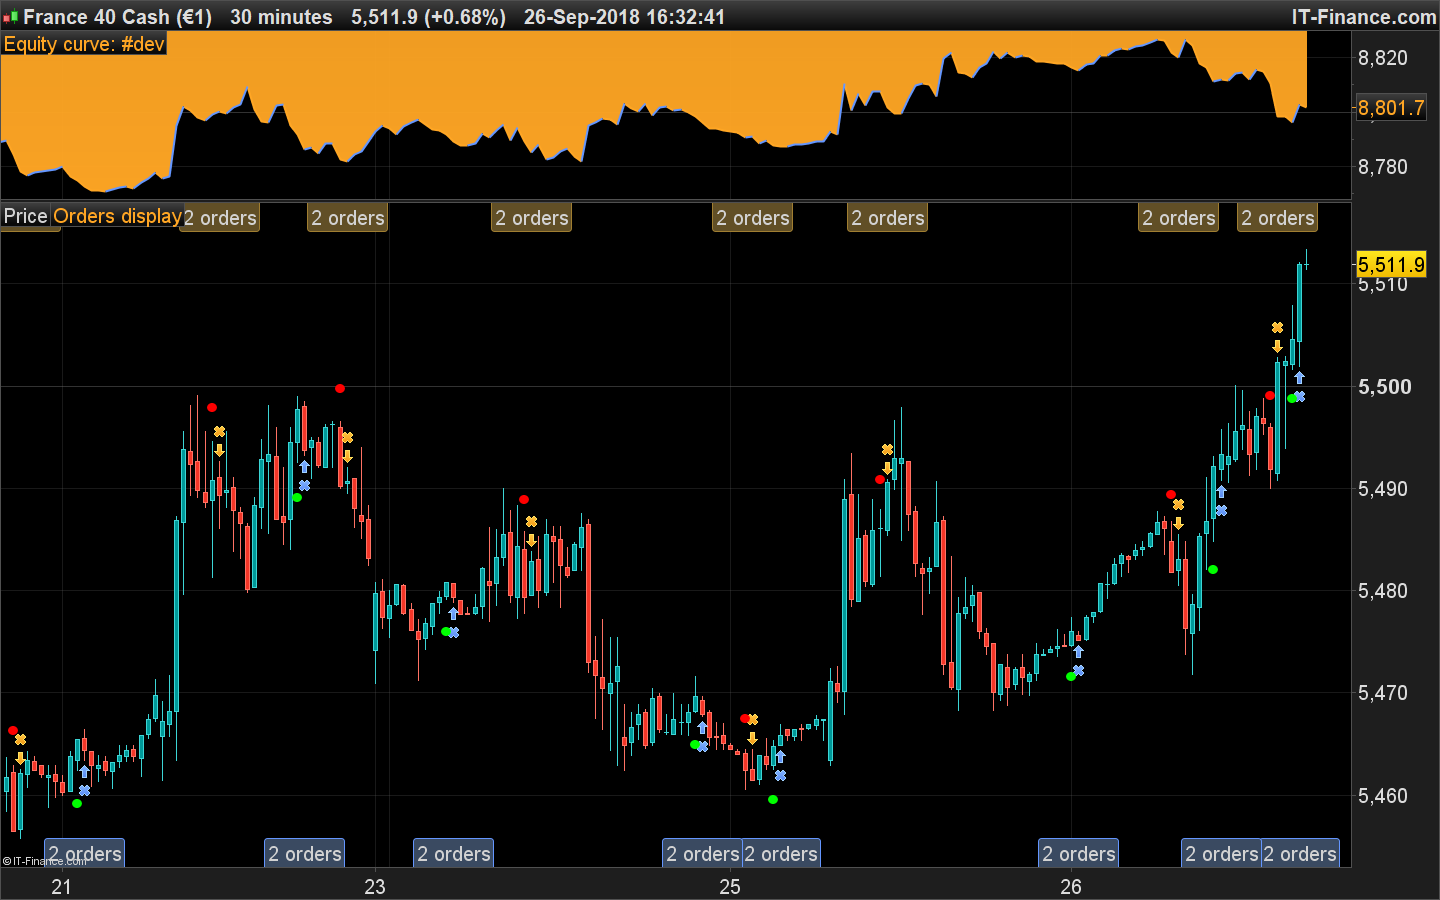
I want to show the output from this indicator via two lines that cross to provide signals for an auto strategy. Can someone advise me on how to do this please. Alternatively, is there a way of writing code to trade off the colour of the dots?
Regards
Dymjohn
Yes Nicolas, I remember seeing a version of the code in MT4 which shows crosses but no longer have it as I mostly trade on Pro Real time. It has some uses as crosses in Auto trading but I also wondered if its possible to write a strategy which places orders as a result of the “dots” instead?
Here is the complete code that embed at the same time the QMP Filter indicator and the automated trading program:
// Definition of code parameters
DEFPARAM CumulateOrders = False // Cumulating positions deactivated

//PRC_QMP Filter | indicator
//29.09.2016
//Nicolas @ www.prorealcode.com
//Sharing ProRealTime knowledge

//--- parameters
short = 12
long = 26
signal = 9
RSIPeriod = 8
SF = 1
QQE = 3
//---

// --- MACD ZeroLag
EMAshort1 = exponentialaverage[short](close)
EMAshort2 = exponentialaverage[short](EMAshort1)
DifferenceShort = EMAshort1 - EMAshort2
ZeroLagShort = EMAshort1 + DifferenceShort

EMAlong1 = exponentialaverage[long](close)
EMAlong2 = exponentialaverage[long](EMAlong1)
DifferenceLong = EMAlong1 - EMAlong2
ZeroLagLong = EMAlong1 + DifferenceLong

ZeroLagMACD = ZeroLagShort - ZeroLagLong

signal1=ExponentialAverage[signal](ZEROLAGMACD)
signal2=ExponentialAverage[signal](signal1)
DIFFERENCE2=signal1-signal2

SignalMACD=signal1+DIFFERENCE2

// --- QQE
WildersPeriod = RSIPeriod * 2 - 1
if barindex>WildersPeriod then

MyRsi = rsi[RSIPeriod](close)
RsiMa = exponentialaverage[SF](MyRsi)
AtrRsi = abs(RsiMa[1] - RsiMa)
MaAtrRsi = exponentialaverage[WildersPeriod](AtrRsi)
dar = exponentialaverage[WildersPeriod](MaAtrRsi) * QQE

trr=TrLevelSlow[1]
dv = trr
if RsiMA[0]<trr then
trr = RsiMA[0] + dar
if(RsiMA[1]<dv) then
if(trr>dv) then
trr=dv
endif
endif
elsif RsiMA[0]>trr then
trr = RsiMA[0] - dar
if(RsiMA[1]>dv) then
if(trr<dv) then
trr=dv
endif
endif

endif
TrLevelSlow=trr
endif

// --- signals
if zerolagMACD>=signalMACD and RsiMA>=trr and lasttrend<>1 then
lasttrend=1
elsif zerolagMACD<signalMACD and RsiMA<trr and lasttrend<>-1 then
lasttrend=-1
endif

gobuy = lasttrend=1 and lasttrend[1]=-1
gosell = lasttrend=-1 and lasttrend[1]=1

if not longonmarket and gobuy then
buy at market
endif

if not shortonmarket and gosell then
sellshort at market
endif
Hi everybody
The QMP Filter have been very useful for my manual trading in many markets and I’ve learned to avoid many of the false signals by the help of other indicators (and logical price action).
My coding skills are limited and therefore I ask if Nicolas or anybody else can modify the QMP Filter indicator so the signals can be used in building an automated strategy in the “simplified creation” window?
The only indicators that can be used in the “simplified creation” window are those that PRT have available in their platform. I would suggest watching the training videos and checking out all the coding examples in the forums and in the extensive library so that you can learn how easy it is to hard code indicators into your own strategies.
Learning Videos
QMP Filter indicator so the signals can be used in building an automated strategy
Hasn’t Nicolas already provided a System using the QMP Indicator … 3 posts above?
Hasn’t Nicolas already provided a System using the QMP Indicator … 3 posts above?
Yes – but perhaps it does not exactly match exactly what kj1988 wants in the way of a strategy.
He has two options because the QMP Filter is not an indicator that is available as a standard indicator on the PRT platform and so cannot be used in the “simplified creation” window. He must learn to code strategies by watching the videos and studying the forums and library or describe exactly the strategy that he has in mind and hope that some kind individual on the forums with more experience will code it for him. Your understanding of code is getting pretty good so I volunteer you GraHal!. The rest of us are way too busy telling newbies that they have not followed the few very simple forum rules! The sooner this worldwide lock down ends the sooner we can stop spending 99% of the day telling people who have suddenly decided that want to get rich via trading that they did not read the few simple rules! 🙂
Rant over…..!
The rest of us are way too busy telling newbies that they have not followed the few very simple forum rules!
I strongly sympathise with your plight!
The Forum Rules in the massive yellow box are being scrolled straight past unread, even when posting!? It beggars belief how unobservant some folk are that they post code and don’t ask themselves … “Why does my code look different than code that others have posted”?? Errhh HELLO … it’s because you didn’t use the ‘Insert PRT Code’ button on the toolbar!!
I think newbies should be required to undertake a multiple choice questionnaire, the correct answers to which make them read and understand the Forum Rules!
Questionnaire could be marked automatically online and would require 100% pass rate before newbies can move on to click the Join button.
IG do it (when opening account) to make sure new traders understand what they are getting into.
I’d best stop, else you’ll be telling me off for going off Topic! 🙂
so I volunteer you GraHal!
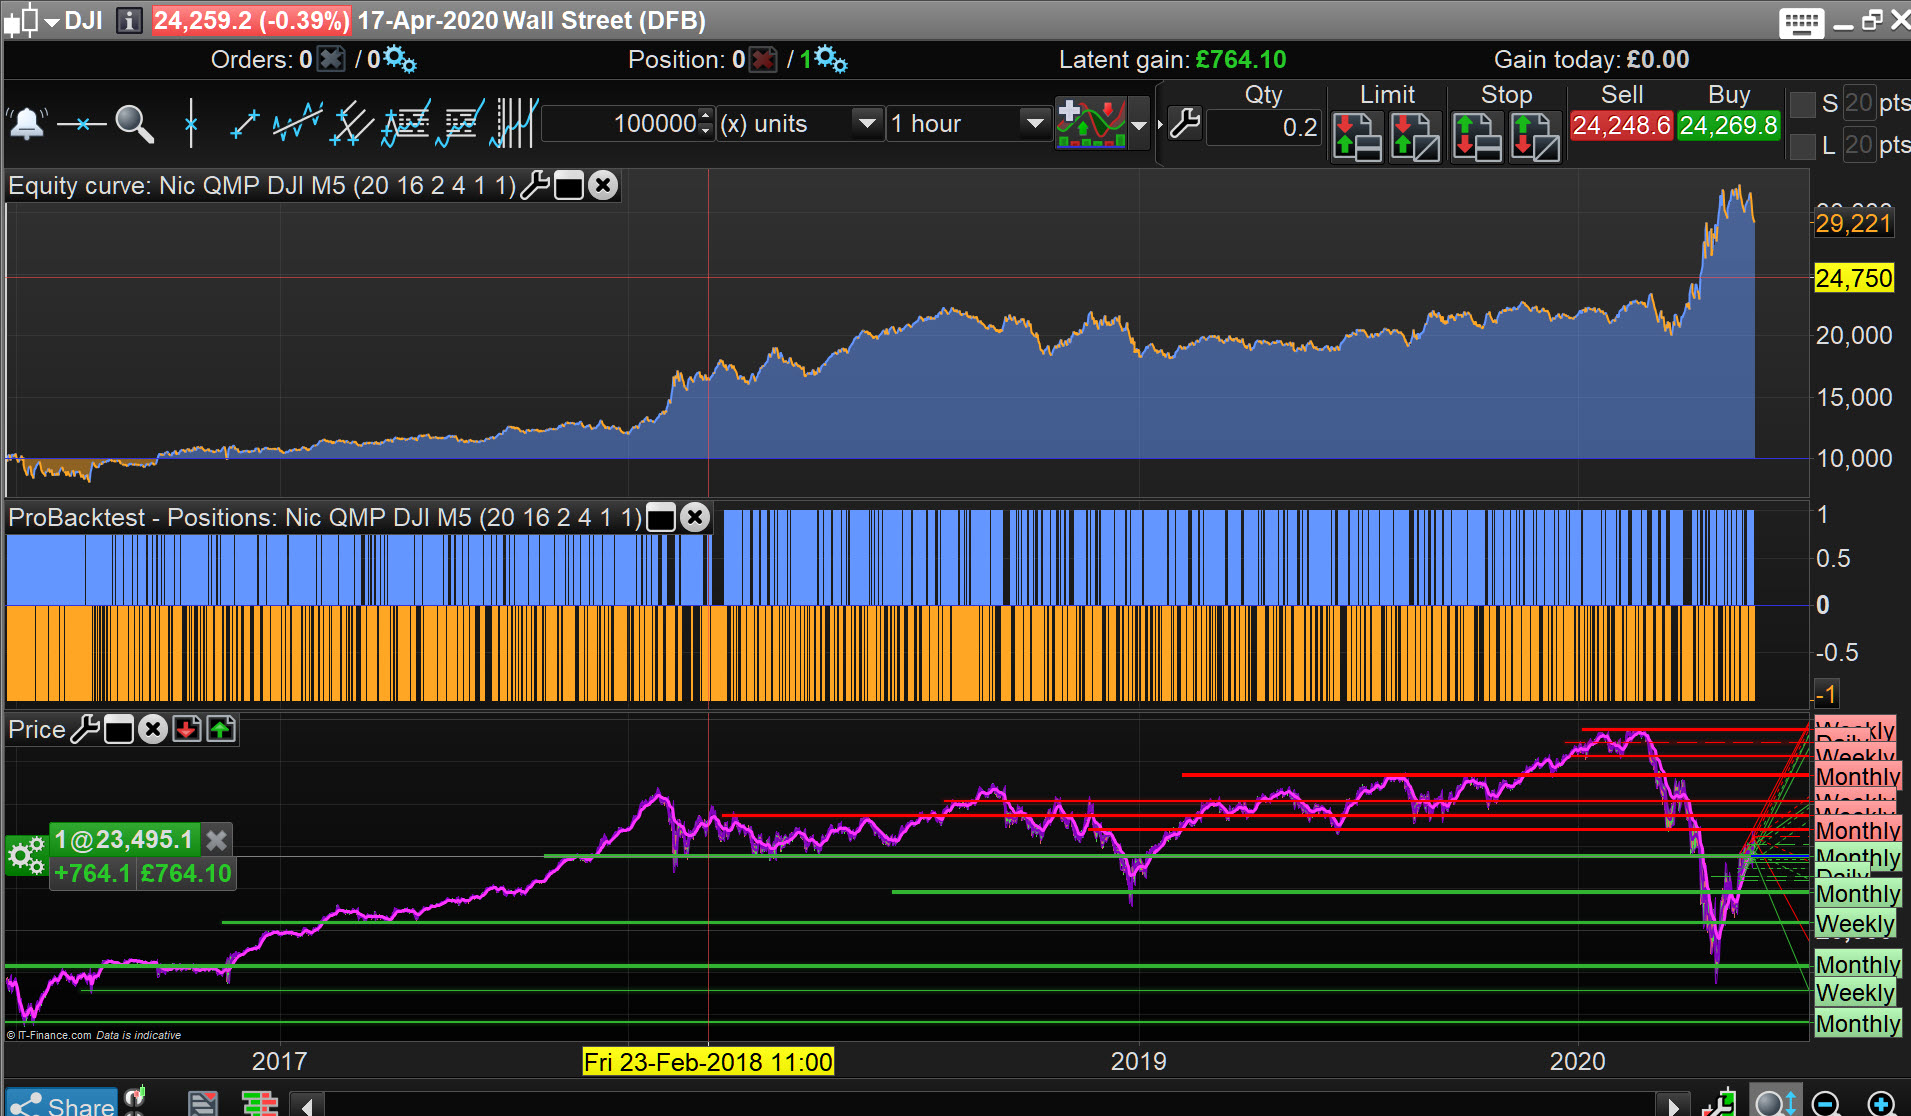
Didn’t even have to read the code, just some coarse optimising so I’m sure it can be improved more?
Please post here if anybody does make improvements?
EDIT / PS
TF is H1 (.itf title says M5) and spread = 4
MODS
Please delete the M5 .itf as I have also ‘entered values in the optimiser’ for the H1 .itf.
Thank You
With the QMP FILTER DOTs that appear on chart, what would be the code snippet to get the LOW price of the candle where the QMP signal occurred. How to get the low or close at GOBUY. it gives true or false return at the moment.
Thanks
The below code of the indicator return the exact price levels of the dots:
//PRC_QMP Filter | indicator
//29.09.2016
//Nicolas @ www.prorealcode.com
//Sharing ProRealTime knowledge

//--- parameters
short = 12
long = 26
signal = 9
RSIPeriod = 8
SF = 1
QQE = 3
//---

// --- MACD ZeroLag
EMAshort1 = exponentialaverage[short](close)
EMAshort2 = exponentialaverage[short](EMAshort1)
DifferenceShort = EMAshort1 - EMAshort2
ZeroLagShort = EMAshort1 + DifferenceShort

EMAlong1 = exponentialaverage[long](close)
EMAlong2 = exponentialaverage[long](EMAlong1)
DifferenceLong = EMAlong1 - EMAlong2
ZeroLagLong = EMAlong1 + DifferenceLong

ZeroLagMACD = ZeroLagShort - ZeroLagLong

signal1=ExponentialAverage[signal](ZEROLAGMACD)
signal2=ExponentialAverage[signal](signal1)
DIFFERENCE2=signal1-signal2

SignalMACD=signal1+DIFFERENCE2

// --- QQE
WildersPeriod = RSIPeriod * 2 - 1
if barindex>WildersPeriod then

MyRsi = rsi[RSIPeriod](close)
RsiMa = exponentialaverage[SF](MyRsi)
AtrRsi = abs(RsiMa[1] - RsiMa)
MaAtrRsi = exponentialaverage[WildersPeriod](AtrRsi)
dar = exponentialaverage[WildersPeriod](MaAtrRsi) * QQE

trr=TrLevelSlow[1]
dv = trr
if RsiMA[0]<trr then
trr = RsiMA[0] + dar
if(RsiMA[1]<dv) then
if(trr>dv) then
trr=dv
endif
endif
elsif RsiMA[0]>trr then
trr = RsiMA[0] - dar
if(RsiMA[1]>dv) then
if(trr<dv) then
trr=dv
endif
endif

endif
TrLevelSlow=trr
endif

// --- signals
atr=averagetruerange[100]
if zerolagMACD>=signalMACD and RsiMA>=trr and lasttrend<>1 then
lasttrend=1
r=0
g=255
b=0
drawtext("●",barindex,low-atr/2,Dialog,Bold,12) coloured(r,g,b)
ilow = low-atr/2
elsif zerolagMACD<signalMACD and RsiMA<trr and lasttrend<>-1 then
lasttrend=-1
r=255
g=0
b=0
drawtext("●",barindex,high+atr/2,Dialog,Bold,12) coloured(r,g,b)
ihigh = high+atr/2
endif

return ilow,ihigh
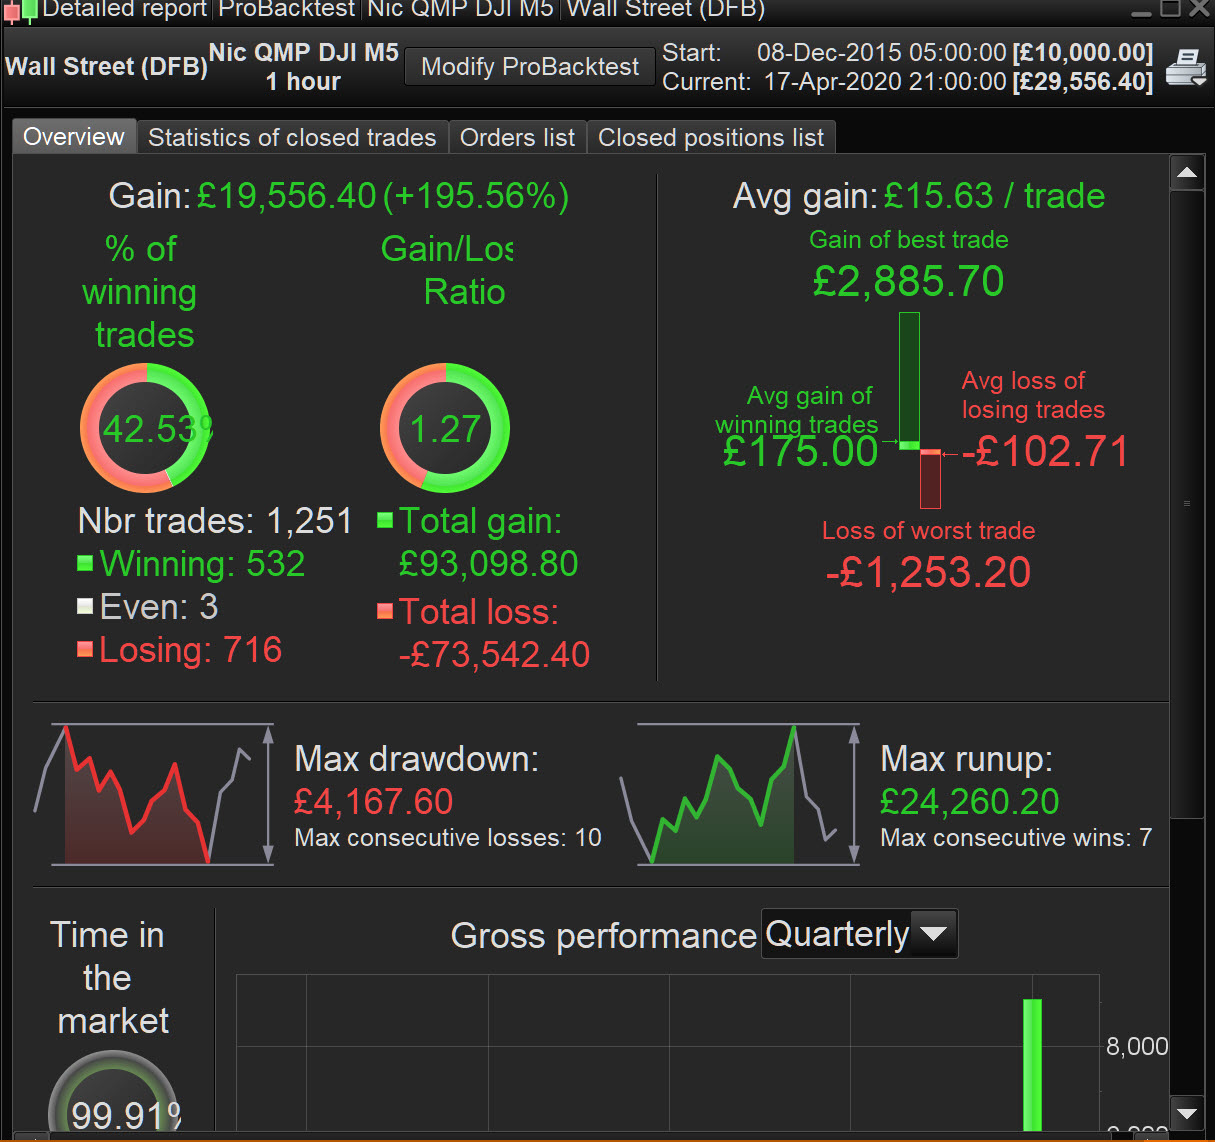
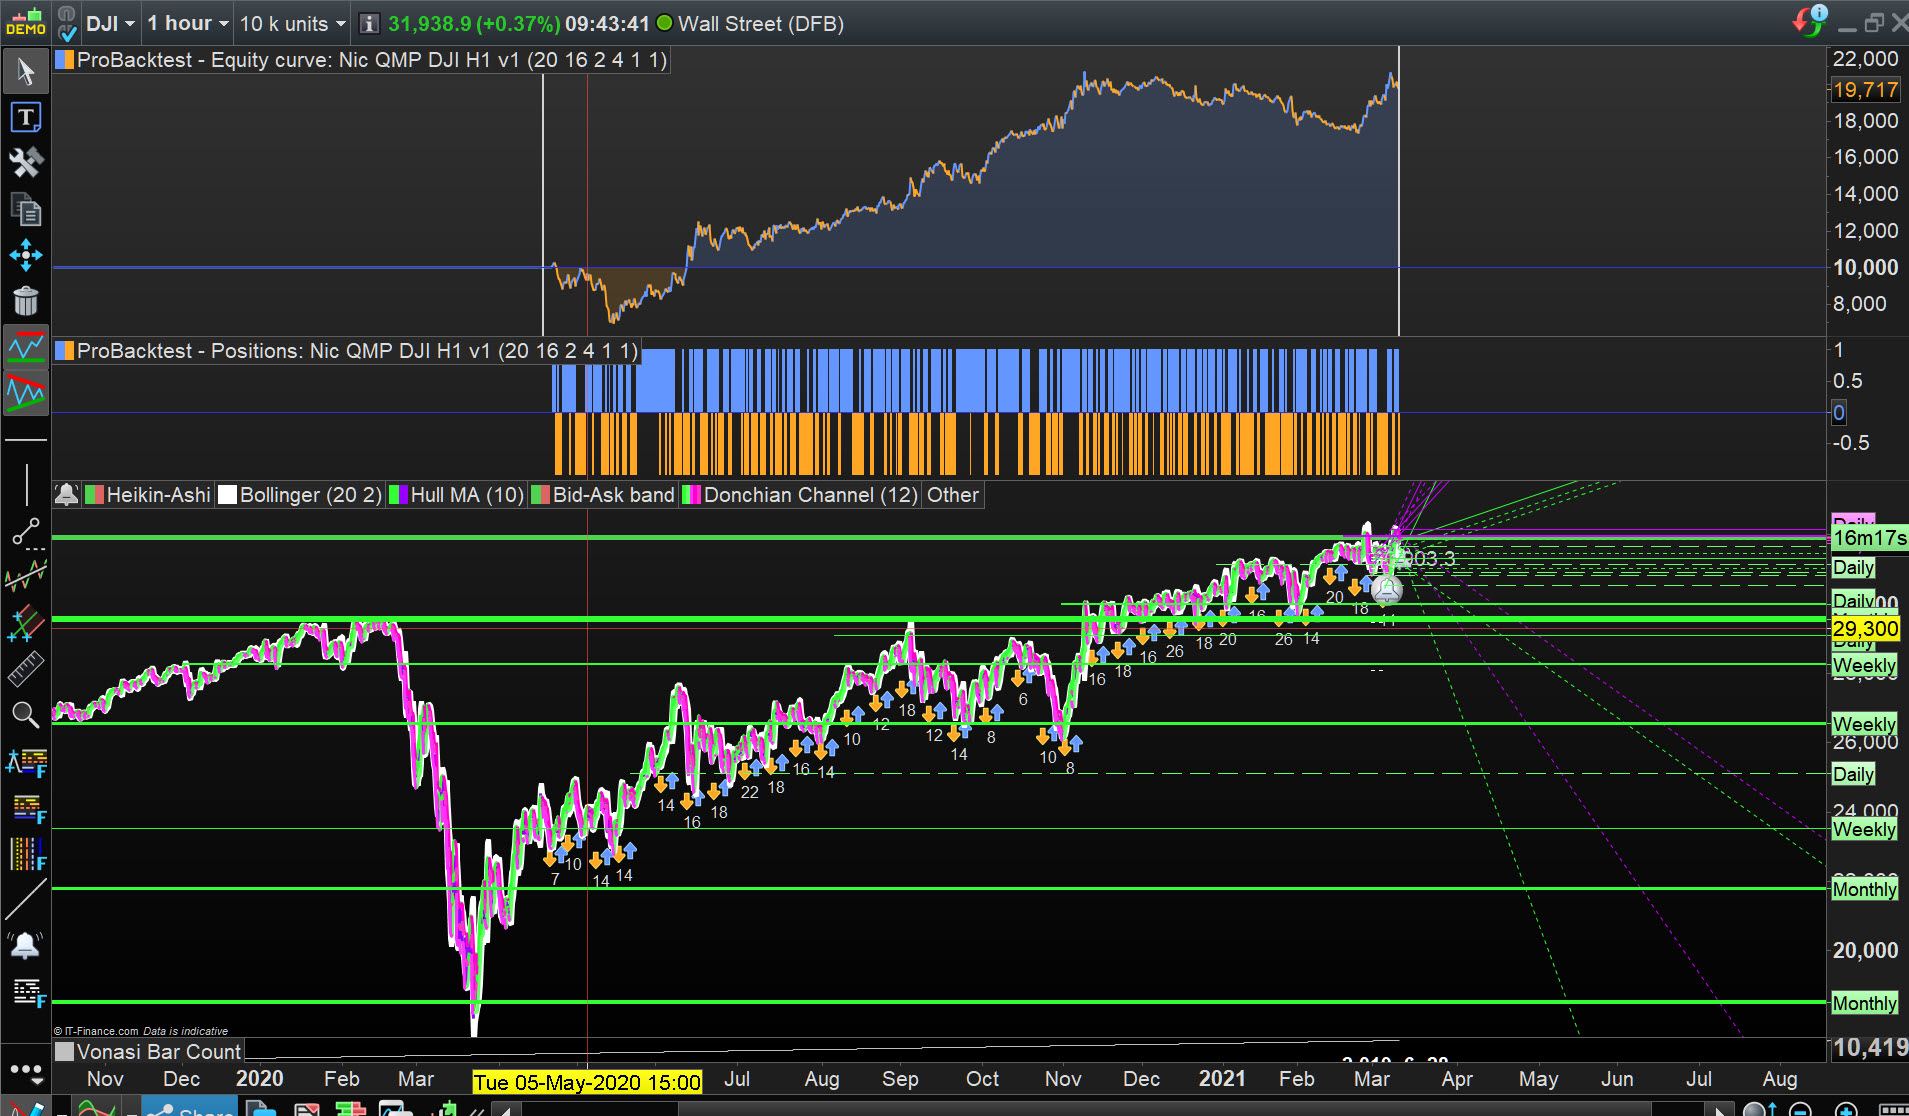
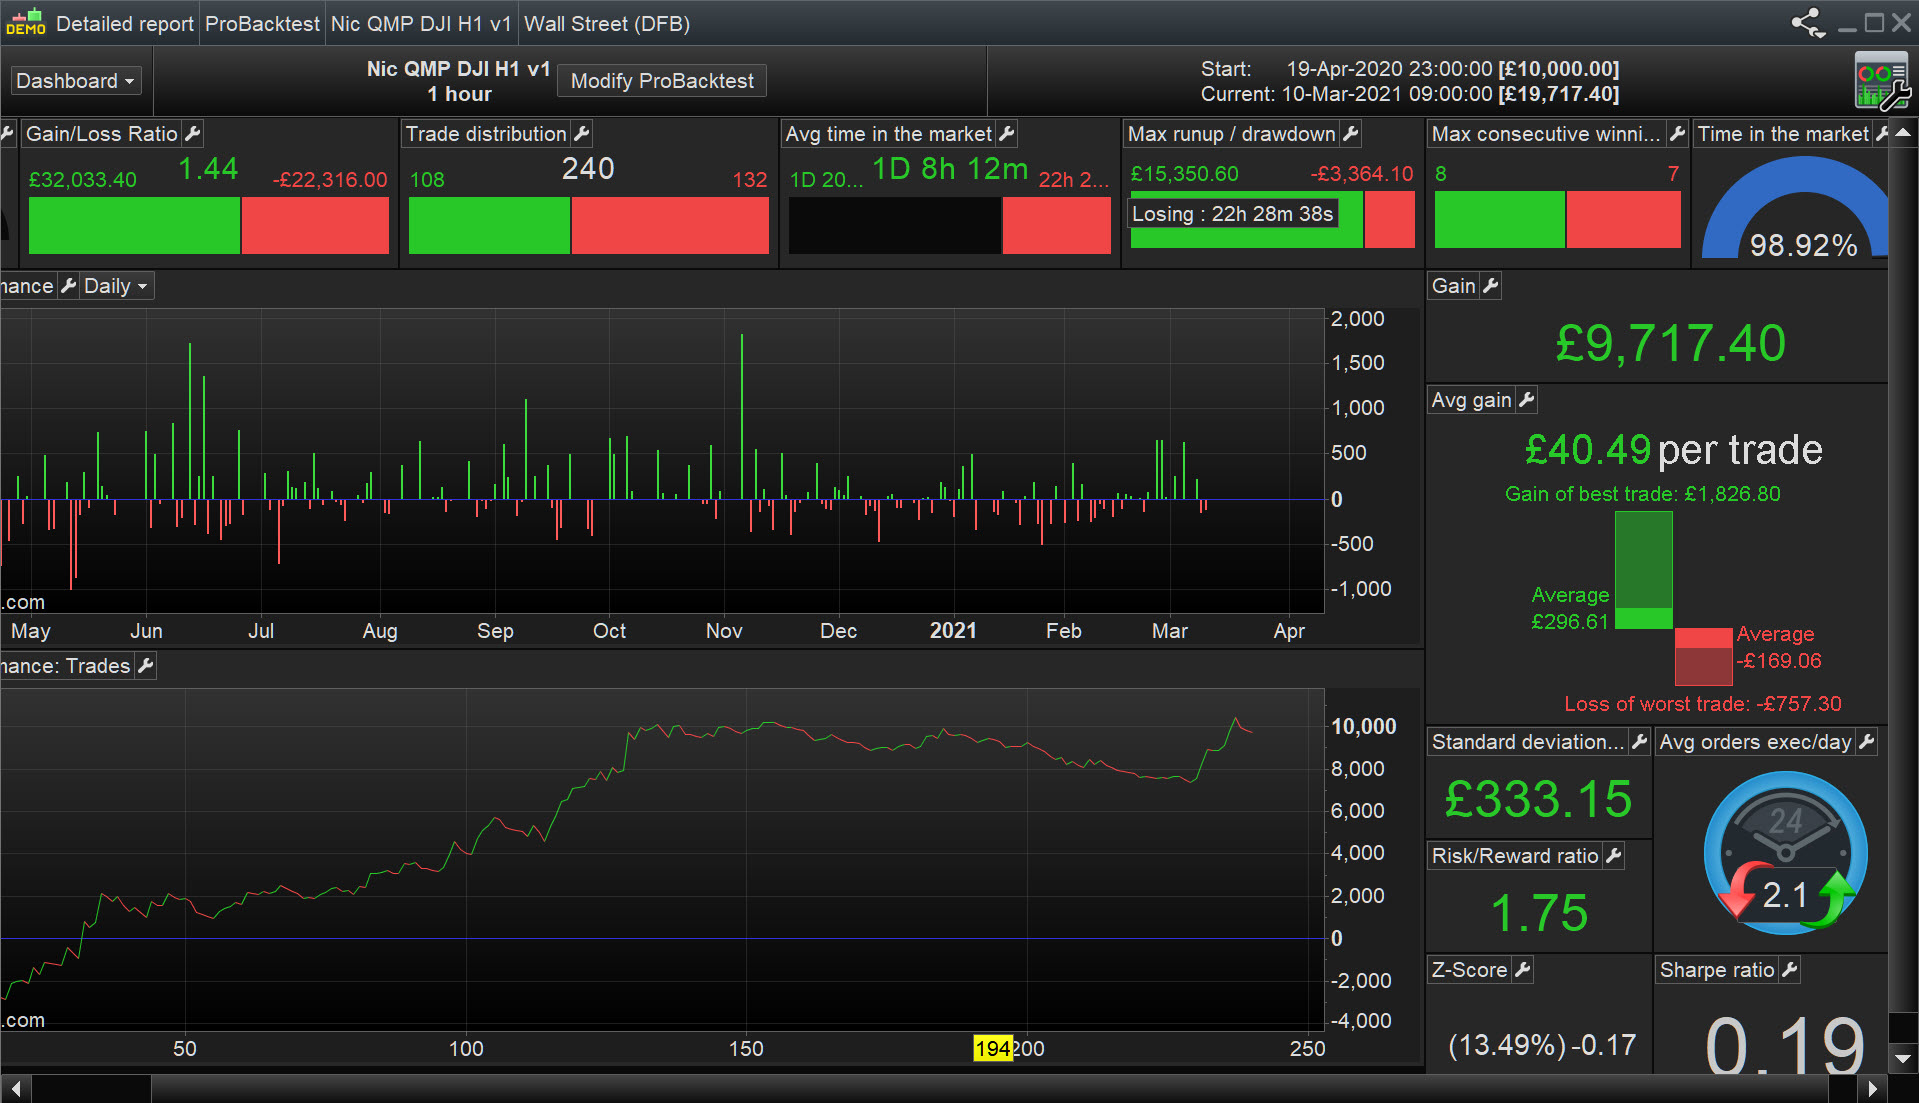
Out of interest, thought I’d backtest (with no optimising) the Algo I posted above.
All attached is Out of Sample data since 18 Apr 20 when I posted above.
Yep it does, thank you very much.
One more question,
How can I get this indicator to do this,
If QMP green dot appears then wait for green QMP in 15 min before entry. Problem I am having is, QMP occurs in specific hourly candle, and by the time 15 min QMP shows up, the hourly QMP condition is invalid. It is hard to say how many hourly candles will be consumed before 15 min QMP shows up.
I tried to return the trend from the code, but problem is – trend covers all candles between Greed and Red QMP. This is not what I want because as market nears red QMP, its not worth entering.
In short, my condition would be like this: Once 1HR QMP is green, enter long on next upcoming 15 min QMP.
Any help would be great. thanks
Hi,
Is it possible to show only last RED and Green dots rather than several signals on chart. How to modify the code to show only the last 2 signal, buy and sell (only show last buy/or sell and latest buy/sell). Visually the charts becomes very messy due to too many dots.
Any help would be great
thanks in advance