Expert Services

No recent search

Machine Learning in ProOrder ProRealTime
- Forums
- ProRealTime English Forum
- ProOrder: Automated Strategies & Backtesting
- Machine Learning in ProOrder ProRealTime
-
AuthorPosts
-
I figured it out, if I just put all my code and added variables to the imported GraHal “version” of my Ehler’s Univ Osc Supersmoother, I don’t need to rename any old systems that use the indicator. I’m still not sure why that new version of the indicator caused issues with renaming as described above considering as I can’t find any trace of it in the Bard itf !?
Cheers @GraHal, all sorted, I eventually decided to use your indicator as the template to put my old indicator and variables in to. Still unsure why there was an indicator name issue if the Bard.itf never had that Univ Osc code in it and your system only referenced the Ehler’s Univ Osc Supersmoother?
Been ML optimising both the long and short thresholds and the will start on the Bandedge too later and tomorrow. I found it better setting Reps1 and Reps2 to 10 instead of 3. How is 3 enough to determine that a parameter would even need adjusting?
I also changed the increments from 10 to 20 so it can go from -1 to 1 in increments of 0.1.
If we’re happy leaving the oscillator thresholds at -0.8 and 0.8 and want to self optimise the Bandedge how is that coded I wonder? I note the rem’d out 100 bandedge in the strategy. You’d need to have added it as a variable with the spanner in the Univ Osc indicator code. I think I would code it like this:
indicator1, ignored = CALL "Ehler's Univ Osc SuperSmoother"[ValueX]
c1 = (indicator1 CROSSES OVER -0.8)
but I am just not sure how the ML code handles added variables? I’ll try in a bit as I’m still looking at ML’ing the thresholds on different timeframes/instruments.
Great job! Cheers again @GraHal
I only have two words to say @Juanj, F%*$ Me! Thank you so much for this Machine Learning code and thanks @GraHal, @Vonasi,
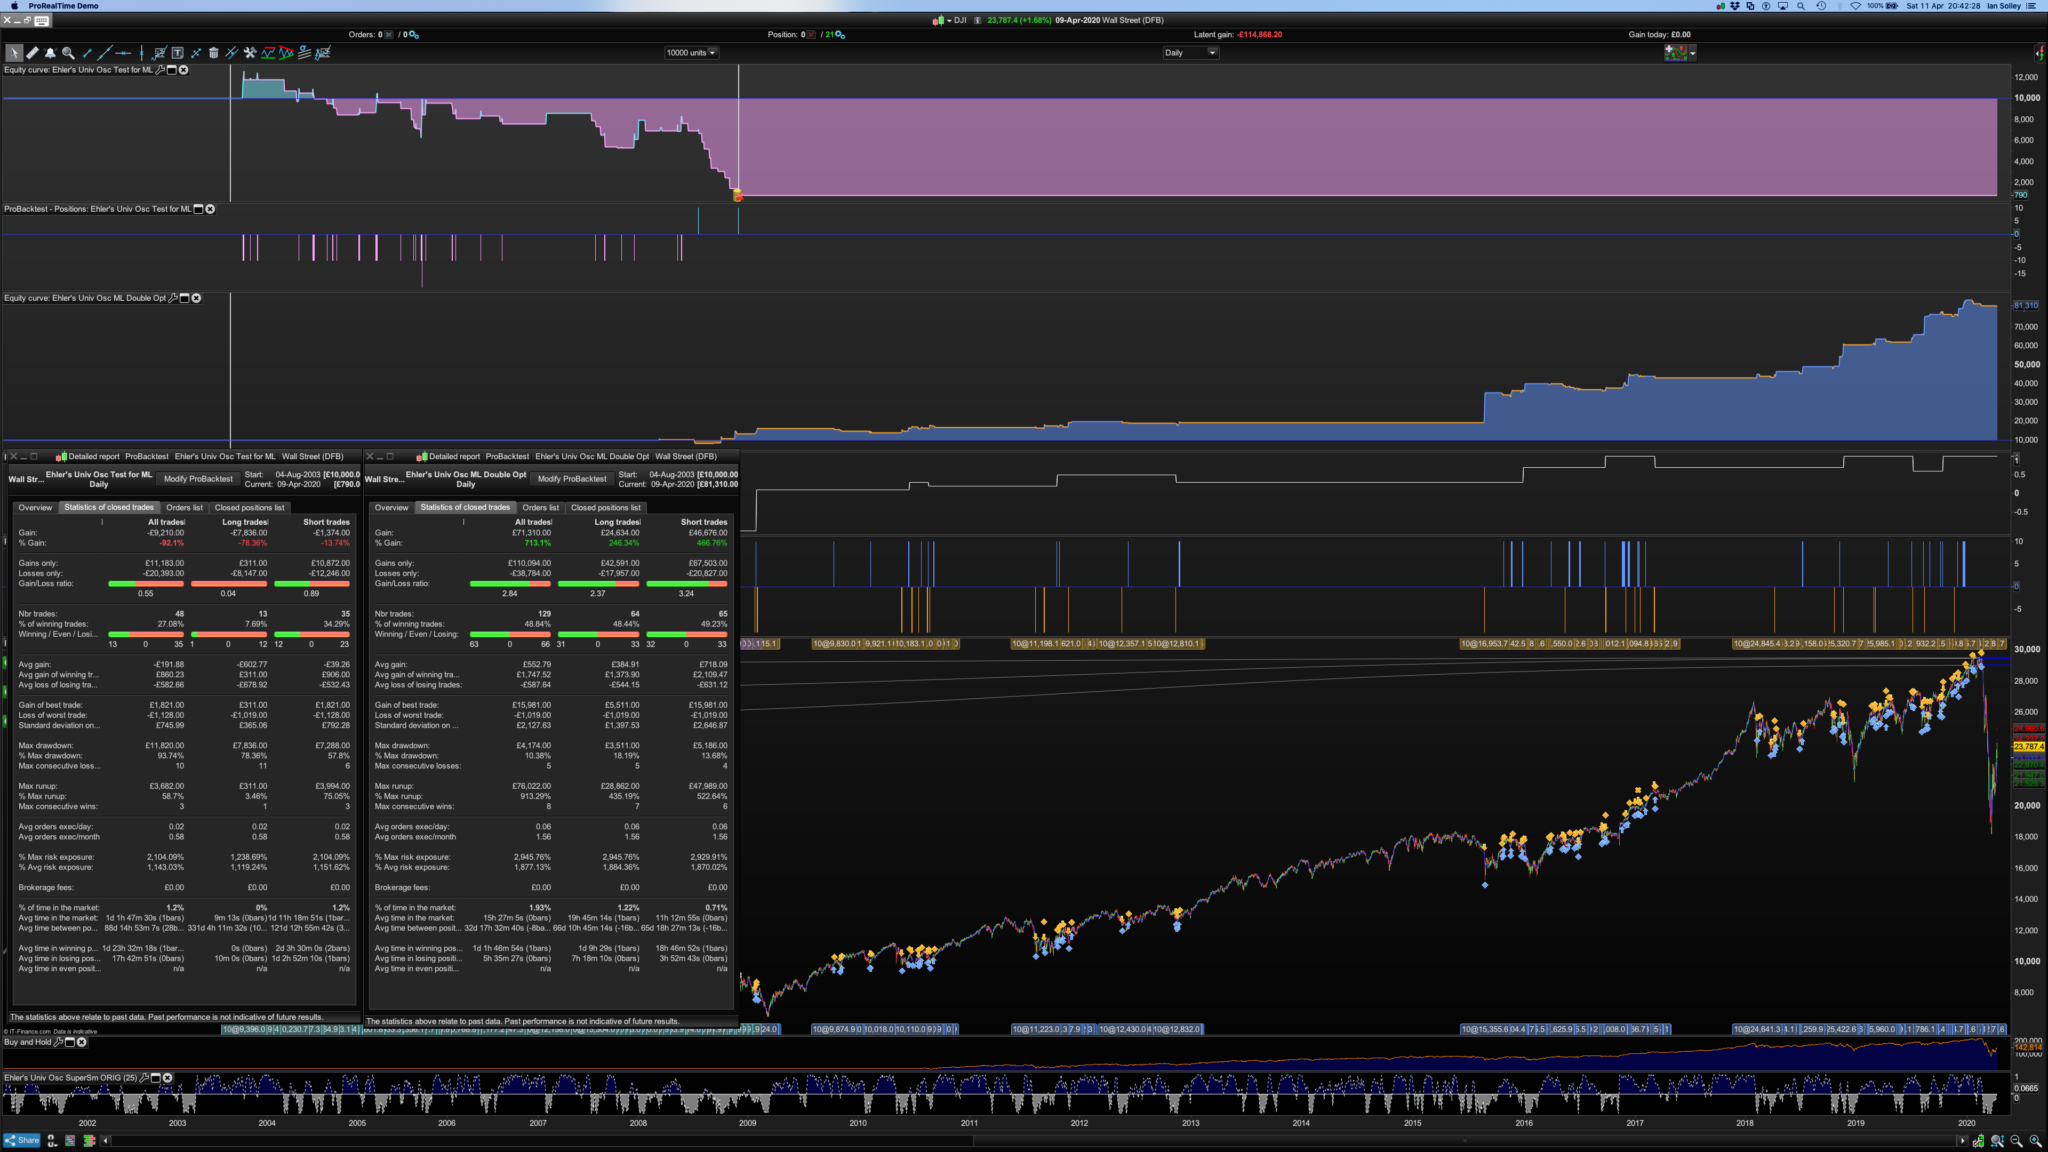
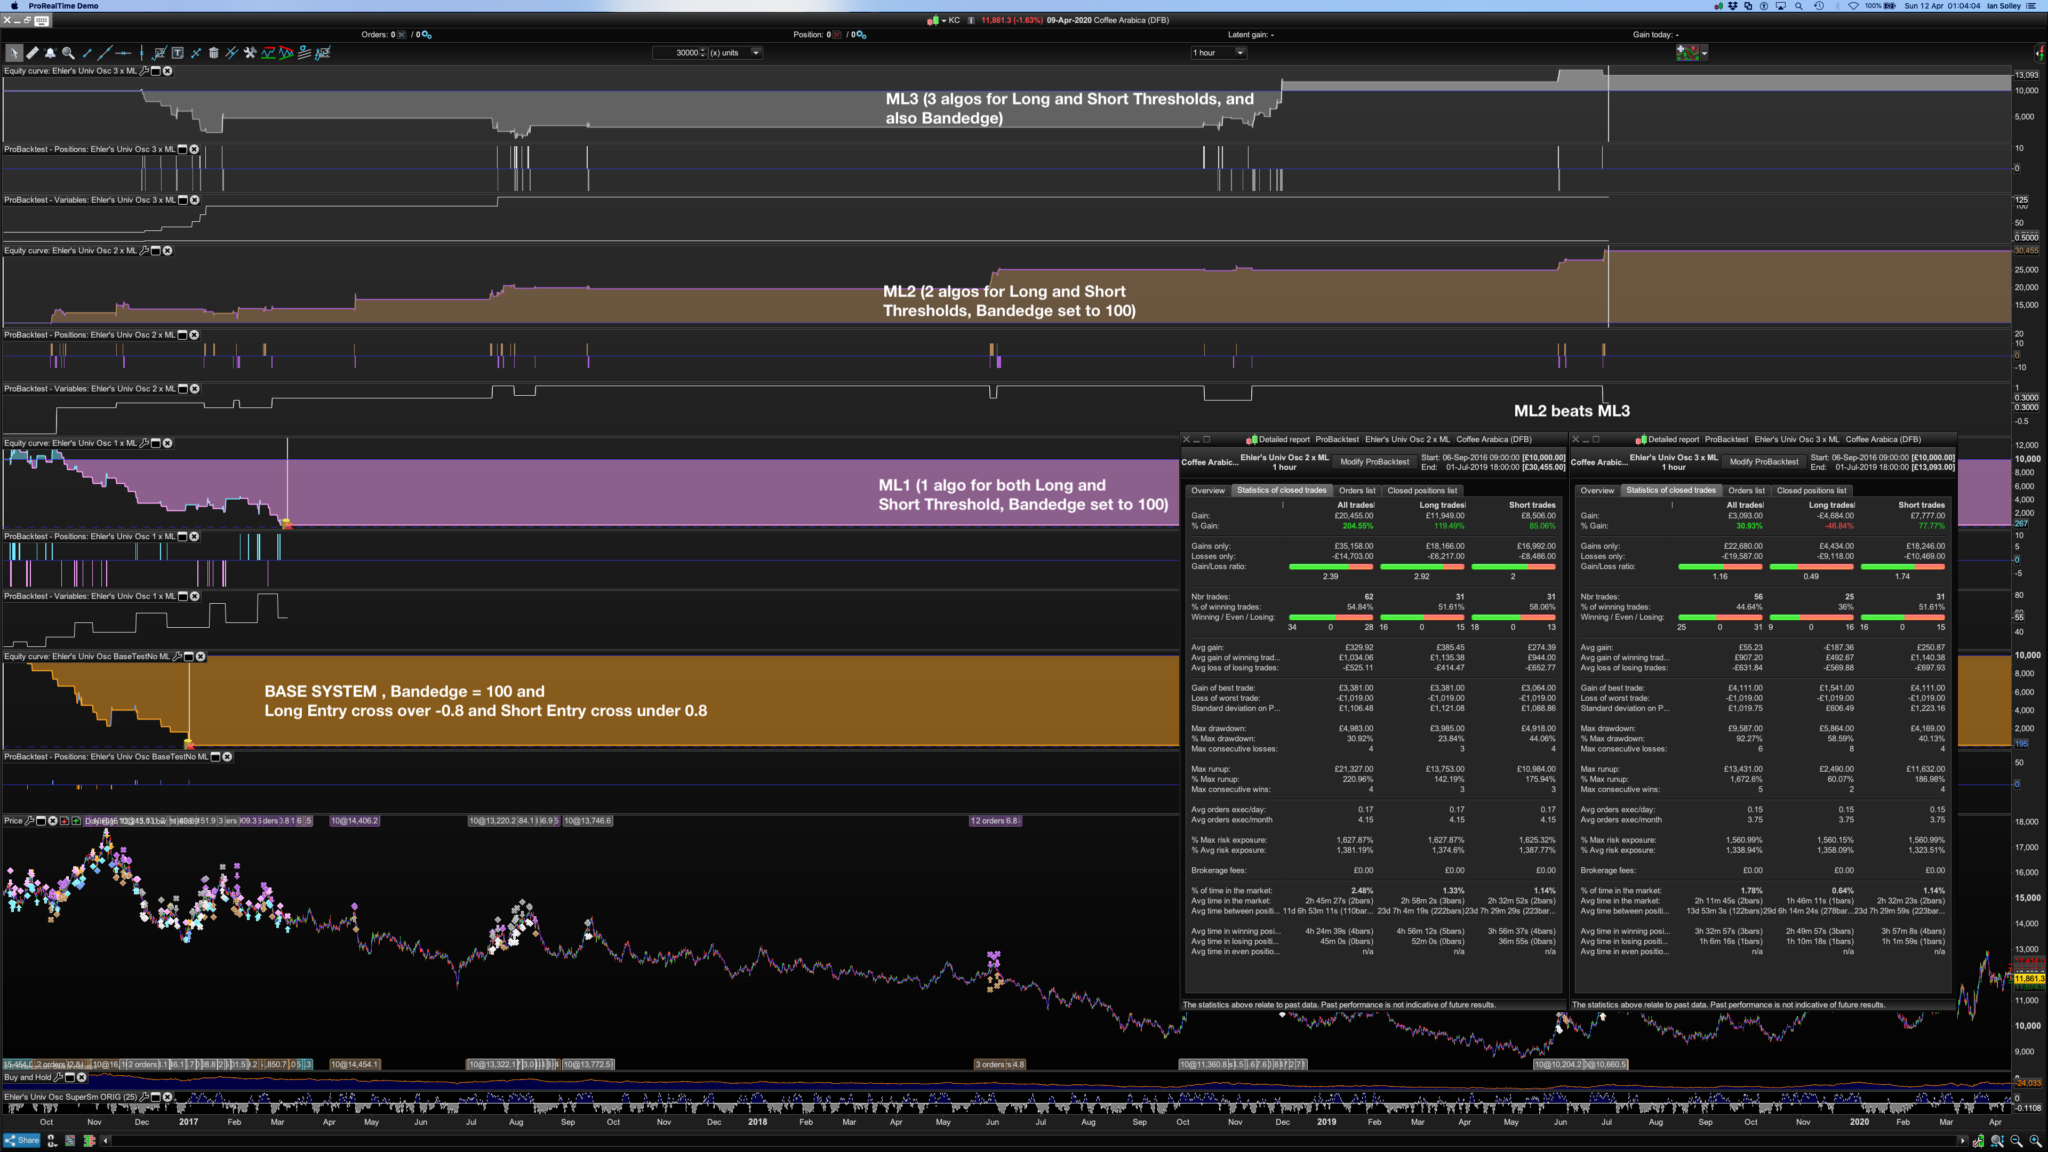
This was my first test using ML. I double optimised the ML code to take care of both the Long and the Short side of Ehler’s Univ Osc Supersmoother oscillator thresholds (range from -1 to 1) and compared it to the basic non ML version using Buy at -0.8 and Sell at 0.8: Pls see image. I upped the Reps from 3 to 5, and the MaxIncrements to 20 (from 10) to allow it to calculate from -1 to 1 on the oscillator in steps of 0.1 and choose a random date range. Spread was 3.8 Daily Dow Jones. Note if anyone can figure out why, when set on all available data with 10,000 units, the ML version doesn’t trade between 1982 and 2003 that would be good to know? (Don’t worry about the -£114k, it’s the demo which was up 60% to £160k… before the Covid19 market rout… Here’s the full system and indicator code for anyone how wants to experiment with it:
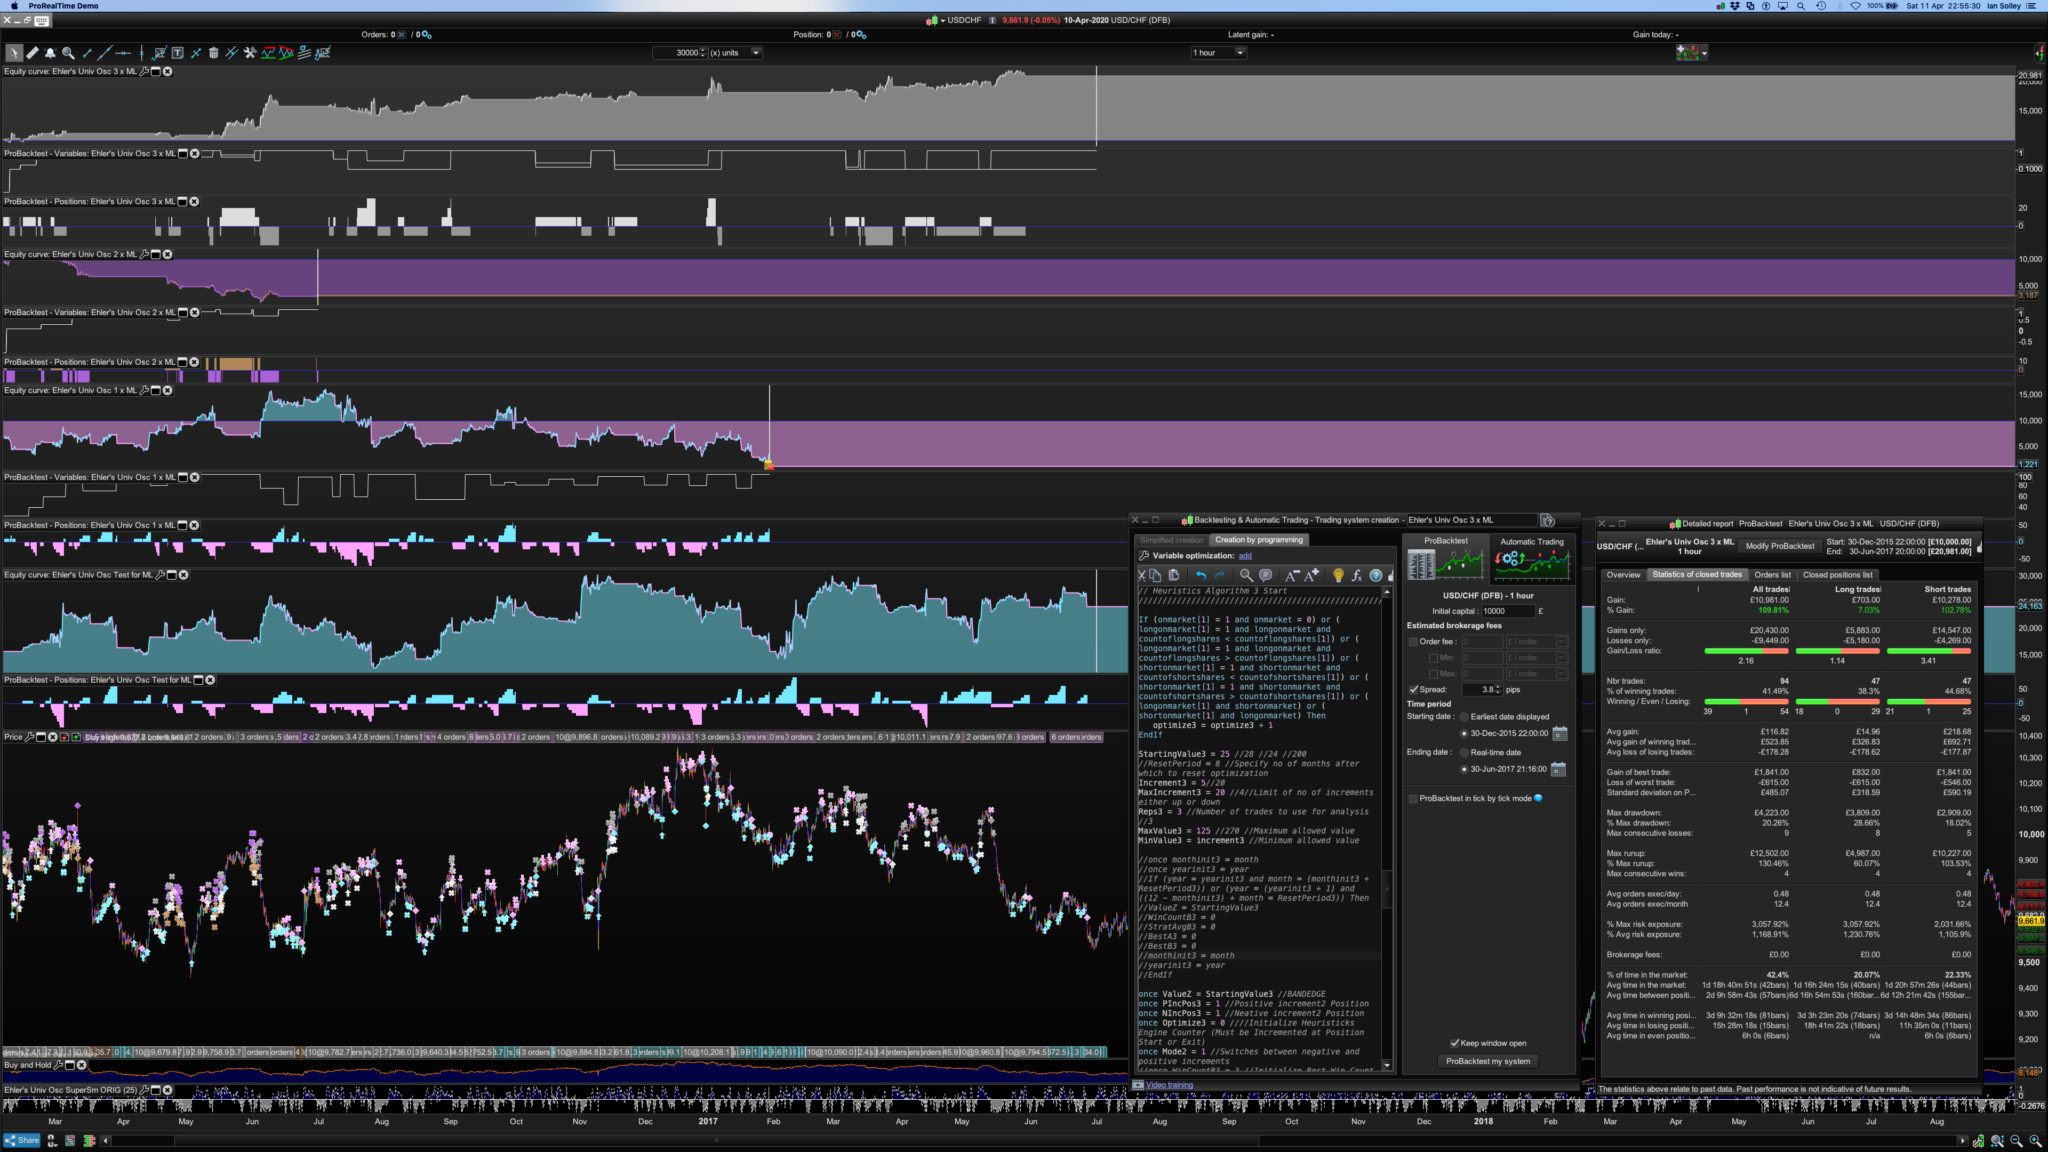
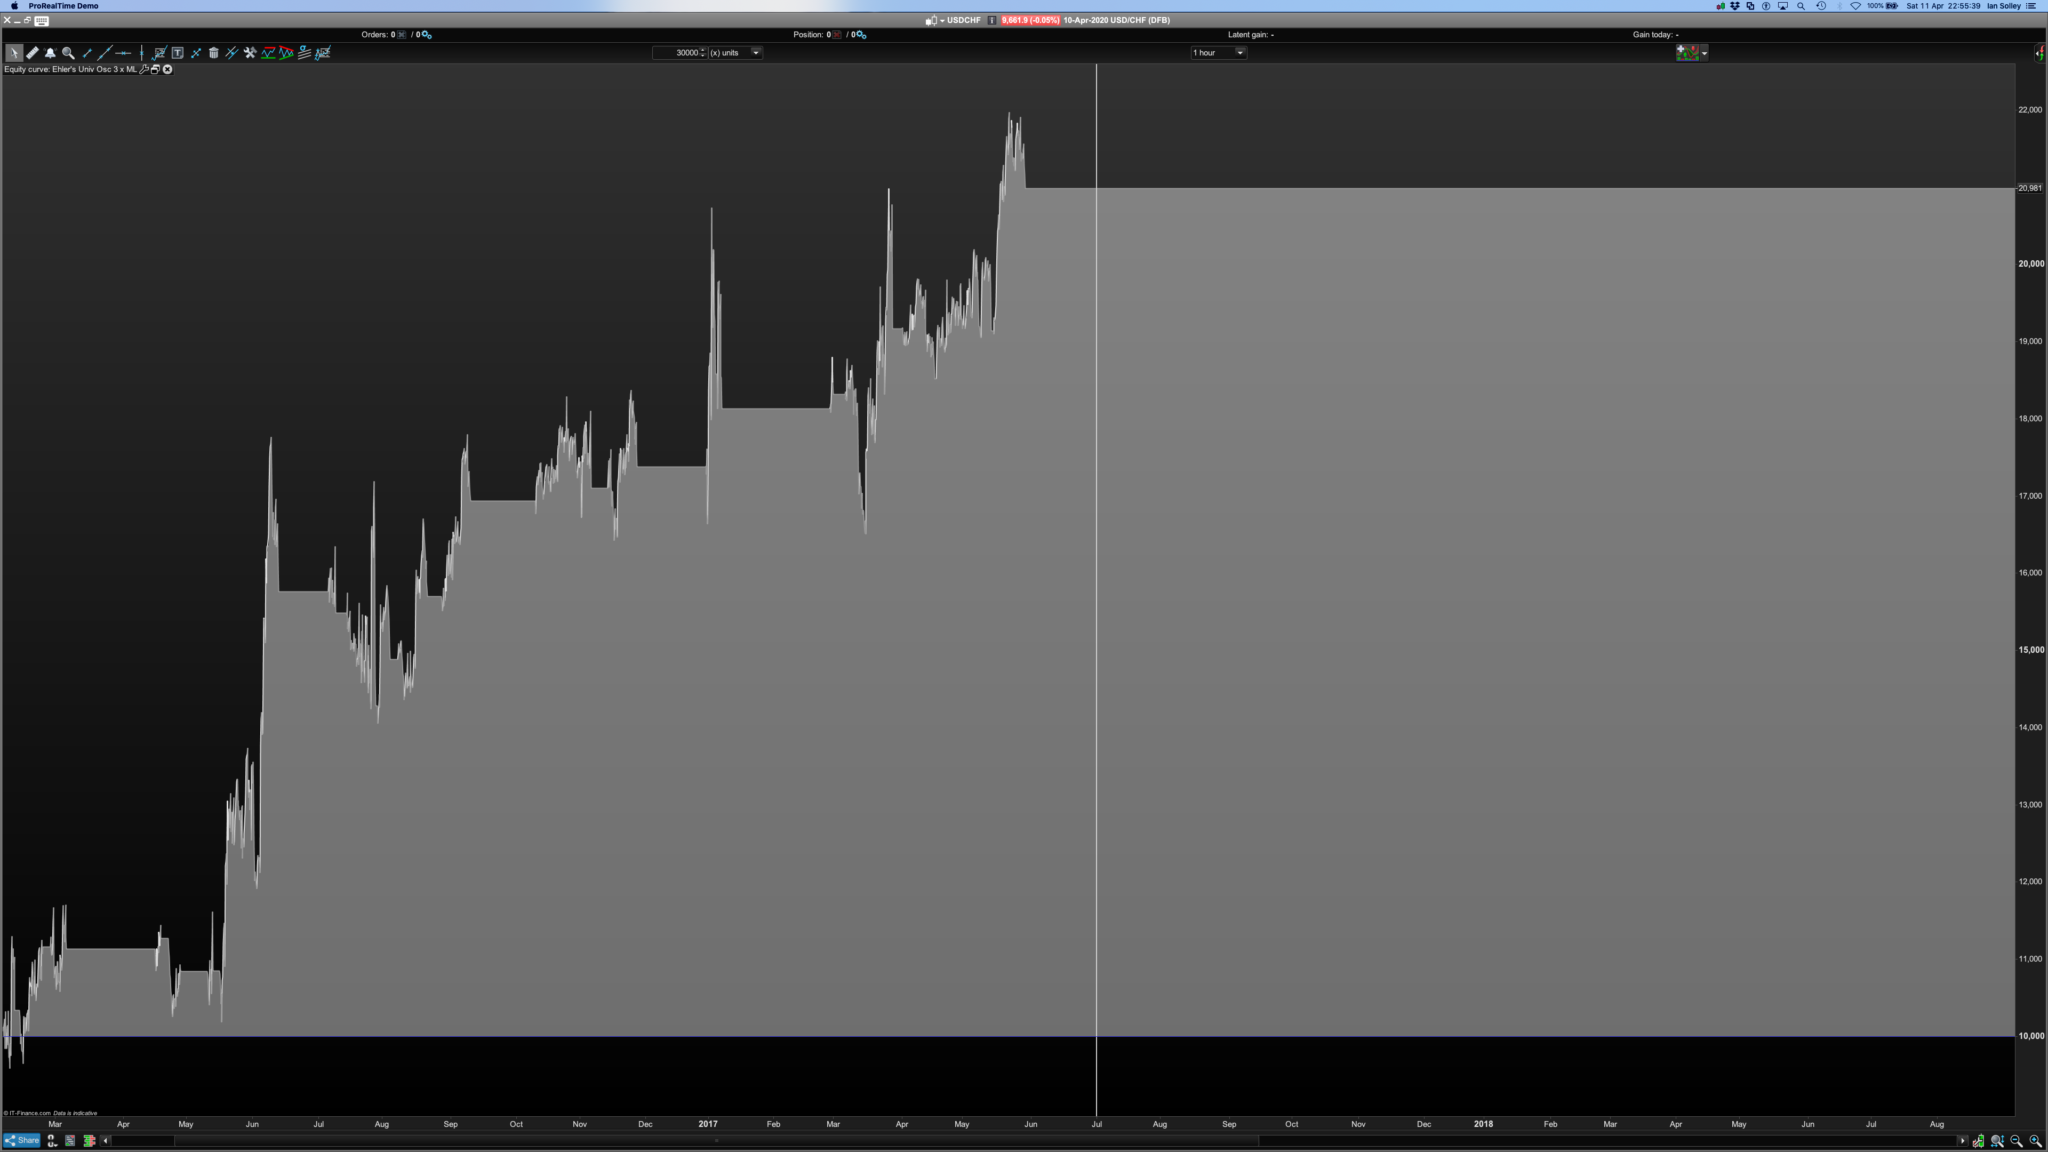
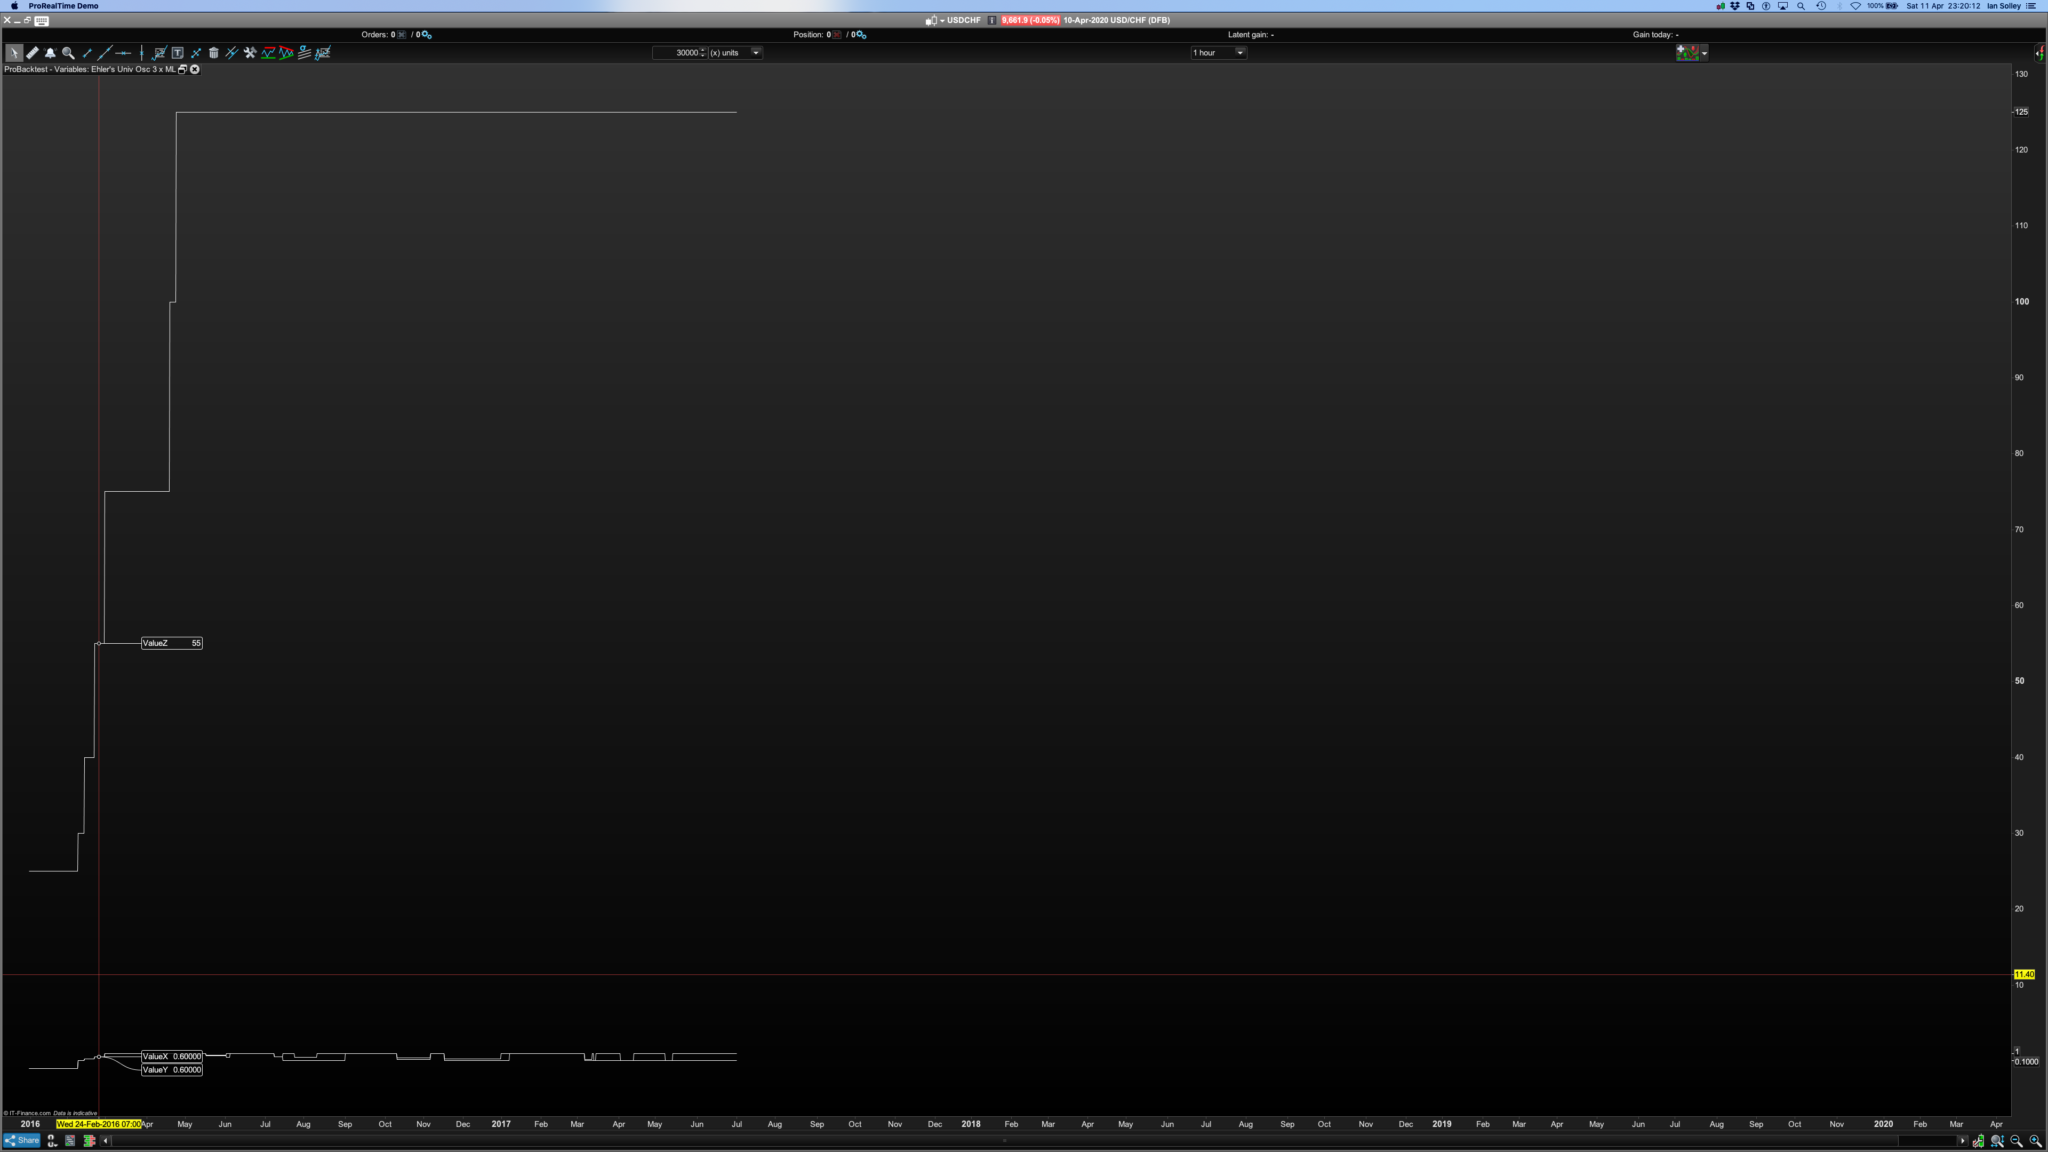
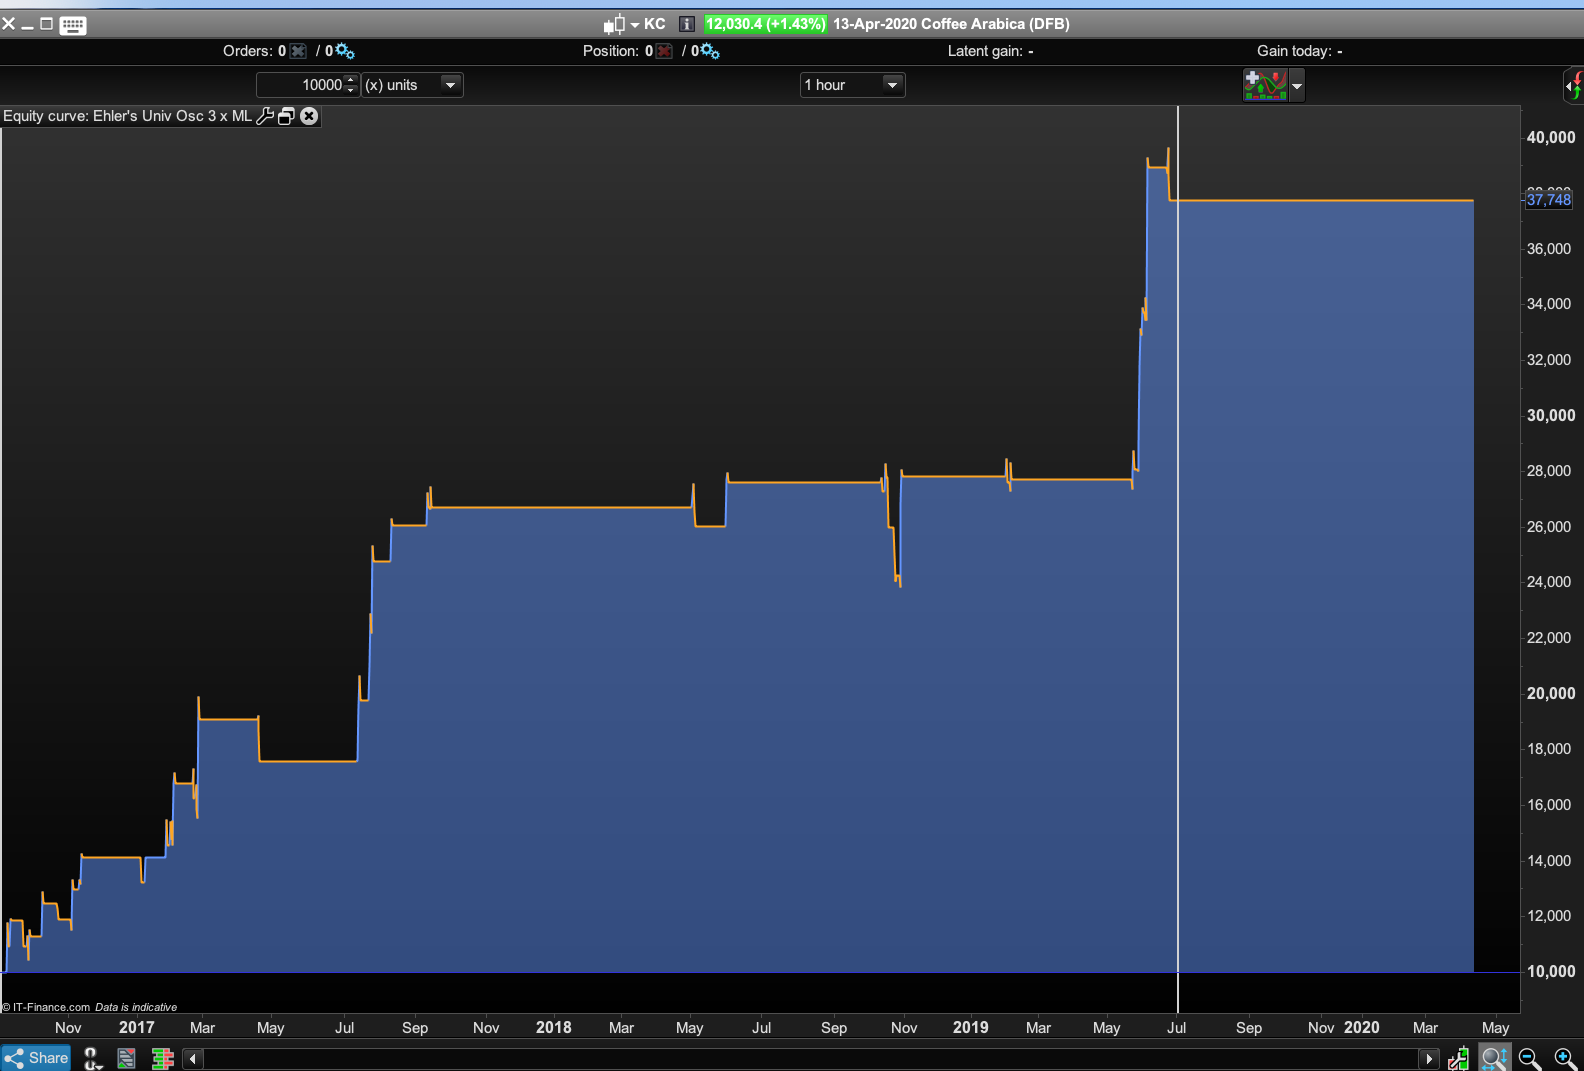
Indicator ://Ehler's Univ Osc SuperSmoother -- Machine Learning (ML) // Definition of code parameters DEFPARAM CumulateOrders = True // Cumulating positions deactivated // Heuristics Algorithm Start If (onmarket[1] = 1 and onmarket = 0) or (longonmarket[1] = 1 and longonmarket and countoflongshares < countoflongshares[1]) or (longonmarket[1] = 1 and longonmarket and countoflongshares > countoflongshares[1]) or (shortonmarket[1] = 1 and shortonmarket and countofshortshares < countofshortshares[1]) or (shortonmarket[1] = 1 and shortonmarket and countofshortshares > countofshortshares[1]) or (longonmarket[1] and shortonmarket) or (shortonmarket[1] and longonmarket) Then optimize = optimize + 1 EndIf StartingValue = -1 //28 //24 //200 //ResetPeriod = 8 //Specify no of months after which to reset optimization Increment = 0.1//20 MaxIncrement = 20 //4//Limit of no of increments either up or down Reps = 5 //Number of trades to use for analysis //3 MaxValue = 1 //270 //Maximum allowed value MinValue = increment //Minimum allowed value //once monthinit = month //once yearinit = year //If (year = yearinit and month = (monthinit + ResetPeriod)) or (year = (yearinit + 1) and ((12 - monthinit) + month = ResetPeriod)) Then //ValueX = StartingValue //WinCountB = 0 //StratAvgB = 0 //BestA = 0 //BestB = 0 //monthinit = month //yearinit = year //EndIf once ValueX = StartingValue once PIncPos = 1 //Positive Increment Position once NIncPos = 1 //Neative Increment Position once Optimize = 0 ////Initialize Heuristicks Engine Counter (Must be Incremented at Position Start or Exit) once Mode = 1 //Switches between negative and positive increments //once WinCountB = 3 //Initialize Best Win Count //GRAPH WinCountB coloured (0,0,0) AS "WinCountB" //once StratAvgB = 4353 //Initialize Best Avg Strategy Profit //GRAPH StratAvgB coloured (0,0,0) AS "StratAvgB" If Optimize = Reps Then WinCountA = 0 //Initialize current Win Count StratAvgA = 0 //Initialize current Avg Strategy Profit For i = 1 to Reps Do If positionperf(i) > 0 Then WinCountA = WinCountA + 1 //Increment Current WinCount EndIf StratAvgA = StratAvgA + (((PositionPerf(i)*countofposition[i]*100000)*-1)*-1) Next StratAvgA = StratAvgA/Reps //Calculate Current Avg Strategy Profit //Graph (PositionPerf(1)*countofposition[1]*100000)*-1 as "PosPerf1" //Graph (PositionPerf(2)*countofposition[2]*100000)*-1 as "PosPerf2" //Graph StratAvgA*-1 as "StratAvgA" //once BestA = 300 //GRAPH BestA coloured (0,0,0) AS "BestA" If StratAvgA >= StratAvgB Then StratAvgB = StratAvgA //Update Best Strategy Profit BestA = ValueX EndIf //once BestB = 300 //GRAPH BestB coloured (0,0,0) AS "BestB" If WinCountA >= WinCountB Then WinCountB = WinCountA //Update Best Win Count BestB = ValueX EndIf If WinCountA > WinCountB and StratAvgA > StratAvgB Then Mode = 0 ElsIf WinCountA < WinCountB and StratAvgA < StratAvgB and Mode = 1 Then ValueX = ValueX - (Increment*NIncPos) NIncPos = NIncPos + 1 Mode = 2 ElsIf WinCountA >= WinCountB or StratAvgA >= StratAvgB and Mode = 1 Then ValueX = ValueX + (Increment*PIncPos) PIncPos = PIncPos + 1 Mode = 1 ElsIf WinCountA < WinCountB and StratAvgA < StratAvgB and Mode = 2 Then ValueX = ValueX + (Increment*PIncPos) PIncPos = PIncPos + 1 Mode = 1 ElsIf WinCountA >= WinCountB or StratAvgA >= StratAvgB and Mode = 2 Then ValueX = ValueX - (Increment*NIncPos) NIncPos = NIncPos + 1 Mode = 2 EndIf If NIncPos > MaxIncrement or PIncPos > MaxIncrement Then If BestA = BestB Then ValueX = BestA Else If reps >= 10 Then WeightedScore = 10 Else WeightedScore = round((reps/100)*100) EndIf ValueX = round(((BestA*(20-WeightedScore)) + (BestB*WeightedScore))/20) //Lower Reps = Less weight assigned to Win% EndIf NIncPos = 1 PIncPos = 1 ElsIf ValueX > MaxValue Then ValueX = MaxValue ElsIf ValueX < MinValue Then ValueX = MinValue EndIF Optimize = 0 EndIf // Heuristics Algorithm End // Heuristics Algorithm 2 Start //////////////////////////////////////////////////// If (onmarket[1] = 1 and onmarket = 0) or (longonmarket[1] = 1 and longonmarket and countoflongshares < countoflongshares[1]) or (longonmarket[1] = 1 and longonmarket and countoflongshares > countoflongshares[1]) or (shortonmarket[1] = 1 and shortonmarket and countofshortshares < countofshortshares[1]) or (shortonmarket[1] = 1 and shortonmarket and countofshortshares > countofshortshares[1]) or (longonmarket[1] and shortonmarket) or (shortonmarket[1] and longonmarket) Then optimize2 = optimize2 + 1 EndIf StartingValue2 = -1 //28 //24 //200 //ResetPeriod = 8 //Specify no of months after which to reset optimization Increment2 = 0.1//20 MaxIncrement2 = 20 //4//Limit of no of increments either up or down Reps2 = 5 //Number of trades to use for analysis //3 MaxValue2 = 1 //270 //Maximum allowed value MinValue2 = increment //Minimum allowed value //once monthinit2 = month //once yearinit2 = year //If (year = yearinit2 and month = (monthinit2 + ResetPeriod2)) or (year = (yearinit2 + 1) and ((12 - monthinit2) + month = ResetPeriod2)) Then //ValueY = StartingValue2 //WinCountB2 = 0 //StratAvgB2 = 0 //BestA2 = 0 //BestB2 = 0 //monthinit2 = month //yearinit2 = year //EndIf once ValueY = StartingValue2 once PIncPos2 = 1 //Positive increment2 Position once NIncPos2 = 1 //Neative increment2 Position once Optimize2 = 0 ////Initialize Heuristicks Engine Counter (Must be Incremented at Position Start or Exit) once Mode2 = 1 //Switches between negative and positive increments //once WinCountB2 = 3 //Initialize Best Win Count //GRAPH WinCountB2 coloured (0,0,0) AS "WinCountB2" //once StratAvgB2 = 4353 //Initialize Best Avg Strategy Profit //GRAPH StratAvgB2 coloured (0,0,0) AS "StratAvgB2" If Optimize2 = Reps2 Then WinCountA2 = 0 //Initialize current Win Count StratAvgA2 = 0 //Initialize current Avg Strategy Profit HeuristicsCycle = HeuristicsCycle + 1 For i2 = 1 to Reps2 Do If positionperf(i2) > 0 Then WinCountA2 = WinCountA2 + 1 //Increment Current WinCount EndIf StratAvgA2 = StratAvgA2 + (((PositionPerf(i2)*countofposition[i2]*100000)*-1)*-1) Next StratAvgA2 = StratAvgA2/Reps2 //Calculate Current Avg Strategy Profit //Graph (PositionPerf(1)*countofposition[1]*100000)*-1 as "PosPerf1-2" //Graph (PositionPerf(2)*countofposition[2]*100000)*-1 as "PosPerf2-2" //Graph StratAvgA2*-1 as "StratAvgA2" //once BestA2 = 300 //GRAPH BestA2 coloured (0,0,0) AS "BestA2" If StratAvgA2 >= StratAvgB2 Then StratAvgB2 = StratAvgA2 //Update Best Strategy Profit BestA2 = ValueY EndIf //once BestB2 = 300 //GRAPH BestB2 coloured (0,0,0) AS "BestB2" If WinCountA2 >= WinCountB2 Then WinCountB2 = WinCountA2 //Update Best Win Count BestB2 = ValueY EndIf If WinCountA2 > WinCountB2 and StratAvgA2 > StratAvgB2 Then Mode2 = 0 ElsIf WinCountA2 < WinCountB2 and StratAvgA2 < StratAvgB2 and Mode2 = 1 Then ValueY = ValueY - (Increment2*NIncPos2) NIncPos2 = NIncPos2 + 1 Mode2 = 2 ElsIf WinCountA2 >= WinCountB2 or StratAvgA2 >= StratAvgB2 and Mode2 = 1 Then ValueY = ValueY + (Increment2*PIncPos2) PIncPos2 = PIncPos2 + 1 Mode2 = 1 ElsIf WinCountA2 < WinCountB2 and StratAvgA2 < StratAvgB2 and Mode2 = 2 Then ValueY = ValueY + (Increment2*PIncPos2) PIncPos2 = PIncPos2 + 1 Mode2 = 1 ElsIf WinCountA2 >= WinCountB2 or StratAvgA2 >= StratAvgB2 and Mode2 = 2 Then ValueY = ValueY - (Increment2*NIncPos2) NIncPos2 = NIncPos2 + 1 Mode2 = 2 EndIf If NIncPos2 > MaxIncrement2 or PIncPos > MaxIncrement2 Then If BestA2 = BestB2 Then ValueY = BestA2 Else If reps2 >= 10 Then WeightedScore2 = 10 Else WeightedScore2 = round((reps2/100)*100) EndIf ValueY = round(((BestA2*(20-WeightedScore2)) + (BestB2*WeightedScore2))/20) //Lower Reps = Less weight assigned to Win% EndIf NIncPos2 = 1 PIncPos2 = 1 ElsIf ValueY > MaxValue2 Then ValueY = MaxValue2 ElsIf ValueY < MinValue2 Then ValueY = MinValue2 EndIF Optimize2 = 0 EndIf // Heuristics Algorithm 2 End //Note: Bandedge: 50 and crosses of 0.5 and -0.5 is good on daily indices. //Bandedge: 24 and crosses of 0.1 and -0.1 work, depending on asset class. //Bandedge Setting: //Univ Osc Bandedge = 100 set in Variables // Conditions to enter long positions indicator1, ignored = CALL "Ehler's Univ Osc SuperSm ORIG"[100] c1 = (indicator1 CROSSES OVER ValueX) IF c1 THEN BUY 10 PERPOINT AT MARKET ENDIF // Conditions to exit long positions indicator2, ignored = CALL "Ehler's Univ Osc SuperSm ORIG"[100] c2 = (indicator2 CROSSES UNDER 0.0) IF c2 THEN SELL AT MARKET ENDIF // Conditions to enter short positions indicator3, ignored = CALL "Ehler's Univ Osc SuperSm ORIG"[100] c3 = (indicator3 CROSSES UNDER ValueY) IF c3 THEN SELLSHORT 10 PERPOINT AT MARKET ENDIF // Conditions to exit short positions indicator4, ignored = CALL "Ehler's Univ Osc SuperSm ORIG"[100] c4 = (indicator4 CROSSES OVER 0.0) IF c4 THEN EXITSHORT AT MARKET ENDIF // Stops and targets Set stop trailing 100 GRAPH ValueX GRAPH ValueY//bandedge= 100 //Default = 25 whitenoise= (Close - Close[2])/2 if barindex>bandedge then // super smoother filter a1= Exp(-1.414 * 3.14159 / bandedge) b1= 2*a1 * Cos(1.414*180 /bandedge) c2= b1 c3= -a1 * a1 c1= 1 - c2 - c3 filt= c1 * (whitenoise + whitenoise[1])/2 + c2*filt[1] + c3*filt[1] filt1 = filt if ABS(filt1)>pk[1] then pk = ABS(filt1) else pk = 0.991 * pk[1] endif if pk=0 then denom = -1 else denom = pk endif if denom = -1 then result = result[1] else result = filt1/pk endif endif RETURN result COLOURED(0,0,0) style(dottedline,1) as "Universal Oscillator", 0 as "0"bertrandpinoy and thanked this postHere I’ve added 3 lots of Machine Learning Algos in the same System. (Please check coding, I wasn’t sure how to code graphs for Positionperf?). I’m still learning about the way this algo works and will probably be asking more questions soon, but I have to say this is a major breakthrough. The first two identical setting ML algos (ValueX and ValueY) deal with the Ehler’s Universal Oscillator Supersmoother’s Long and Short Threshold entries, between -1 and +1. in steps of 0.1. The added third ML algo (ValueZ) then looks at the Bandedge setting for the Oscillator (it’s like a sensitivity setting, we’ve all seen RSI’s in strong up moves where the RSI hogs the upper range and flatlines giving no useful info, this setting if set to lower form 100 down 25 will allow for more definition, if set to 100 it’ll look like that overloaded RSI but still be more accurate). I compared the standard Ehler’s Universal Oscillator Supersmoother system (last equity curve at the bottom), as a base test, compared to ML systems with one ML algo, two ML’s algos and finally three ML’s algos, see the very top equity chart. The Bandedge from experience can be increased in increments of 25, but over 125 there’s not much difference in performance as I recall going much higher. The performance is reasonable (with 20% Drawdown) and I’m sure the Exits could be improved instead of using mean zero level or a trailing stop (set at a generic 100 point but not optimised or tested), maybe with a Kase Dev Stop or Kaufman Volatility Stop… but anyhow, the point of this post is to notice how the equity curve goes nicely from the bottom left to top right of the graph. Code below, (indicator code already been posted in comments before this one). Blue Skies!! @Gabri! Lol.// Ehler's Universal Oscillator Supersmoother Machine Learning (MLx3) // Definition of code parameters DEFPARAM CumulateOrders = True // Cumulating positions deactivated // Heuristics Algorithm Start If (onmarket[1] = 1 and onmarket = 0) or (longonmarket[1] = 1 and longonmarket and countoflongshares < countoflongshares[1]) or (longonmarket[1] = 1 and longonmarket and countoflongshares > countoflongshares[1]) or (shortonmarket[1] = 1 and shortonmarket and countofshortshares < countofshortshares[1]) or (shortonmarket[1] = 1 and shortonmarket and countofshortshares > countofshortshares[1]) or (longonmarket[1] and shortonmarket) or (shortonmarket[1] and longonmarket) Then optimize = optimize + 1 EndIf StartingValue = -1 //28 //24 //200 //ResetPeriod = 8 //Specify no of months after which to reset optimization Increment = 0.1//20 MaxIncrement = 20 //4//Limit of no of increments either up or down Reps = 3 //Number of trades to use for analysis //3 MaxValue = 1 //270 //Maximum allowed value MinValue = increment //Minimum allowed value //once monthinit = month //once yearinit = year //If (year = yearinit and month = (monthinit + ResetPeriod)) or (year = (yearinit + 1) and ((12 - monthinit) + month = ResetPeriod)) Then //ValueX = StartingValue //WinCountB = 0 //StratAvgB = 0 //BestA = 0 //BestB = 0 //monthinit = month //yearinit = year //EndIf once ValueX = StartingValue //LONG THRESHOLD once PIncPos = 1 //Positive Increment Position once NIncPos = 1 //Neative Increment Position once Optimize = 0 ////Initialize Heuristicks Engine Counter (Must be Incremented at Position Start or Exit) once Mode = 1 //Switches between negative and positive increments //once WinCountB = 3 //Initialize Best Win Count //GRAPH WinCountB coloured (0,0,0) AS "WinCountB" //once StratAvgB = 4353 //Initialize Best Avg Strategy Profit //GRAPH StratAvgB coloured (0,0,0) AS "StratAvgB" If Optimize = Reps Then WinCountA = 0 //Initialize current Win Count StratAvgA = 0 //Initialize current Avg Strategy Profit For i = 1 to Reps Do If positionperf(i) > 0 Then WinCountA = WinCountA + 1 //Increment Current WinCount EndIf StratAvgA = StratAvgA + (((PositionPerf(i)*countofposition[i]*100000)*-1)*-1) Next StratAvgA = StratAvgA/Reps //Calculate Current Avg Strategy Profit //Graph (PositionPerf(1)*countofposition[1]*100000)*-1 as "PosPerf1" //Graph (PositionPerf(2)*countofposition[2]*100000)*-1 as "PosPerf2" //Graph StratAvgA*-1 as "StratAvgA" //once BestA = 300 //GRAPH BestA coloured (0,0,0) AS "BestA" If StratAvgA >= StratAvgB Then StratAvgB = StratAvgA //Update Best Strategy Profit BestA = ValueX EndIf //once BestB = 300 //GRAPH BestB coloured (0,0,0) AS "BestB" If WinCountA >= WinCountB Then WinCountB = WinCountA //Update Best Win Count BestB = ValueX EndIf If WinCountA > WinCountB and StratAvgA > StratAvgB Then Mode = 0 ElsIf WinCountA < WinCountB and StratAvgA < StratAvgB and Mode = 1 Then ValueX = ValueX - (Increment*NIncPos) NIncPos = NIncPos + 1 Mode = 2 ElsIf WinCountA >= WinCountB or StratAvgA >= StratAvgB and Mode = 1 Then ValueX = ValueX + (Increment*PIncPos) PIncPos = PIncPos + 1 Mode = 1 ElsIf WinCountA < WinCountB and StratAvgA < StratAvgB and Mode = 2 Then ValueX = ValueX + (Increment*PIncPos) PIncPos = PIncPos + 1 Mode = 1 ElsIf WinCountA >= WinCountB or StratAvgA >= StratAvgB and Mode = 2 Then ValueX = ValueX - (Increment*NIncPos) NIncPos = NIncPos + 1 Mode = 2 EndIf If NIncPos > MaxIncrement or PIncPos > MaxIncrement Then If BestA = BestB Then ValueX = BestA Else If reps >= 10 Then WeightedScore = 10 Else WeightedScore = round((reps/100)*100) EndIf ValueX = round(((BestA*(20-WeightedScore)) + (BestB*WeightedScore))/20) //Lower Reps = Less weight assigned to Win% EndIf NIncPos = 1 PIncPos = 1 ElsIf ValueX > MaxValue Then ValueX = MaxValue ElsIf ValueX < MinValue Then ValueX = MinValue EndIF Optimize = 0 EndIf // Heuristics Algorithm End // Heuristics Algorithm 2 Start //////////////////////////////////////////////////// If (onmarket[1] = 1 and onmarket = 0) or (longonmarket[1] = 1 and longonmarket and countoflongshares < countoflongshares[1]) or (longonmarket[1] = 1 and longonmarket and countoflongshares > countoflongshares[1]) or (shortonmarket[1] = 1 and shortonmarket and countofshortshares < countofshortshares[1]) or (shortonmarket[1] = 1 and shortonmarket and countofshortshares > countofshortshares[1]) or (longonmarket[1] and shortonmarket) or (shortonmarket[1] and longonmarket) Then optimize2 = optimize2 + 1 EndIf StartingValue2 = -1 //28 //24 //200 //ResetPeriod = 8 //Specify no of months after which to reset optimization Increment2 = 0.1//20 MaxIncrement2 = 20 //4//Limit of no of increments either up or down Reps2 = 3 //Number of trades to use for analysis //3 MaxValue2 = 1 //270 //Maximum allowed value MinValue2 = increment2 //Minimum allowed value //once monthinit2 = month //once yearinit2 = year //If (year = yearinit2 and month = (monthinit2 + ResetPeriod2)) or (year = (yearinit2 + 1) and ((12 - monthinit2) + month = ResetPeriod2)) Then //ValueY = StartingValue2 //WinCountB2 = 0 //StratAvgB2 = 0 //BestA2 = 0 //BestB2 = 0 //monthinit2 = month //yearinit2 = year //EndIf once ValueY = StartingValue2 ///SHORT THRESHOLD once PIncPos2 = 1 //Positive increment2 Position once NIncPos2 = 1 //Neative increment2 Position once Optimize2 = 0 ////Initialize Heuristicks Engine Counter (Must be Incremented at Position Start or Exit) once Mode2 = 1 //Switches between negative and positive increments //once WinCountB2 = 3 //Initialize Best Win Count //GRAPH WinCountB2 coloured (0,0,0) AS "WinCountB2" //once StratAvgB2 = 4353 //Initialize Best Avg Strategy Profit //GRAPH StratAvgB2 coloured (0,0,0) AS "StratAvgB2" If Optimize2 = Reps2 Then WinCountA2 = 0 //Initialize current Win Count StratAvgA2 = 0 //Initialize current Avg Strategy Profit HeuristicsCycle = HeuristicsCycle + 1 For i2 = 1 to Reps2 Do If positionperf(i2) > 0 Then WinCountA2 = WinCountA2 + 1 //Increment Current WinCount EndIf StratAvgA2 = StratAvgA2 + (((PositionPerf(i2)*countofposition[i2]*100000)*-1)*-1) Next StratAvgA2 = StratAvgA2/Reps2 //Calculate Current Avg Strategy Profit //Graph (PositionPerf(1)*countofposition[1]*100000)*-1 as "PosPerf1-2" //Graph (PositionPerf(2)*countofposition[2]*100000)*-1 as "PosPerf2-2" //Graph StratAvgA2*-1 as "StratAvgA2" //once BestA2 = 300 //GRAPH BestA2 coloured (0,0,0) AS "BestA2" If StratAvgA2 >= StratAvgB2 Then StratAvgB2 = StratAvgA2 //Update Best Strategy Profit BestA2 = ValueY EndIf //once BestB2 = 300 //GRAPH BestB2 coloured (0,0,0) AS "BestB2" If WinCountA2 >= WinCountB2 Then WinCountB2 = WinCountA2 //Update Best Win Count BestB2 = ValueY EndIf If WinCountA2 > WinCountB2 and StratAvgA2 > StratAvgB2 Then Mode2 = 0 ElsIf WinCountA2 < WinCountB2 and StratAvgA2 < StratAvgB2 and Mode2 = 1 Then ValueY = ValueY - (Increment2*NIncPos2) NIncPos2 = NIncPos2 + 1 Mode2 = 2 ElsIf WinCountA2 >= WinCountB2 or StratAvgA2 >= StratAvgB2 and Mode2 = 1 Then ValueY = ValueY + (Increment2*PIncPos2) PIncPos2 = PIncPos2 + 1 Mode2 = 1 ElsIf WinCountA2 < WinCountB2 and StratAvgA2 < StratAvgB2 and Mode2 = 2 Then ValueY = ValueY + (Increment2*PIncPos2) PIncPos2 = PIncPos2 + 1 Mode2 = 1 ElsIf WinCountA2 >= WinCountB2 or StratAvgA2 >= StratAvgB2 and Mode2 = 2 Then ValueY = ValueY - (Increment2*NIncPos2) NIncPos2 = NIncPos2 + 1 Mode2 = 2 EndIf If NIncPos2 > MaxIncrement2 or PIncPos > MaxIncrement2 Then If BestA2 = BestB2 Then ValueY = BestA2 Else If reps2 >= 10 Then WeightedScore2 = 10 Else WeightedScore2 = round((reps2/100)*100) EndIf ValueY = round(((BestA2*(20-WeightedScore2)) + (BestB2*WeightedScore2))/20) //Lower Reps = Less weight assigned to Win% EndIf NIncPos2 = 1 PIncPos2 = 1 ElsIf ValueY > MaxValue2 Then ValueY = MaxValue2 ElsIf ValueY < MinValue2 Then ValueY = MinValue2 EndIF Optimize2 = 0 EndIf // Heuristics Algorithm 2 End // Heuristics Algorithm 3 Start //////////////////////////////////////////////////// If (onmarket[1] = 1 and onmarket = 0) or (longonmarket[1] = 1 and longonmarket and countoflongshares < countoflongshares[1]) or (longonmarket[1] = 1 and longonmarket and countoflongshares > countoflongshares[1]) or (shortonmarket[1] = 1 and shortonmarket and countofshortshares < countofshortshares[1]) or (shortonmarket[1] = 1 and shortonmarket and countofshortshares > countofshortshares[1]) or (longonmarket[1] and shortonmarket) or (shortonmarket[1] and longonmarket) Then optimize3 = optimize3 + 1 EndIf StartingValue3 = 25 //28 //24 //200 //ResetPeriod = 8 //Specify no of months after which to reset optimization Increment3 = 5//20 MaxIncrement3 = 20 //4//Limit of no of increments either up or down Reps3 = 3 //Number of trades to use for analysis //3 MaxValue3 = 125 //270 //Maximum allowed value MinValue3 = increment3 //Minimum allowed value //once monthinit3 = month //once yearinit3 = year //If (year = yearinit3 and month = (monthinit3 + ResetPeriod3)) or (year = (yearinit3 + 1) and ((12 - monthinit3) + month = ResetPeriod3)) Then //ValueZ = StartingValue3 //WinCountB3 = 0 //StratAvgB3 = 0 //BestA3 = 0 //BestB3 = 0 //monthinit3 = month //yearinit3 = year //EndIf once ValueZ = StartingValue3 //BANDEDGE once PIncPos3 = 1 //Positive increment2 Position once NIncPos3 = 1 //Neative increment2 Position once Optimize3 = 0 ////Initialize Heuristicks Engine Counter (Must be Incremented at Position Start or Exit) once Mode2 = 1 //Switches between negative and positive increments //once WinCountB3 = 3 //Initialize Best Win Count //GRAPH WinCountB3 coloured (0,0,0) AS "WinCountB2" //once StratAvgB3 = 4353 //Initialize Best Avg St3ategy Profit //GRAPH StratAvgB3 coloured (0,0,0) AS "StratAvgB3" If Optimize3 = Reps3 Then WinCountA3 = 0 //Initialize current Win Count StratAvgA3 = 0 //Initialize current Avg Strategy Profit HeuristicsCycle = HeuristicsCycle + 1 For i3 = 1 to Reps3 Do If positionperf(i3) > 0 Then WinCountA3 = WinCountA3 + 1 //Increment Current WinCount EndIf StratAvgA3 = StratAvgA3 + (((PositionPerf(i3)*countofposition[i3]*100000)*-1)*-1) Next StratAvgA3 = StratAvgA3/Reps3 //Calculate Current Avg Strategy Profit //Graph (PositionPerf(1)*countofposition[1]*100000)*-1 as "PosPerf1-2" //Graph (PositionPerf(2)*countofposition[2]*100000)*-1 as "PosPerf2-2"///////////// 3? //Graph StratAvgA3*-1 as "StratAvgA3" //once BestA3 = 300 //GRAPH BestA3 coloured (0,0,0) AS "BestA3" If StratAvgA3 >= StratAvgB3 Then StratAvgB3 = StratAvgA3 //Update Best Strategy Profit BestA3 = ValueZ EndIf //once BestB3 = 300 //GRAPH BestB3 coloured (0,0,0) AS "BestB3" If WinCountA3 >= WinCountB3 Then WinCountB3 = WinCountA3 //Update Best Win Count BestB3 = ValueZ EndIf If WinCountA3 > WinCountB3 and StratAvgA3 > StratAvgB3 Then Mode2 = 0 ElsIf WinCountA3 < WinCountB3 and StratAvgA3 < StratAvgB3 and Mode2 = 1 Then ValueZ = ValueZ - (Increment3*NIncPos3) NIncPos3 = NIncPos3 + 1 Mode2 = 2 ElsIf WinCountA3 >= WinCountB3 or StratAvgA3 >= StratAvgB3 and Mode2 = 1 Then ValueZ = ValueZ + (Increment3*PIncPos3) PIncPos3 = PIncPos3 + 1 Mode2 = 1 ElsIf WinCountA3 < WinCountB3 and StratAvgA3 < StratAvgB3 and Mode2 = 2 Then ValueZ = ValueZ + (Increment3*PIncPos3) PIncPos3 = PIncPos3 + 1 Mode2 = 1 ElsIf WinCountA3 >= WinCountB3 or StratAvgA3 >= StratAvgB3 and Mode2 = 2 Then ValueZ = ValueZ - (Increment3*NIncPos3) NIncPos3 = NIncPos3 + 1 Mode2 = 2 EndIf If NIncPos3 > MaxIncrement3 or PIncPos > MaxIncrement3 Then If BestA3 = BestB3 Then ValueZ = BestA3 Else If reps3 >= 10 Then WeightedScore3 = 10 Else WeightedScore3 = round((reps3/100)*100) EndIf ValueZ = round(((BestA3*(20-WeightedScore3)) + (BestB3*WeightedScore3))/20) //Lower Reps = Less weight assigned to Win% EndIf NIncPos3 = 1 PIncPos3 = 1 ElsIf ValueZ > MaxValue3 Then ValueZ = MaxValue3 ElsIf ValueZ < MinValue3 Then ValueZ = MinValue3 EndIF Optimize3 = 0 EndIf // Heuristics Algorithm 3 End //Note: Bandedge: 50 and crosses of 0.5 and -0.5 is good on daily indices. //Bandedge: 24 and crosses of 0.1 and -0.1 work, depending on asset class. //Bandedge Setting: //Univ Osc Bandedge = 25 // Conditions to enter long positions indicator1, ignored = CALL "Ehler's Univ Osc SuperSmoother"[ValueZ] // indicator1,2,3,4 = Univ Osc, ignored = Mid 0 Line c1 = (indicator1 CROSSES OVER ValueX) IF c1 THEN BUY 10 PERPOINT AT MARKET ENDIF // Conditions to exit long positions indicator2, ignored = CALL "Ehler's Univ Osc SuperSmoother"[ValueZ] c2 = (indicator2 CROSSES UNDER 0.0) IF c2 THEN SELL AT MARKET ENDIF // Conditions to enter short positions indicator3, ignored = CALL "Ehler's Univ Osc SuperSmoother"[ValueZ] c3 = (indicator3 CROSSES UNDER ValueY) IF c3 THEN SELLSHORT 10 PERPOINT AT MARKET ENDIF // Conditions to exit short positions indicator4, ignored = CALL "Ehler's Univ Osc SuperSmoother"[ValueZ] c4 = (indicator4 CROSSES OVER 0.0) IF c4 THEN EXITSHORT AT MARKET ENDIF // Stops and targets Set stop trailing 100 GRAPH ValueX GRAPH ValueY GRAPH ValueZWow! … you been burning the midnight oil!? 🙂 So glad you got the Issue sorted re Indicator and your other Systems! Well done and Thank You for Sharing.HELLO Bard and thank you for your work I tried today Sunday to make the code work, but I can’t do it If I understood correctly, the code works with 1 indicator code and 1 strategy code, right? Maybe there is an error and sending two ITF files would be better? cordiallyYeah, I kind of did @GraHal, so many things to look at and test! I know it’s not a “pancea” as you put it and in fact, one of my generic Univ Osc systems (set at -0.8/0.8, bandedge =100) performed far better than the one, two or three ML algo system versions, (I might post that example and see if anyone can figure out why), but it is definitely a highly useful addition to the existing PRC codes that are on this site. I had a lot of thoughts about it, even as writing this now I just thought, what if it was applied to Money Management position sizing? Would anyone like to have a look at that? So on Friday night, having run the ML system with two algos (for Universal Oscillator threshold, individual Long and Short entries (the Bandedge was static and set to 100)) and the ML system with 3 algos which also optimised the Bandedge too as well as the entry thresholds, and then tested them together on Coffee, pls see image, this time ML x2 performed far better that the ML x3. So…. my thought was… @Juanj, is there a way to put both ML2 and ML3 codes in the same system and then have them “fight it out,” or self optimise and find the better of the two systems (ML2 and ML3)? Perhaps the two systems switch and alternate back and forth, much like the self optimised variables selected in these ML algos? It would kind of be like having a backup plan in case one of the two systems performs poorly. If Juanj is busy, can anyone else think of a way that could be done? As for performance metrics that Juanj mentioned, can anyone code Sharp or Sortino Ratios to be included in the ML code? Here’s a copy and paste from Van Tharp’s page on he performance metrics subject:System Performance, Part IV A ratio I like to use is the average annual percentage gain divided by the maximum draw down. This gives us a ratio of how much we make per year divided by how much we would be down at any time during the year. Or in simple terms: How much will I have to risk losing in order to generate my average returns? Any ratio of that is less than 2:1 is suspect (do you really want to risk a 50 percent draw down to make a 50% gain?). Industry standard performance measures. Let’s close by looking at two composite numbers that many money managers use to measure their performance: 1. Sharpe Ratio: (system rate of return – risk-free rate of return) / standard deviation of system returns. The Sharp Ratio measures risk to reward by giving the returns of the system as a ratio to its standard deviation. If the system has very constant returns, it will have a high Sharpe Ratio. A system with returns that vary greatly period-to-period will have a lower Sharpe Ratio. 2. Sortino Ratio: One problem with the Sharpe Ratio is that it penalizes a system for a big up month or “good volatility”. The Sortino Ratio attempts to overcome this issue by dividing the same risk-adjusted rate of return used in the Sharpe Ratio by only the negative deviation or “bad volatility” (the downside semi-variance).
https://www.vantharp.com/trading/system-performance-2/Sure @bertrandpinoy, the next time I launch PRT, which maybe later today or tomorrow.I am commenting as I see them in your post … else I will forget! 🙂this time ML x2 performed far better that the ML x3.
Are you 100% sure HAlgo3 didn’t have any HAlgo 2 references remaining / cross referring?have them “fight it out,” or self optimise
Re above … did you see / understand below? I never got it to work, but you may have more success?? The HeuristicsCycleLimit parameter will determine how many ‘cycles’ each algorithm gets.Are you 100% sure HAlgo3 didn’t have any HAlgo 2 references remaining / cross referring?
ML 3 has the added self optimisation of the ValueZ bandedge setting as well as the original ValueX Long and ValueY Short thresholds (which is all ML 2 is determining, just thresholds). Is that what you mean?
Re above … did you see / understand below? I never got it to work, but you may have more success??
Sorry, not sure I’m following you? “understand below”? What didn’t you get to work?
So the ML2 “fighting it out” with ML3 (from the coffee trade image above), can be achieved with the HeuristicsCycleLimit code below: ?
HeuristicsCycleLimit = 2

once HeuristicsCycle = 0
once HeuristicsAlgo1 = 1
once HeuristicsAlgo2 = 0

If HeuristicsCycle >= HeuristicsCycleLimit  Then
If HeuristicsAlgo1 = 1 Then
HeuristicsAlgo2 = 1
HeuristicsAlgo1 = 0

ElsIf HeuristicsAlgo2 = 1 Then
HeuristicsAlgo1 = 1
HeuristicsAlgo2 = 0
EndIf
HeuristicsCycle = 0
EndIf
So, if my triple ML3 version above was to include this HeuristicsCycleLimit code are you’re saying that the system can then be self optimising the ML2 and ML3 separate systems but now all under the cover of one system? What would the code look like specifically relating to the parts concerning the Cycle Limit? I was looking at https://www.prorealcode.com/topic/machine-learning-in-proorder/page/5/#post-121436 for ideas:
pp=positionperf(0)*100
IF pp<-0.02 and HeuristicsAlgo2 and longonmarket then
HeuristicsAlgo1 = 1
SELL AT MARKET

elsif pp<-0.05  and HeuristicsAlgo1 and shortonmarket then
HeuristicsAlgo2 = 1
EXITSHORT AT MARKET
endif

c1=average[ValueX](close)
c2=average[ValueY](close)
//
condbuy = c1 crosses over c2  and rsi[14](close)<50
condsell= c1 crosses under c2 and rsi[14](close)>40
I can see that “Heuristics Algorithm 1″ and “Heuristics Algorithm 2” are used in the ML2 system and “Heuristics Algorithm 1,” “Heuristics Algorithm 2” and “Heuristics Algorithm 3” are used in the ML3 system, it’s just that I haven’t used the Heuristicyclelimit in either ML2 or ML3 and can’t quite figure the coding in my head to get the New System to self optimise between the ML2 and ML3 components? Hope that makes sense!
Is that what you mean?
No! 🙂 I was asking if you are 100% sure that your HAlgo 3 is 100% unique coded / separate from HAlgo 2 … no duplicated commands or variables?not sure I’m following you? “understand below”?
Did you click on the link that was below the statement I made referring to ‘below’? Here is the link again, it provides a code snippet that JuanJ provided for use when a System includes more than one HAlgo in the same System. The HeuristicsCycleLimit parameter will determine how many ‘cycles’ each algorithm gets.Maybe we should Keep it Simple and only use 1 x HAlgo in each System? OR We try and get ‘JuanJ Heuristic Cycle Limit’ code working in Systems using 2 or more HAlgos??Ha ha, the “joys” of non verbal communication 😀 What is your concern with cross referencing?
If HAlgo 3, as you call the ML3 system is nothing but HAlgo2/ML2 but with an added Bandedge optimisation too — as described above and which can be seen by looking at the code and seeing the extra ValueZ (bandedge) optimisaton — the coffee example/image is still showing what happens when you set these two systems in a race with each other. ML2 wins. The outcome of ML2 and ML 3 are still independent.
Below, right I get you. Three algos in one system… I just got really curious to see what would happen! I’d already read Juanj’s comment about optimising two variables and the potential issue of the algo not being able to determine which one (ValueX or ValueY) is causing the performance increase or decrease: (I copied and pasted all the best points from this thread into a text edit page, it makes getting to grips with the code easier if you can just scroll up and down fast using the highlight tool for bits of code or ideas/phrases like “cyclelimit”).
Francesco asked: “Could this be applied to more then a value in the same system?”
Juanj replied: “Depends on what you mean. If it is the same target variable just used in different sections of the code then yes else no. The reason being that if you apply it to 2 or more different variables the algorithm will not be able to tell which one is causing the performance increase or decrease. I have experimented with literally duplicating the algorithm (slightly changing the name of each variable in the algorithm) and assigning it’s output to a second variable. And although this works to some extent it definitely reduces the accuracy and efficacy of the algorithm for the same reasons mentioned above.’
Machine Learning in ProOrder ProRealTime
Juan: “The HeuristicsCycleLimit parameter will determine how many ‘cycles’ each algorithm gets. “ and… “Best is to code it so that each algo gets it’s own evaluation period. Although it would require at least 2 evaluation periods to really know if performance is increasing or decreasing. So perhaps an additional ‘wait counter’ should be built into the strategy giving each algo 2 or more evaluation periods before giving the next algo a turn.”
https://www.prorealcode.com/topic/machine-learning-in-proorder/page/2/#post-121129
“We try and get ‘JuanJ Heuristic Cycle Limit’ code working in Systems using 2 or more HAlgos??“
It kind of already is, there is ValueX, ValueY and now ValueZ all in within one ML3 system (I put all the settings for each at the top of the code). It may not be optimal, but it does appear to be increasing performance, unless it’s coffee, which worked better with ML2, (the system with two algos, ValueX and ValueY for long and short entry)… which is why I thought why not have ML2 system and ML3 system, (with it’s long (ValueX) and short (ValueY) + Bandedge (ValueZ)) “fight it out” under one roof (in a new system).
My question is how to now code ML2 and ML3 – two formerly separate systems, one which just optimised the long and short entries and the other that did that and also the bandedge setting – to have them now housed under one roof and use the heuristiccyclelimit to let those two (soon to be, if we can code it) sub-systems compete with each other?
Do you or anyone else have any ideas how to code that heuristiccyclelimit for this to work under “one roof?”
“We try and get ‘JuanJ Heuristic Cycle Limit’ code working in Systems using 2 or more HAlgos??“
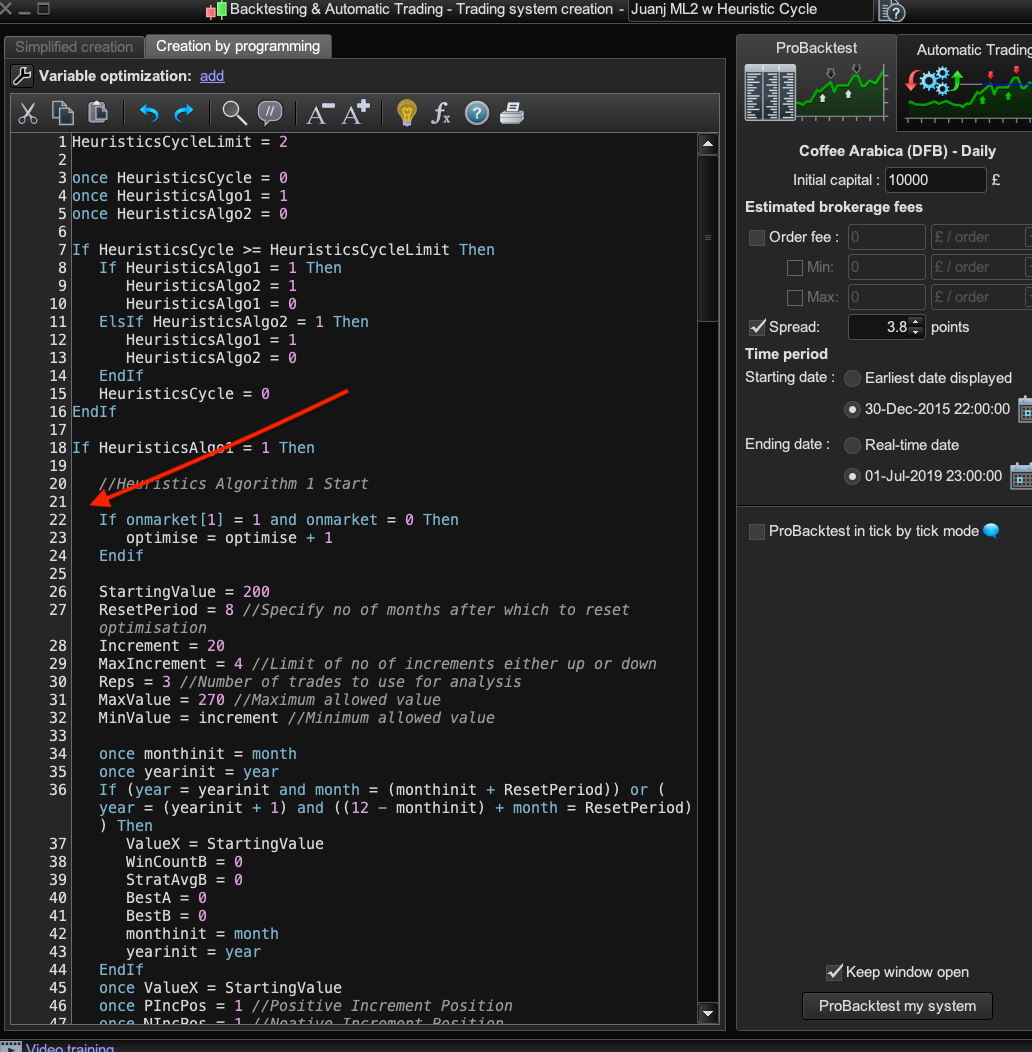
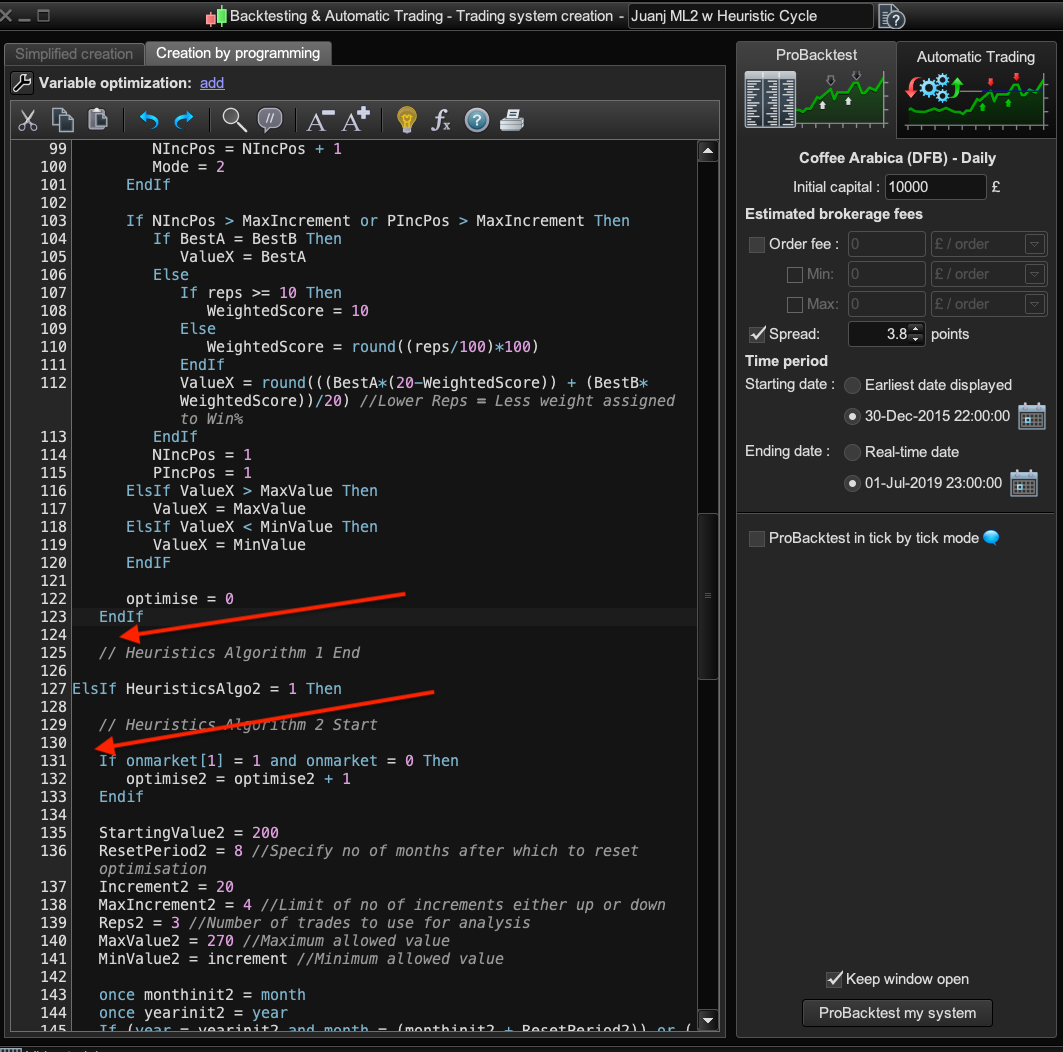
Sorry I see what you mean (I was only looking at the second half of your sentence). I’ve been looking at the Heuristic Cycle Limit code and wondered how to add it without getting floating code from the left margin? Adding Juanj’s heuristic code from https://www.prorealcode.com/topic/machine-learning-in-proorder/page/3/#post-121130 (and including the heuristic initialisation code at the beginning_ also does the same, like the code isn’t syntax-ing correctly because of the float away from the left margin? Pls see images. I’m sure it’s really a simple fix for a coder but closing open statements by adding Endif’s hasn’t fixed it. I also wondered if this is correct if using 3 algos in one system?:
HeuristicsCycleLimit = 2

once HeuristicsCycle = 0
once HeuristicsAlgo1 = 1
once HeuristicsAlgo2 = 0
once HeuristicsAlgo3 = 0

If HeuristicsCycle >= HeuristicsCycleLimit  Then
If HeuristicsAlgo1 = 1 Then
HeuristicsAlgo1 = 0
HeuristicsAlgo2 = 1
HeuristicsAlgo3 = 0

ElsIf HeuristicsAlgo2 = 1 Then
HeuristicsAlgo1 = 1
HeuristicsAlgo2 = 0
HeuristicsAlgo3 = 0

ElsIf HeuristicsAlgo3 = 1 Then
HeuristicsAlgo1 = 0
HeuristicsAlgo2 = 0
HeuristicsAlgo3 = 1
EndIf

HeuristicsCycle = 0
EndIf
If HeuristicsAlgo1 = 1 , then why doesn’t this need to be defined as to what the conditions for this algo is going to be to start its process?
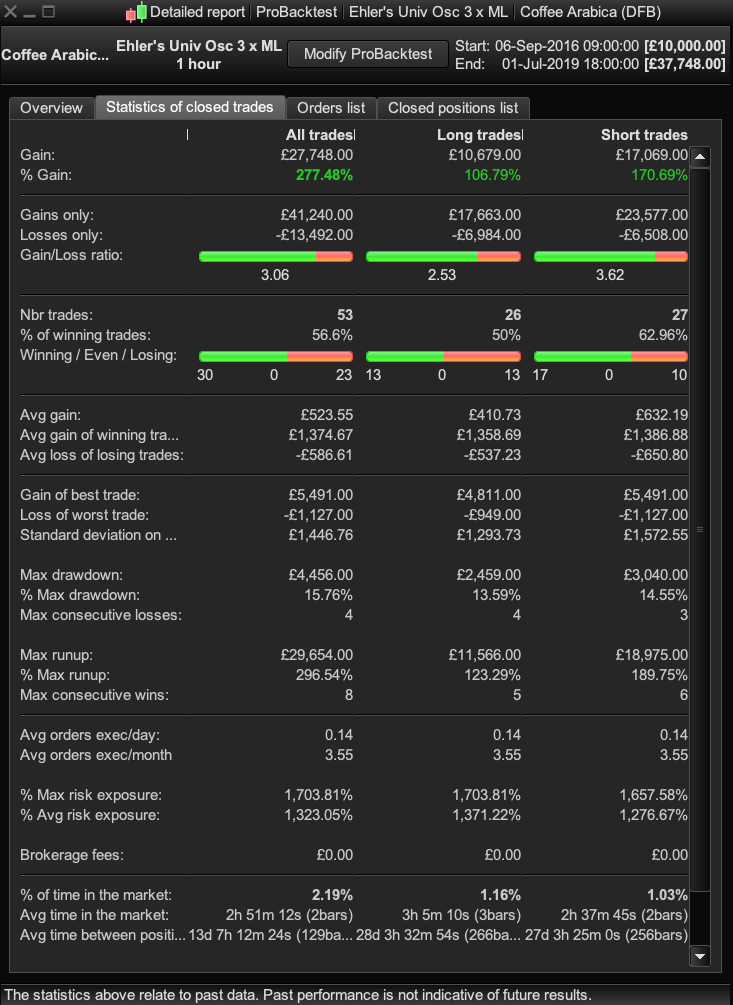
This is the Ehler’s Universal Oscillator ML3 system now with Heuristics cycle code for ValueX and ValueY (Long/Short entry thresholds), but not for Value Z (bandedge) as I just need to confirm the Heuristic for 3 scenarios code (see my attempt above in this post) and it’s getting late..
Pls see images for performance. Thanks once again @Juanj, excellent job.//Ehler's Universal Oscillator Supersmoother Machine Learning (MLx3) // Definition of code parameters DEFPARAM CumulateOrders = True // Cumulating positions deactivated HeuristicsCycleLimit = 2 once HeuristicsCycle = 0 once HeuristicsAlgo1 = 1 once HeuristicsAlgo2 = 0 If HeuristicsCycle >= HeuristicsCycleLimit Then If HeuristicsAlgo1 = 1 Then HeuristicsAlgo2 = 1 HeuristicsAlgo1 = 0 ElsIf HeuristicsAlgo2 = 1 Then HeuristicsAlgo1 = 1 HeuristicsAlgo2 = 0 EndIf HeuristicsCycle = 0 EndIf If HeuristicsAlgo1 = 1 Then // Heuristics Algorithm 1 Start If (onmarket[1] = 1 and onmarket = 0) or (longonmarket[1] = 1 and longonmarket and countoflongshares < countoflongshares[1]) or (longonmarket[1] = 1 and longonmarket and countoflongshares > countoflongshares[1]) or (shortonmarket[1] = 1 and shortonmarket and countofshortshares < countofshortshares[1]) or (shortonmarket[1] = 1 and shortonmarket and countofshortshares > countofshortshares[1]) or (longonmarket[1] and shortonmarket) or (shortonmarket[1] and longonmarket) Then optimize = optimize + 1 EndIf StartingValue = -1 //28 //24 //200 //ResetPeriod = 8 //Specify no of months after which to reset optimization Increment = 0.1//20 MaxIncrement = 20 //4//Limit of no of increments either up or down Reps = 3 //Number of trades to use for analysis //3 MaxValue = 1 //270 //Maximum allowed value MinValue = increment //Minimum allowed value StartingValue2 = -1 //28 //24 //200 //ResetPeriod = 8 //Specify no of months after which to reset optimization Increment2 = 0.1//20 MaxIncrement2 = 20 //4//Limit of no of increments either up or down Reps2 = 3 //Number of trades to use for analysis //3 MaxValue2 = 1 //270 //Maximum allowed value MinValue2 = increment2 //Minimum allowed value StartingValue3 = 25 //28 //24 //200 -- Bandedge 25 //ResetPeriod = 8 //Specify no of months after which to reset optimization Increment3 = 5//20 // steps of 5 Bandedge MaxIncrement3 = 20 //4 Limit of no of increments either up or down //20 lots of 5 Reps3 = 3 //Number of trades to use for analysis //3 MaxValue3 = 125 //270 //Maximum allowed value -- Bandedge 125 MinValue3 = increment3 //Minimum allowed value //once monthinit = month //once yearinit = year //If (year = yearinit and month = (monthinit + ResetPeriod)) or (year = (yearinit + 1) and ((12 - monthinit) + month = ResetPeriod)) Then //ValueX = StartingValue //WinCountB = 0 //StratAvgB = 0 //BestA = 0 //BestB = 0 //monthinit = month //yearinit = year //EndIf once ValueX = StartingValue //LONG THRESHOLD once PIncPos = 1 //Positive Increment Position once NIncPos = 1 //Neative Increment Position once Optimize = 0 ////Initialize Heuristicks Engine Counter (Must be Incremented at Position Start or Exit) once Mode1 = 1 //Switches between negative and positive increments //once WinCountB = 3 //Initialize Best Win Count //GRAPH WinCountB coloured (0,0,0) AS "WinCountB" //once StratAvgB = 4353 //Initialize Best Avg Strategy Profit //GRAPH StratAvgB coloured (0,0,0) AS "StratAvgB" If Optimize = Reps Then WinCountA = 0 //Initialize current Win Count StratAvgA = 0 //Initialize current Avg Strategy Profit HeuristicsCycle = HeuristicsCycle + 1 For i = 1 to Reps Do If positionperf(i) > 0 Then WinCountA = WinCountA + 1 //Increment Current WinCount EndIf StratAvgA = StratAvgA + (((PositionPerf(i)*countofposition[i]*100000)*-1)*-1) Next StratAvgA = StratAvgA/Reps //Calculate Current Avg Strategy Profit //Graph (PositionPerf(1)*countofposition[1]*100000)*-1 as "PosPerf1" //Graph (PositionPerf(2)*countofposition[2]*100000)*-1 as "PosPerf2" //Graph StratAvgA*-1 as "StratAvgA" //once BestA = 300 //GRAPH BestA coloured (0,0,0) AS "BestA" If StratAvgA >= StratAvgB Then StratAvgB = StratAvgA //Update Best Strategy Profit BestA = ValueX EndIf //once BestB = 300 //GRAPH BestB coloured (0,0,0) AS "BestB" If WinCountA >= WinCountB Then WinCountB = WinCountA //Update Best Win Count BestB = ValueX EndIf If WinCountA > WinCountB and StratAvgA > StratAvgB Then Mode1 = 0 //Strategy is performing well with current variable, do not optimise ElsIf WinCountA < WinCountB and StratAvgA < StratAvgB and Mode1 = 2 Then ValueX = ValueX + (Increment*PIncPos) PIncPos = PIncPos + 1 Mode1 = 1 //For strategy performing worse Next cycle optimise with positive increments ElsIf WinCountA < WinCountB and StratAvgA < StratAvgB and Mode1 = 1 Then ValueX = ValueX - (Increment*NIncPos) NIncPos = NIncPos + 1 Mode1 = 2 //For strategy performing worse Next cycle optimise with negative increments ElsIf WinCountA >= WinCountB or StratAvgA >= StratAvgB and Mode1 = 1 Then ValueX = ValueX + (Increment*PIncPos) PIncPos = PIncPos + 1 Mode1 = 1 //For strategy performing better Next cycle again optimise with positive increments ElsIf WinCountA >= WinCountB or StratAvgA >= StratAvgB and Mode1 = 2 Then ValueX = ValueX - (Increment*NIncPos) NIncPos = NIncPos + 1 Mode1 = 2 //For strategy performing better Next cycle again optimise with negative increments EndIf If NIncPos > MaxIncrement or PIncPos > MaxIncrement Then If BestA = BestB Then ValueX = BestA Else If reps >= 10 Then WeightedScore = 10 Else WeightedScore = round((reps/100)*100) EndIf ValueX = round(((BestA*(20-WeightedScore)) + (BestB*WeightedScore))/20) //Lower Reps = Less weight assigned to Win% EndIf NIncPos = 1 PIncPos = 1 ElsIf ValueX > MaxValue Then ValueX = MaxValue ElsIf ValueX < MinValue Then ValueX = MinValue EndIF Optimize = 0 EndIf // Heuristics Algorithm 1 End Endif // Heuristics Algorithm 2 Start //////////////////////////////// If HeuristicsAlgo2 = 1 Then If (onmarket[1] = 1 and onmarket = 0) or (longonmarket[1] = 1 and longonmarket and countoflongshares < countoflongshares[1]) or (longonmarket[1] = 1 and longonmarket and countoflongshares > countoflongshares[1]) or (shortonmarket[1] = 1 and shortonmarket and countofshortshares < countofshortshares[1]) or (shortonmarket[1] = 1 and shortonmarket and countofshortshares > countofshortshares[1]) or (longonmarket[1] and shortonmarket) or (shortonmarket[1] and longonmarket) Then optimize2 = optimize2 + 1 EndIf //StartingValue2 = -1 //28 //24 //200 //etc //etc //MinValue2 = increment2 //Minimum allowed value //once monthinit2 = month //once yearinit2 = year //If (year = yearinit2 and month = (monthinit2 + ResetPeriod2)) or (year = (yearinit2 + 1) and ((12 - monthinit2) + month = ResetPeriod2)) Then //ValueY = StartingValue2 //WinCountB2 = 0 //StratAvgB2 = 0 //BestA2 = 0 //BestB2 = 0 //monthinit2 = month //yearinit2 = year //EndIf once ValueY = StartingValue2 ///SHORT THRESHOLD once PIncPos2 = 1 //Positive increment2 Position once NIncPos2 = 1 //Neative increment2 Position once Optimize2 = 0 ////Initialize Heuristicks Engine Counter (Must be Incremented at Position Start or Exit) once Mode2 = 1 //Switches between negative and positive increments //once WinCountB2 = 3 //Initialize Best Win Count //GRAPH WinCountB2 coloured (0,0,0) AS "WinCountB2" //once StratAvgB2 = 4353 //Initialize Best Avg Strategy Profit //GRAPH StratAvgB2 coloured (0,0,0) AS "StratAvgB2" If Optimize2 = Reps2 Then WinCountA2 = 0 //Initialize current Win Count StratAvgA2 = 0 //Initialize current Avg Strategy Profit HeuristicsCycle = HeuristicsCycle + 1 For i2 = 1 to Reps2 Do If positionperf(i2) > 0 Then WinCountA2 = WinCountA2 + 1 //Increment Current WinCount EndIf StratAvgA2 = StratAvgA2 + (((PositionPerf(i2)*countofposition[i2]*100000)*-1)*-1) Next StratAvgA2 = StratAvgA2/Reps2 //Calculate Current Avg Strategy Profit //Graph (PositionPerf(1)*countofposition[1]*100000)*-1 as "PosPerf1-2" //Graph (PositionPerf(2)*countofposition[2]*100000)*-1 as "PosPerf2-2" //Graph StratAvgA2*-1 as "StratAvgA2" //once BestA2 = 300 //GRAPH BestA2 coloured (0,0,0) AS "BestA2" If StratAvgA2 >= StratAvgB2 Then StratAvgB2 = StratAvgA2 //Update Best Strategy Profit BestA2 = ValueY EndIf //once BestB2 = 300 //GRAPH BestB2 coloured (0,0,0) AS "BestB2" If WinCountA2 >= WinCountB2 Then WinCountB2 = WinCountA2 //Update Best Win Count BestB2 = ValueY EndIf If WinCountA2 > WinCountB2 and StratAvgA2 > StratAvgB2 Then Mode2 = 0 //Strategy is performing well with current variable, do not optimise ElsIf WinCountA2 < WinCountB2 and StratAvgA2 < StratAvgB2 and Mode2 = 2 Then ValueY = ValueY + (Increment2*PIncPos2) PIncPos2 = PIncPos2 + 1 Mode2 = 1 //For strategy performing worse Next cycle optimise with positive increments ElsIf WinCountA2 < WinCountB2 and StratAvgA2 < StratAvgB2 and Mode2 = 1 Then ValueY = ValueY - (Increment2*NIncPos2) NIncPos2 = NIncPos2 + 1 Mode2 = 2 //For strategy performing worse Next cycle optimise with negative increments ElsIf WinCountA2 >= WinCountB2 or StratAvgA2 >= StratAvgB2 and Mode2 = 1 Then ValueY = ValueY + (Increment2*PIncPos2) PIncPos2 = PIncPos2 + 1 Mode2 = 1 //For strategy performing better Next cycle again optimise with positive increments ElsIf WinCountA2 >= WinCountB2 or StratAvgA2 >= StratAvgB2 and Mode2 = 2 Then ValueY = ValueY - (Increment2*NIncPos2) NIncPos2 = NIncPos2 + 1 Mode2 = 2 //For strategy performing better Next cycle again optimise with negative increments EndIf If NIncPos2 > MaxIncrement2 or PIncPos > MaxIncrement2 Then If BestA2 = BestB2 Then ValueY = BestA2 Else If reps2 >= 10 Then WeightedScore2 = 10 Else WeightedScore2 = round((reps2/100)*100) EndIf ValueY = round(((BestA2*(20-WeightedScore2)) + (BestB2*WeightedScore2))/20) //Lower Reps = Less weight assigned to Win% EndIf NIncPos2 = 1 PIncPos2 = 1 ElsIf ValueY > MaxValue2 Then ValueY = MaxValue2 ElsIf ValueY < MinValue2 Then ValueY = MinValue2 EndIF Optimize2 = 0 EndIf // Heuristics Algorithm 2 End Endif // Heuristics Algorithm 3 Start /////////////////////////////////////// //If HeuristicsAlgo3 = 1 Then If (onmarket[1] = 1 and onmarket = 0) or (longonmarket[1] = 1 and longonmarket and countoflongshares < countoflongshares[1]) or (longonmarket[1] = 1 and longonmarket and countoflongshares > countoflongshares[1]) or (shortonmarket[1] = 1 and shortonmarket and countofshortshares < countofshortshares[1]) or (shortonmarket[1] = 1 and shortonmarket and countofshortshares > countofshortshares[1]) or (longonmarket[1] and shortonmarket) or (shortonmarket[1] and longonmarket) Then optimize3 = optimize3 + 1 EndIf //StartingValue3 = 25 //28 //24 //200 -- Bandedge 25 //etc //etc //MinValue3 = increment3 //Minimum allowed value //once monthinit3 = month //once yearinit3 = year //If (year = yearinit3 and month = (monthinit3 + ResetPeriod3)) or (year = (yearinit3 + 1) and ((12 - monthinit3) + month = ResetPeriod3)) Then //ValueZ = StartingValue3 //WinCountB3 = 0 //StratAvgB3 = 0 //BestA3 = 0 //BestB3 = 0 //monthinit3 = month //yearinit3 = year //EndIf once ValueZ = StartingValue3 //BANDEDGE once PIncPos3 = 1 //Positive increment2 Position once NIncPos3 = 1 //Neative increment2 Position once Optimize3 = 0 ////Initialize Heuristicks Engine Counter (Must be Incremented at Position Start or Exit) once Mode2 = 1 //Switches between negative and positive increments //once WinCountB3 = 3 //Initialize Best Win Count //GRAPH WinCountB3 coloured (0,0,0) AS "WinCountB2" //once StratAvgB3 = 4353 //Initialize Best Avg St3ategy Profit //GRAPH StratAvgB3 coloured (0,0,0) AS "StratAvgB3" If Optimize3 = Reps3 Then WinCountA3 = 0 //Initialize current Win Count StratAvgA3 = 0 //Initialize current Avg Strategy Profit //HeuristicsCycle = HeuristicsCycle + 1 For i3 = 1 to Reps3 Do If positionperf(i3) > 0 Then WinCountA3 = WinCountA3 + 1 //Increment Current WinCount EndIf StratAvgA3 = StratAvgA3 + (((PositionPerf(i3)*countofposition[i3]*100000)*-1)*-1) Next StratAvgA3 = StratAvgA3/Reps3 //Calculate Current Avg Strategy Profit //Graph (PositionPerf(1)*countofposition[1]*100000)*-1 as "PosPerf1-2" //Graph (PositionPerf(2)*countofposition[2]*100000)*-1 as "PosPerf2-2"///////////// 3? //Graph StratAvgA3*-1 as "StratAvgA3" //once BestA3 = 300 //GRAPH BestA3 coloured (0,0,0) AS "BestA3" If StratAvgA3 >= StratAvgB3 Then StratAvgB3 = StratAvgA3 //Update Best Strategy Profit BestA3 = ValueZ EndIf //once BestB3 = 300 //GRAPH BestB3 coloured (0,0,0) AS "BestB3" If WinCountA3 >= WinCountB3 Then WinCountB3 = WinCountA3 //Update Best Win Count BestB3 = ValueZ EndIf If WinCountA3 > WinCountB3 and StratAvgA3 > StratAvgB3 Then Mode2 = 0 //Strategy is performing well with current variable, do not optimise ElsIf WinCountA3 < WinCountB3 and StratAvgA3 < StratAvgB3 and Mode2 = 2 Then ValueZ = ValueZ + (Increment3*PIncPos3) PIncPos3 = PIncPos3 + 1 Mode2 = 1 //For strategy performing worse Next cycle optimise with positive increments ElsIf WinCountA3 < WinCountB3 and StratAvgA3 < StratAvgB3 and Mode2 = 1 Then ValueZ = ValueZ - (Increment3*NIncPos3) NIncPos3 = NIncPos3 + 1 Mode2 = 2 //For strategy performing worse Next cycle optimise with negative increments ElsIf WinCountA3 >= WinCountB3 or StratAvgA3 >= StratAvgB3 and Mode2 = 1 Then ValueZ = ValueZ + (Increment3*PIncPos3) PIncPos3 = PIncPos3 + 1 Mode2 = 1 //For strategy performing better Next cycle again optimise with positive increments ElsIf WinCountA3 >= WinCountB3 or StratAvgA3 >= StratAvgB3 and Mode2 = 2 Then ValueZ = ValueZ - (Increment3*NIncPos3) NIncPos3 = NIncPos3 + 1 Mode2 = 2 //For strategy performing better Next cycle again optimise with negative increments EndIf If NIncPos3 > MaxIncrement3 or PIncPos > MaxIncrement3 Then If BestA3 = BestB3 Then ValueZ = BestA3 Else If reps3 >= 10 Then WeightedScore3 = 10 Else WeightedScore3 = round((reps3/100)*100) EndIf ValueZ = round(((BestA3*(20-WeightedScore3)) + (BestB3*WeightedScore3))/20) //Lower Reps = Less weight assigned to Win% EndIf NIncPos3 = 1 PIncPos3 = 1 ElsIf ValueZ > MaxValue3 Then ValueZ = MaxValue3 ElsIf ValueZ < MinValue3 Then ValueZ = MinValue3 EndIF Optimize3 = 0 EndIf // Heuristics Algorithm 3 End // Conditions to enter long positions indicator1, ignored = CALL "Ehler's Univ Osc SuperSmoother"[ValueZ]// indicator1,2,3,4 = Univ Osc, ignored = Mid 0 Line c1 = (indicator1 CROSSES OVER ValueX) IF c1 THEN BUY 10 PERPOINT AT MARKET ENDIF // Conditions to exit long positions indicator2, ignored = CALL "Ehler's Univ Osc SuperSmoother"[ValueZ] c2 = (indicator2 CROSSES UNDER 0.0) IF c2 THEN SELL AT MARKET ENDIF // Conditions to enter short positions indicator3, ignored = CALL "Ehler's Univ Osc SuperSmoother"[ValueZ] c3 = (indicator3 CROSSES UNDER ValueY) IF c3 THEN SELLSHORT 10 PERPOINT AT MARKET ENDIF // Conditions to exit short positions indicator4, ignored = CALL "Ehler's Univ Osc SuperSmoother"[ValueZ] c4 = (indicator4 CROSSES OVER 0.0) IF c4 THEN EXITSHORT AT MARKET ENDIF // Stops and targets Set stop trailing 100 GRAPH ValueX GRAPH ValueY GRAPH ValueZ -
AuthorPosts
- You must be logged in to reply to this topic.
Machine Learning in ProOrder ProRealTime
ProOrder: Automated Strategies & Backtesting
Summary
This topic contains 454 replies,
has 32 voices, and was last updated by ![]() Khaled
Khaled
4 years, 5 months ago.
Topic Details
| Forum: | ProOrder: Automated Strategies & Backtesting |
| Language: | English |
| Started: | 08/06/2017 |
| Status: | Active |
| Attachments: | 207 files |
About personal data collected
The information collected on this form is stored in a computer file by ProRealCode to create and access your ProRealCode profile. This data is kept in a secure database for the duration of the member's membership. They will be kept as long as you use our services and will be automatically deleted after 3 years of inactivity. Your personal data is used to create your private profile on ProRealCode. This data is maintained by SAS ProRealCode, 407 rue Freycinet, 59151 Arleux, France. If you subscribe to our newsletters, your email address is provided to our service provider "MailChimp" located in the United States, with whom we have signed a confidentiality agreement. This company is also compliant with the EU/Swiss Privacy Shield, and the GDPR. For any request for correction or deletion concerning your data, you can directly contact the ProRealCode team by email at privacy@prorealcode.com If you would like to lodge a complaint regarding the use of your personal data, you can contact your data protection supervisory authority.