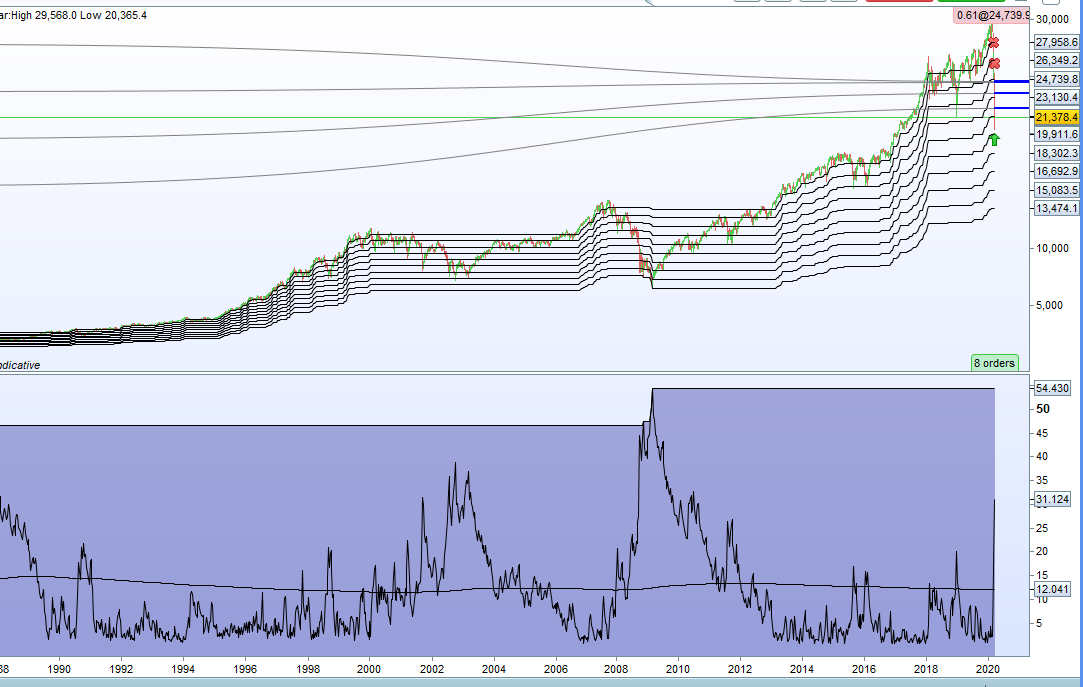
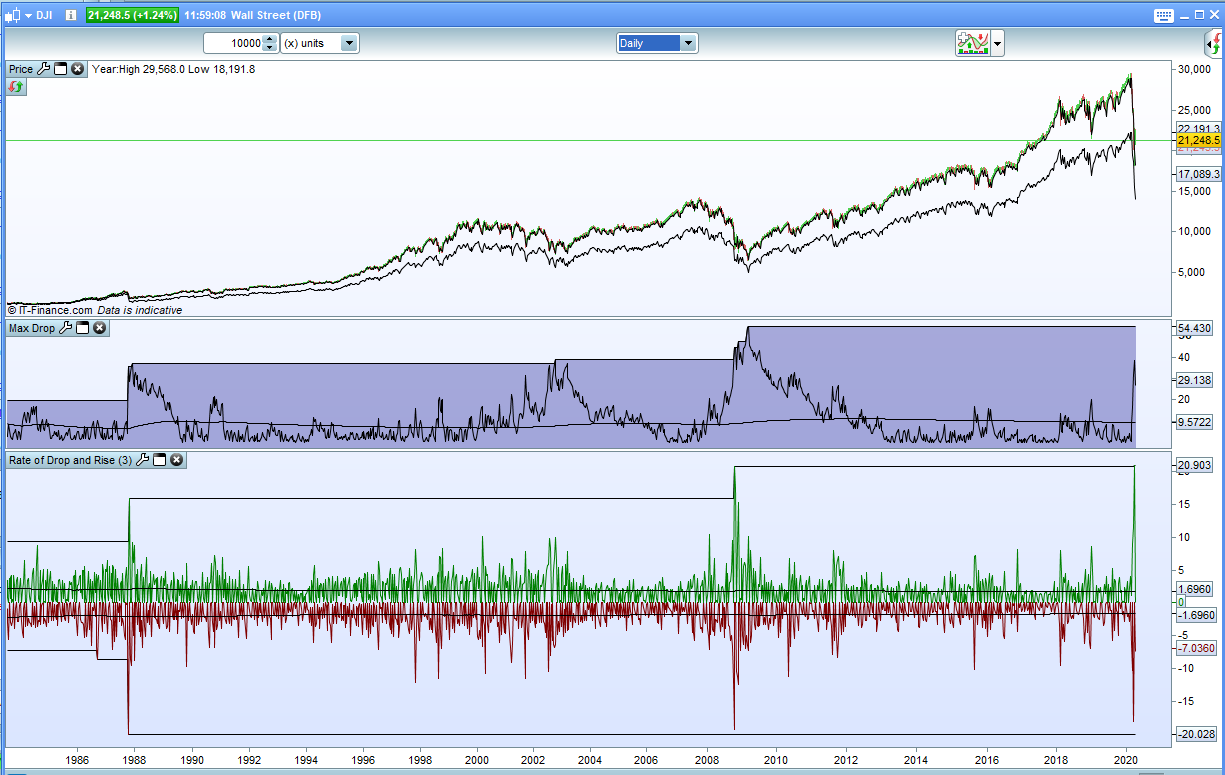
The recent big drops in markets got me thinking about how big this drop is compared to history so I wrote a simple indicator that records the highest high and calculates the percentage drop from it. It also stores the value of the largest ever drop. It also calculates an average drop value but this is just an average of every candles result as every candle has a low below the highest ever high whether the market is rising or falling.
hh = max(high,hh)

if low < hh then
drop =  hh-low
endif

dropperc = (drop/hh)*100
maxdropperc = max(maxdropperc,dropperc)

total = total + dropperc
count = count + 1
avgdrop = total/count

return maxdropperc as "max drop%", dropperc as "drop%", avgdrop as "average drop"
We can see that on the DJI the current drop is 31% from our highest high compared to the biggest ever drop which was 54% in 2008/2009. So we could still have a bit of a way to go!
I also turned it into a version that you can add to the price chart that draws levels at every 10% of the biggest ever drop percentage.
hh = max(high,hh)

if low < hh then
drop =  hh-low
endif

dropperc = (drop/hh)*100
maxdropperc = max(maxdropperc,dropperc)

maxdroplevel = hh * (1 -(maxdropperc/100))
maxdroplevel10 = hh * (1 -((maxdropperc*0.1)/100))
maxdroplevel20 = hh * (1 -((maxdropperc*0.2)/100))
maxdroplevel30 = hh * (1 -((maxdropperc*0.3)/100))
maxdroplevel40 = hh * (1 -((maxdropperc*0.4)/100))
maxdroplevel50 = hh * (1 -((maxdropperc*0.5)/100))
maxdroplevel60 = hh * (1 -((maxdropperc*0.6)/100))
maxdroplevel70 = hh * (1 -((maxdropperc*0.7)/100))
maxdroplevel80 = hh * (1 -((maxdropperc*0.8)/100))
maxdroplevel90 = hh * (1 -((maxdropperc*0.9)/100))

return maxdroplevel as "max drop", maxdroplevel10 as "10%", maxdroplevel20 as "20%", maxdroplevel30 as "30%", maxdroplevel40 as "40%", maxdroplevel50 as "50%", maxdroplevel60 as "60%", maxdroplevel70 as "70%", maxdroplevel80 as "80%", maxdroplevel90 as "90%"
I post them here just in case they are of interest to anyone.
What about the RSI[14] oversold level? 😆
The RSI14 thinks we are very very oversold but then no one has ever told it about a thing called coronavirus or a thing called Trump or a thing called Brexit being managed by a thing called Boris!
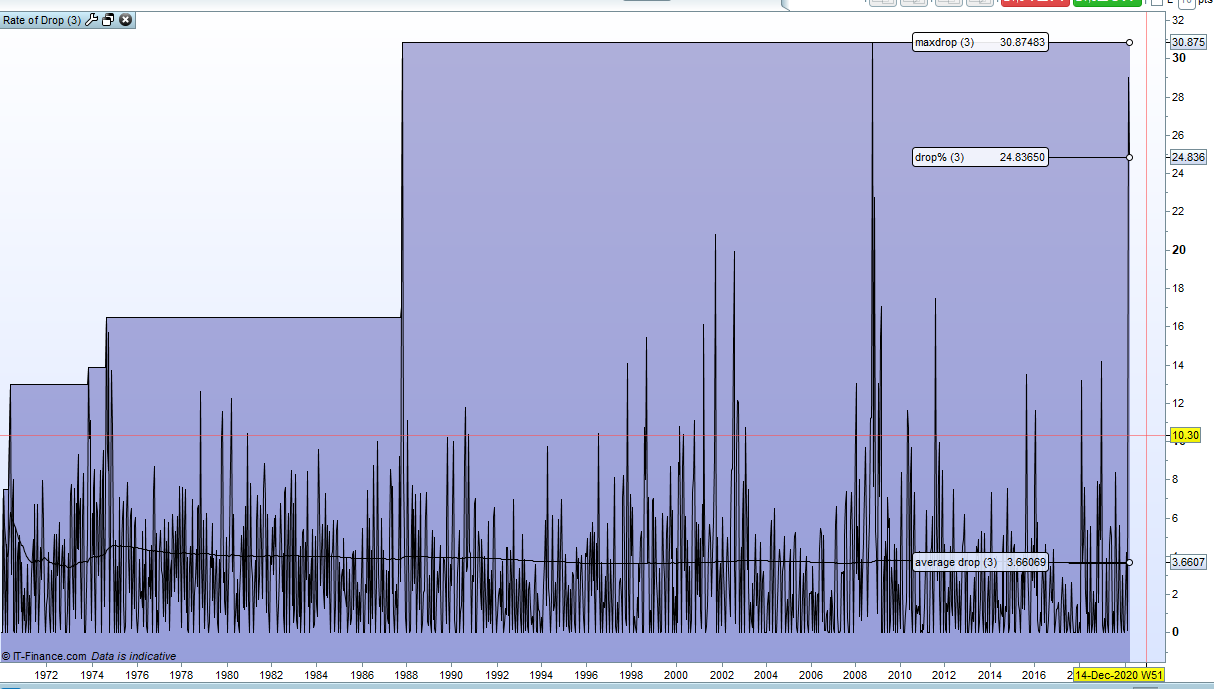
Another thing to consider when analysing drops is the speed of the drop so I wrote this simple indicator that records the percentage drop in p bars and stores the largest percentage drop in p bars. It also calculates an average drop in p bars.
Interestingly the biggest drop in 3 bars on the weekly chart was recorded in the 1987 crash at just under a 31% drop. This was then repeated in 2008 and then last week we closed out with a three week drop of 29%.
p = 3

if barindex > p then
drop = max(0,high[p-1] - low)
dropperc = (drop/high[p-1])*100
maxdrop = max(dropperc,maxdrop)

if drop <> 0 then
total = total + dropperc
count = count + 1
avg = total/count
endif
endif

return maxdrop as "maxdrop", dropperc as "drop%", avg as "average drop"
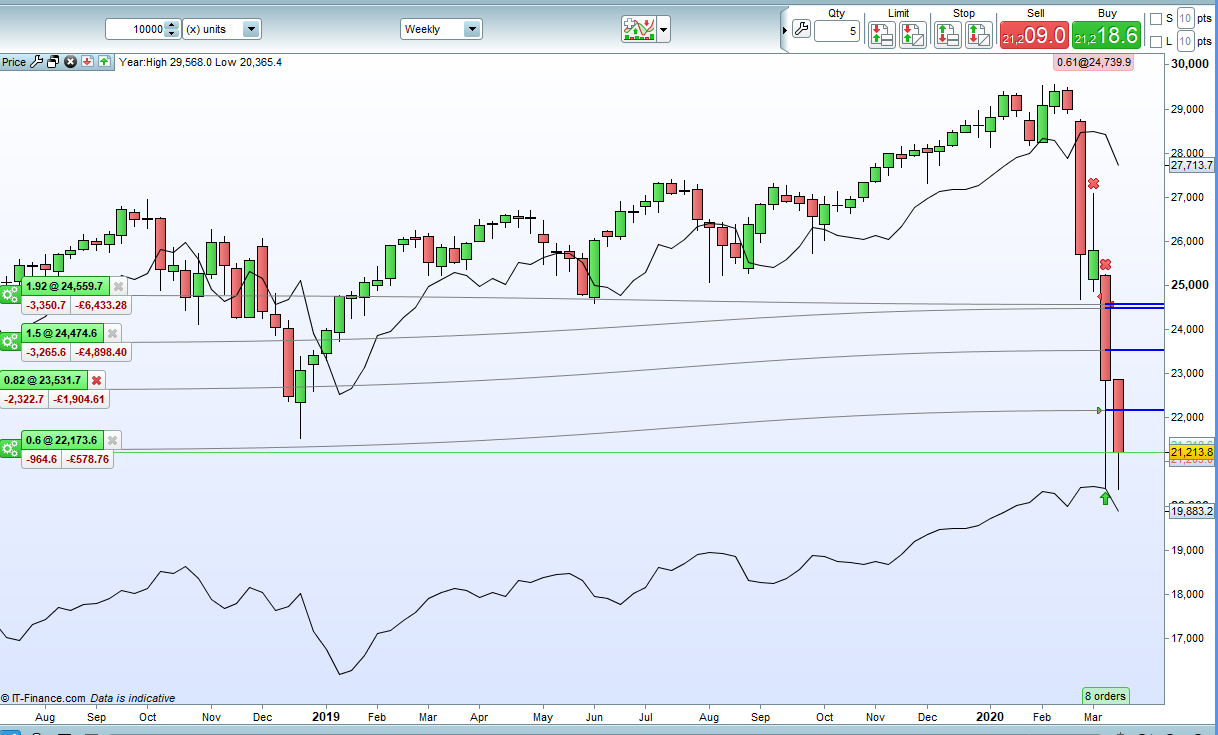
I turned the rate of drop calculator into an indicator that draws lines on price. One line that is the value for the average drop in p bars and the other is the value for the maximum drop. Both are calculated from the high p bars back.
In the example in the image we can see that last week the DJI price almost hit the maximum drop price compared to the biggest three week price drop ever.
//p = 3

if barindex > p then
drop = max(0,high[p-1] - low)
dropperc = (drop/high[p-1])*100
maxdrop = max(dropperc,maxdrop)

if drop <> 0 then
total = total + dropperc
count = count + 1
avg = total/count
endif
endif

maxdroplev = high[p] * (1 - (maxdrop[1]/100))
avgdroplev = high[p] * (1 - (avg[1]/100))

return maxdroplev as "max drop", avgdroplev as "average drop"
DJI price almost hit the maximum drop price
Last week the tail / wick did touch the max drop price?
It fell short by 23 pips.
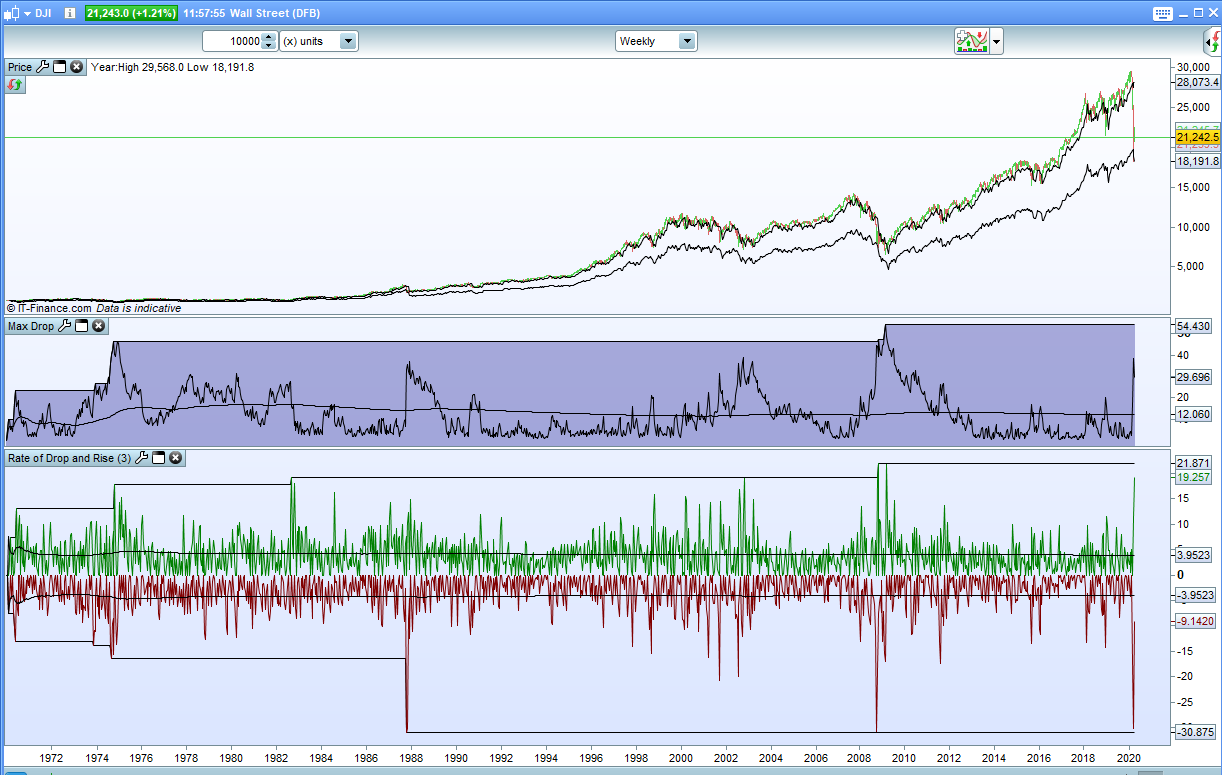
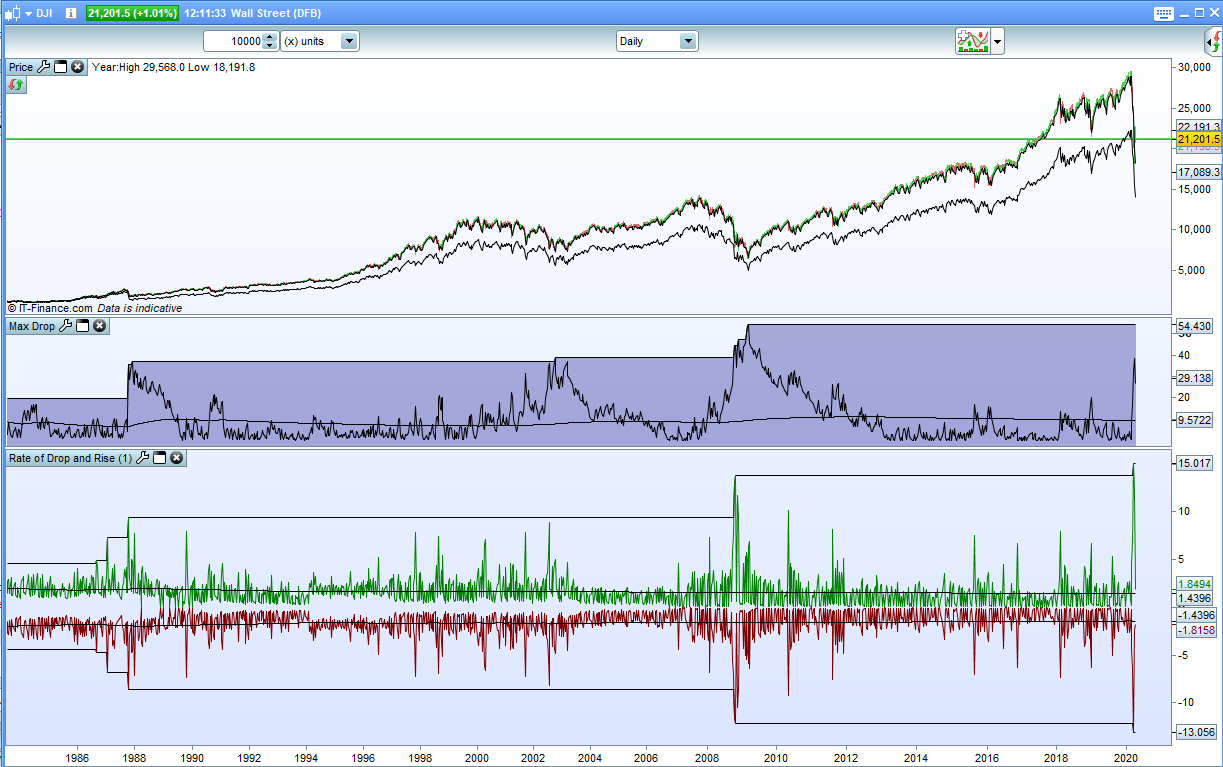
I decided to turn my ‘Rate of Drop’ indicator into a ‘Rate of Drop and Rise’ indicator. So it measure the % drop or % rise in the last p bars. The drop is shown as a red line and negative percentage and the rise as a green line and positive percentage. It records the all time biggest rate of drop and rate of rise as well as the averages.
The images show the Dow Jones weekly and daily with rate of drop and rise in 3 weeks and 3 days plotted in the first two images. It seems that this is not really an out of the ordinary crash. The DJI did manage a new biggest rise % in a 3 day period but only just. The market did however manage to create new all time record for the biggest percentage drop for a single one day candle.
//p = 3

if barindex > p-1 then
drop = max(0,high[p-1] - low)
dropperc = (drop/high[p-1])*100
maxdrop = max(dropperc,maxdrop)

if drop <> 0 then
droptotal = droptotal + dropperc
dropcount = dropcount + 1
dropavg = droptotal/dropcount
endif
endif


rise = max(0,high-low[p-1])
riseperc = (rise/low[p-1])*100
maxrise = max(riseperc,maxrise)

if rise <> 0 then
risetotal = risetotal + riseperc
risecount = risecount + 1
dropavg = risetotal/risecount
endif

return -maxdrop as "maxdrop", -dropperc coloured(128,0,0) as "drop%", -dropavg as "average drop",maxrise as "maxrise", riseperc coloured(0,128,0) as "rise%" , dropavg as "average rise"