Bard
BardParticipant
Master
Hi, I’m in the process of converting a couple of Ameritrade’s “Think or Swim” options platform volatility indicators here for PRC users and just wondered what I’m missing code wise to get this particular indicator to also produce negative results instead of just positive results only. Thanks.
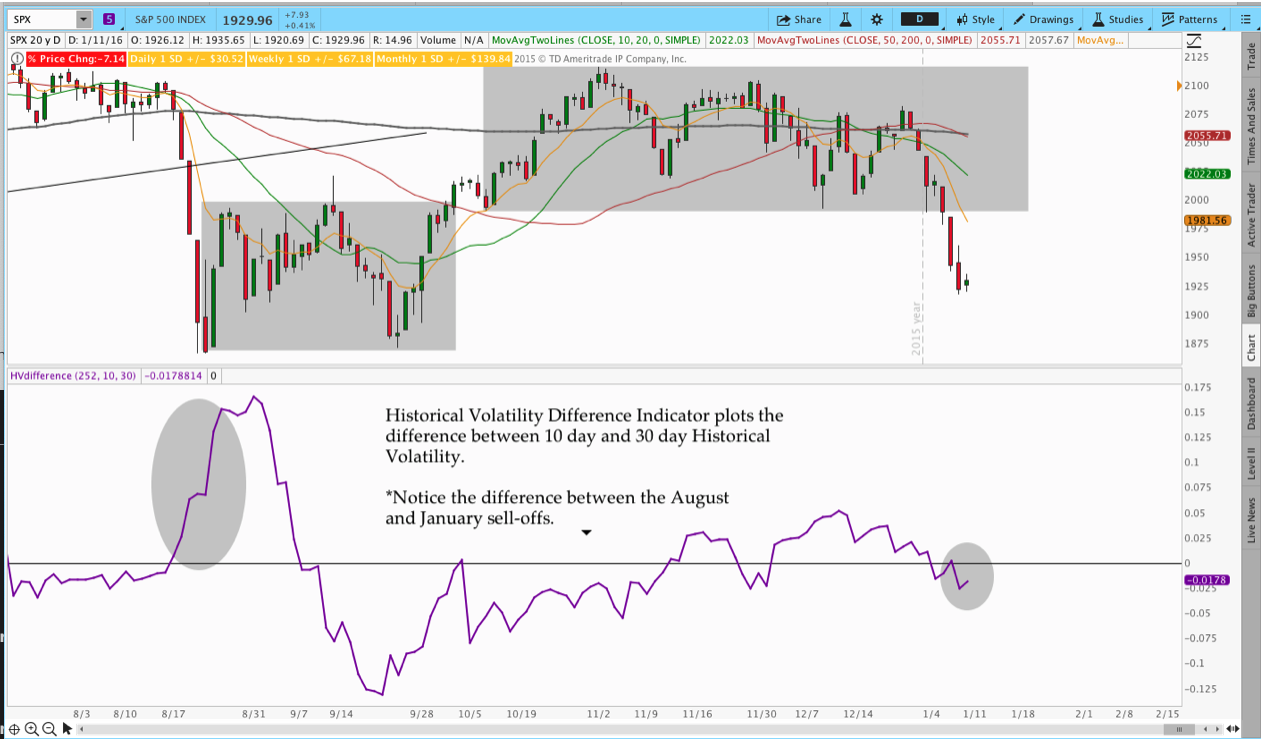
“This indicator is similar to HVIV and plots the difference between two time periods of Historical Volatility. For example, we can plot the difference between 10 day and 30 day HV. When the value is positive, it means the market has been more volatile over the past 10 days than the past 30. When the value is negative, the market has been calmer than the previous 30 days. The slope of the indicator also helps you understand how quickly the relationship is changing. Note the significant divergence between the August 2015 and January 2016 sell-off’s.” http://www.thetatrend.com/4-volatility-indicators-for-options-trading-with-thinkorswim-thinkscript-code/
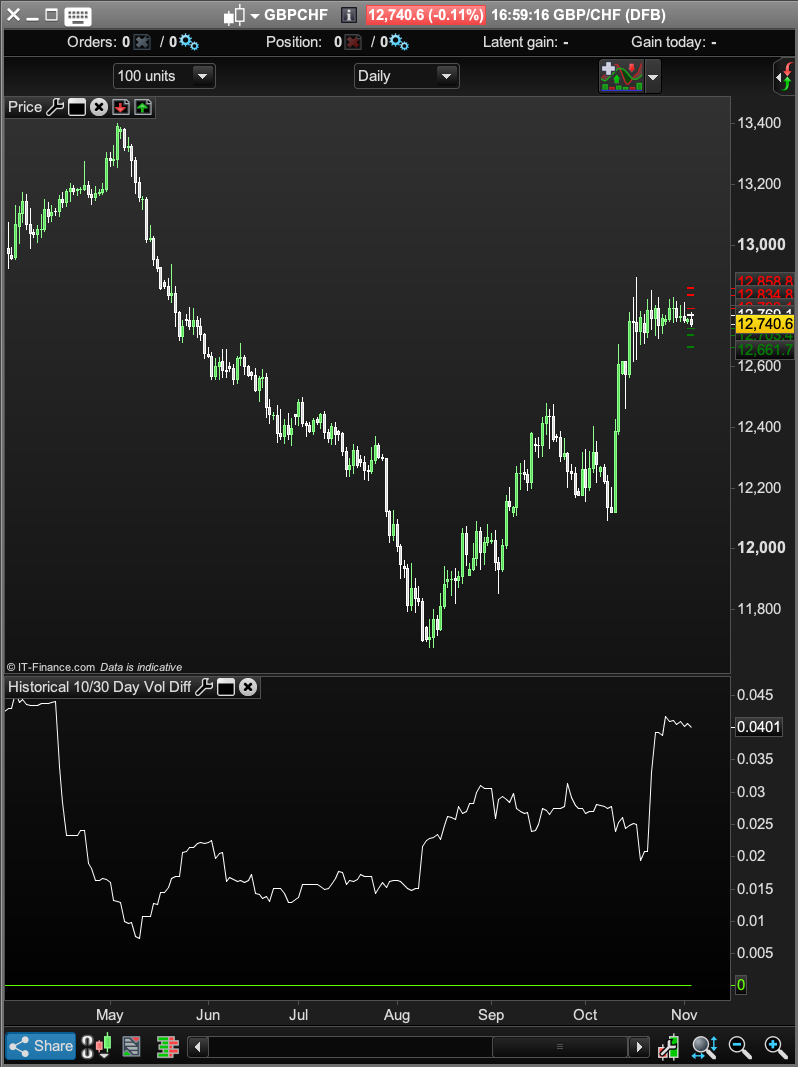
Here’s the PRC code and chart image:
//HV 10 and 30 Difference
//Provides difference between 2 Historical Volatility periods (10 and 30 day)

//Period Inputs
period = 252
shortLength = 10
longLength = 30

Price = Log(close / close[1])

//Calculate Values
HVShort = std(Price)[shortLength] * Sqrt(shortLength * period) / (shortLength - 1)
HVLong = std(Price)[longLength] * Sqrt(longLength * period) / (period - 1)

HVdifference = HVShort-HVLong

Return 0 as "0", HVdifference as "Historic Volatility 10-30 Day"
Here’s the original code and image:
 #HVdifference
 #Provides difference between 2 HV periods (10 and 30 day)
 #Feel free to share the code with a link back to thetatrend.com
 declare lower;
 declare hide_on_intraday;
 #Period Inputs
 input longLength = 252;
 input shortLength = 10;
 input shortLengthb = 30;
 def clLog = Log(close / close[1]);
 #Calculate Values
 def HV = stdev(clLog, shortLength) * Sqrt(shortLength * longLength / (
 shortLength - 1));
 def HV2 = stdev(clLog, shortLengthb) * Sqrt(shortLengthb * longLength
 / (shortLengthb - 1));
 #Plot
 plot diff = HV-HV2;
 diff.SetDefaultColor(GetColor(0));
 plot zero = 0;
 zero.SetDefaultColor(Color.Black);
Bard – You double posted topics. I deleted the other one. Please try to be more careful when posting.
BardParticipant
Master
I haven’t double posted. If you read the post/look at the images you can see that.
It was my first post for a different Think or Swim indicator. It just had a similar intro but it’s for a 20 and 60 day Historic Volatility with a 20 Implied Vol line too. Can you please put it back up, thanks.
Can you please put it back up, thanks.
Not possible I’m afraid. Deleted is deleted.
Can I suggest that in the future to avoid confusion you do not post two topics at the same time with similar titles (if not identical titles if I recall) and very similar content about virtually identical subjects and with identical introductions!
If I hadn’t deleted one of them then it would just end up in complete confusion for those trying to answer one or both of the posts anyway. Why not ask one question at a time and then move on to the alternative indicator version as the the topic progresses?
The syntax for the STD instruction is not right. Period is before applied price:
There is also difference in what should be square rooted, I fixed it. (not tested!)
//HV 10 and 30 Difference
//Provides difference between 2 Historical Volatility periods (10 and 30 day)

//Period Inputs
period = 252
shortLength = 10
longLength = 30

Price = Log(close / close[1])

//Calculate Values
HVShort = std[shortLength](Price) * Sqrt(shortLength * period / (shortLength - 1))
HVLong = std[longLength](Price)* Sqrt(longLength * period / (period - 1))

HVdifference = HVShort-HVLong

Return 0 as "0", HVdifference as "Historic Volatility 10-30 Day"
BardParticipant
Master
Phew, good job I didn’t have time to post the other ones! I would have described them all with the same intro because they are all from Ameritrade’s Think or Swim platform but I understand the possible confusion to someone who doesn’t read the title or description of what these distinct indicators do — they have diferent titles and functions giving you different insights and ways to monitor (future) option premium pricing.
Btw, why put two, (three or four) indicators all into one thread, that sounds more confusing to me and would make them harder to find? I really would prefer to share them as separate posts if it’s ok with you because I think possible different technical questions about the different indicators would result in a confusing and disjointed thread, no?
BardParticipant
Master
Cheers, the correct way is actually how I had written it.. until the moment right before I posted it and re-read the original code! Why does the short length period code come before the price code in the PRT version? I mean are we not taking the std of price movements?
Also it should also give negative values and look like the Think or Swim (white) image’s indicator scale? (Note my unused green zero line – in my PRT black image).
Why does the short length period code come before the price code in the PRT version? I mean are we not taking the std of price movements?
?! Why are you asking this question. This is just how the syntax of any instruction is made: keyword[period](appliedprice)
Because you changed the variables names, the code is all scrambled, anyway I took the time to recoded it from scratch: (now give negative values)
//#Period Inputs
longLength = 252
shortLength = 10
shortLengthb = 30
clLog = Log(close / close[1])
//#Calculate Values
HV = std[shortLength](clLog) * Sqrt(shortLength * longLength / (shortLength - 1))
HV2 = std[shortLengthb](clLog) * Sqrt(shortLengthb * longLength/ (shortLengthb - 1))
//Plot
diff = HV-HV2
return diff,0
BardParticipant
Master
Because the PRT syntax is illogical in it’s order!
Right, using “price” and not another expression to describe the log of closing prices… Thanks Nicolas.