There was a mistake in the code, i was trying to work with old levels to compute the new higher/lower Close.. 🙄
Anyway, you can download the modified version in the library.
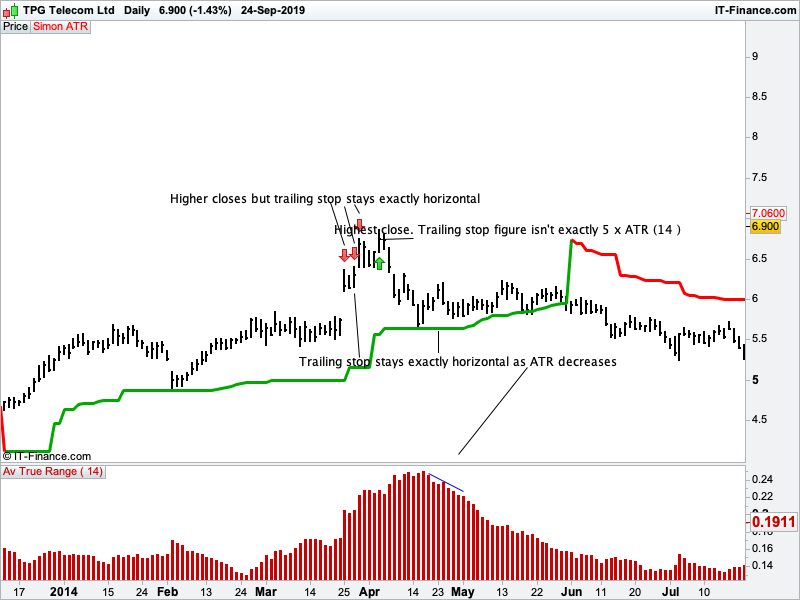
Hi Nicolas, thanks for the fix. I’ve attached a Daily chart of TPM on the ASX just to highlight some little issues. I set the trailing stop to 5 x ATR(14).
Kind Regards Simon
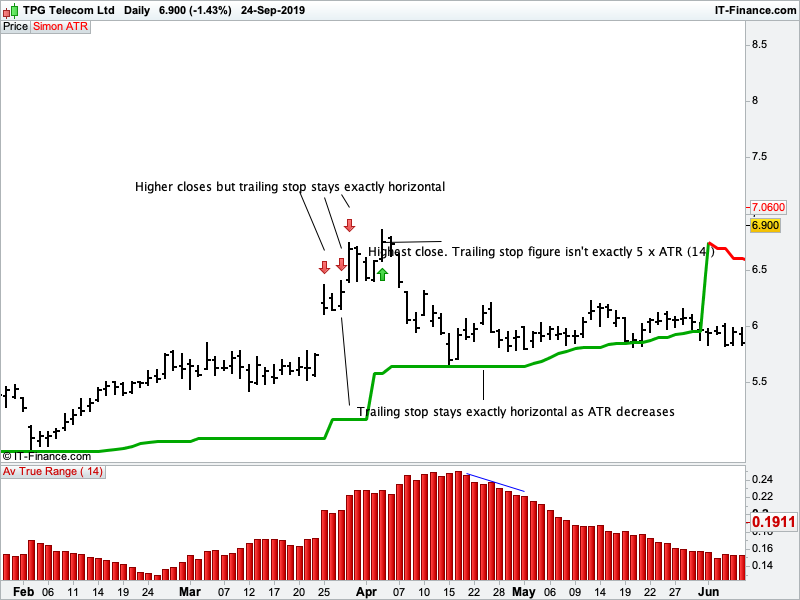
Edit. I took another screenshot of the chart to see if it displayed better
The trailing stop stay horizontal because the new calculated value is not superior to the previous one. If the ATR decrease, what value do you consider to add to the current trailing stop line to make it go up in this case?
All the following is based on a long position example.
The current trailing stop line should just hang 2X ATR(14) from the highest close.
For a new higher close, the trailing stop immediately moves up to be 2x ATR(14) under the new higher closing price.
Once a new bar closes lower , the 2x ATR(14) value of that bar is now deducted from the previous highest close.
If the current bars 2xATR(14) deducted from the highest close means the trailing stop would now hang further away, it stays horizontal.
If the current bars 2x ATR(14) deducted from the highest close means the trailing stop would now be closer to current price, it steps up.
It now steps up to hang down 2xATR(14) from that prior highest close.
Hope that makes sense.
Basically it would be a very responsive trailing stop that sometimes moves every single bar if volatility is decreasing but we are not getting new higher closes.
The work you’ve done so far is great. The indicator is getting extremely close to perfect.
Kind Regards Simon
f the current bars 2x ATR(14) deducted from the highest close means the trailing stop would now be closer to current price, it steps up.
Yes, that’s how it works now, but how it would step up if it can only move up if the ATR is decreasing? The trailing stop line substract ATR*multiplier to the highest close. So if the ATR is decreasing, it can’t go higher than the current trailing stop level.
In a sequence of say 7 bars the trailing stop (ts) should be doing this
a) close = 1 and ATR x multiplier= .10 TS=.90
b) close =1.10 and ATR x multiplier =.10 TS =1
c) close = 1.05 and ATR x multiplier =.10 TS =1 lower close but ts = highest close minus current bars ATR x multiplier
d) close=1.07 and ATR x multiplier =.08 TS= 1.02
e) close=1.04 and ATR x multiplier =.09 **TS=1.01 Trailing stop can’t move away from price so it stays at 1.02
f) close=1.04 and ATR x multiplier =.07 TS=1.03
g) close =1.16 and ATR x multiplier =.10 TS =1.06 We now have a new higher close that we are deducting our ATR x multiplier from
So basically we are just calculating volatlity every bar and deducting it from the highest close. Then hanging down a trailing stop ( from that highest close) that only moves closer or stays horizontal every bar until we have a new higher close OR price closes below the trailing stop. Then it will flip over to be a trailing stop for a short position.
Between points c) and d), how do you get the 0.02 value please? Is it the difference of the decreasing ATR x multiplier between 2 last periods?
Bar C has closed at $1.05 The ATR x multiplier for bar C is .10 ( for example the 14 period ATR was .05 and the multiplier was 2) The highest closing bar so far has been Bar B Bar B closed at $1.10 $1.10 minus .10 which is $1.00 So trailing stop moves to $1.00 and sits directly below Bar C
Bar D closes at $1.07 The ATR x multiplier for bar D is .08 The highest closing bar so far has been bar B Bar B closed at $1.10 $1.10 minus .08 is $1.02 So trailing stop moves to $1.02 and sits directly below Bar D
Try this version:
//PRC_Another ATR trailing stop | indicator
//24.09.2019
//Nicolas @ www.prorealcode.com
//Sharing ProRealTime knowledge

// --- settings
p=14 //ATR period
mult=2 //multiplier
mode=1 //trailing stop mode (0=straight line
// --- end of settings

atr = AverageTrueRange[p](close) * mult

once trend=1

if trend=1 then
hh=max(hh,close)
ll=hh
//if atr<atr[1] then
hhlevel=hh-atr
if hhlevel>ts then
ts=hhlevel
endif
//endif
r=0
g=168
else
ll=min(ll,close)
hh=ll
//if atr<atr[1] then
lllevel=ll+atr
if lllevel<ts then
ts=lllevel
endif
//endif
r=255
g=0
endif


if close crosses over ts then
trend=1
if mode>0 then
ts=ll
endif
elsif close crosses under ts then
trend=-1
if mode>0 then
ts=hh
endif
endif


return ts coloured(r,g,200) style(line,3)
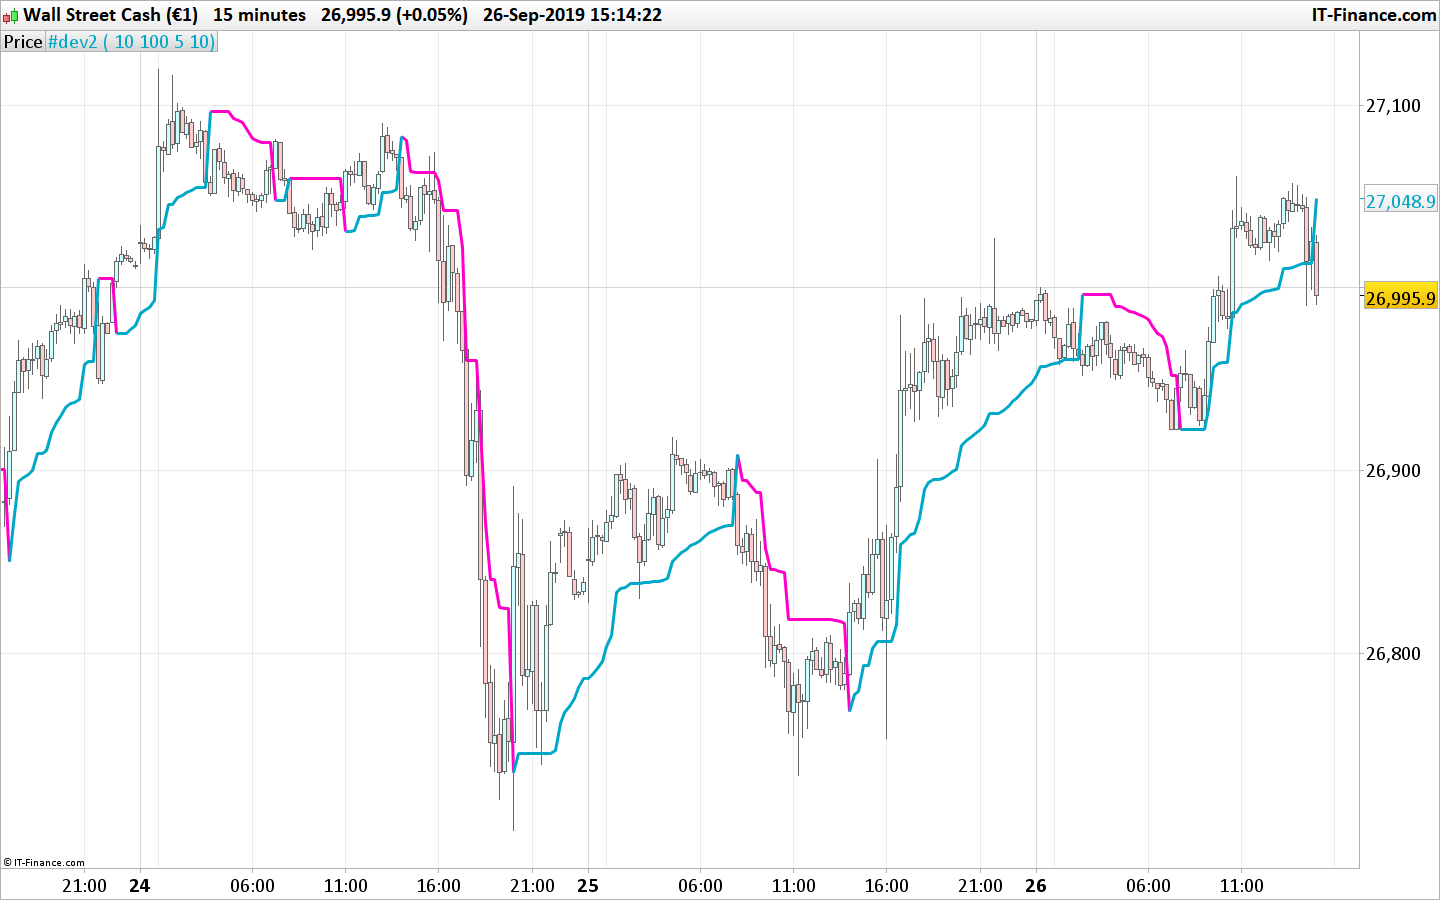
Seems more responsive..
Thanks for your work, looks good so far.
Regards Simon
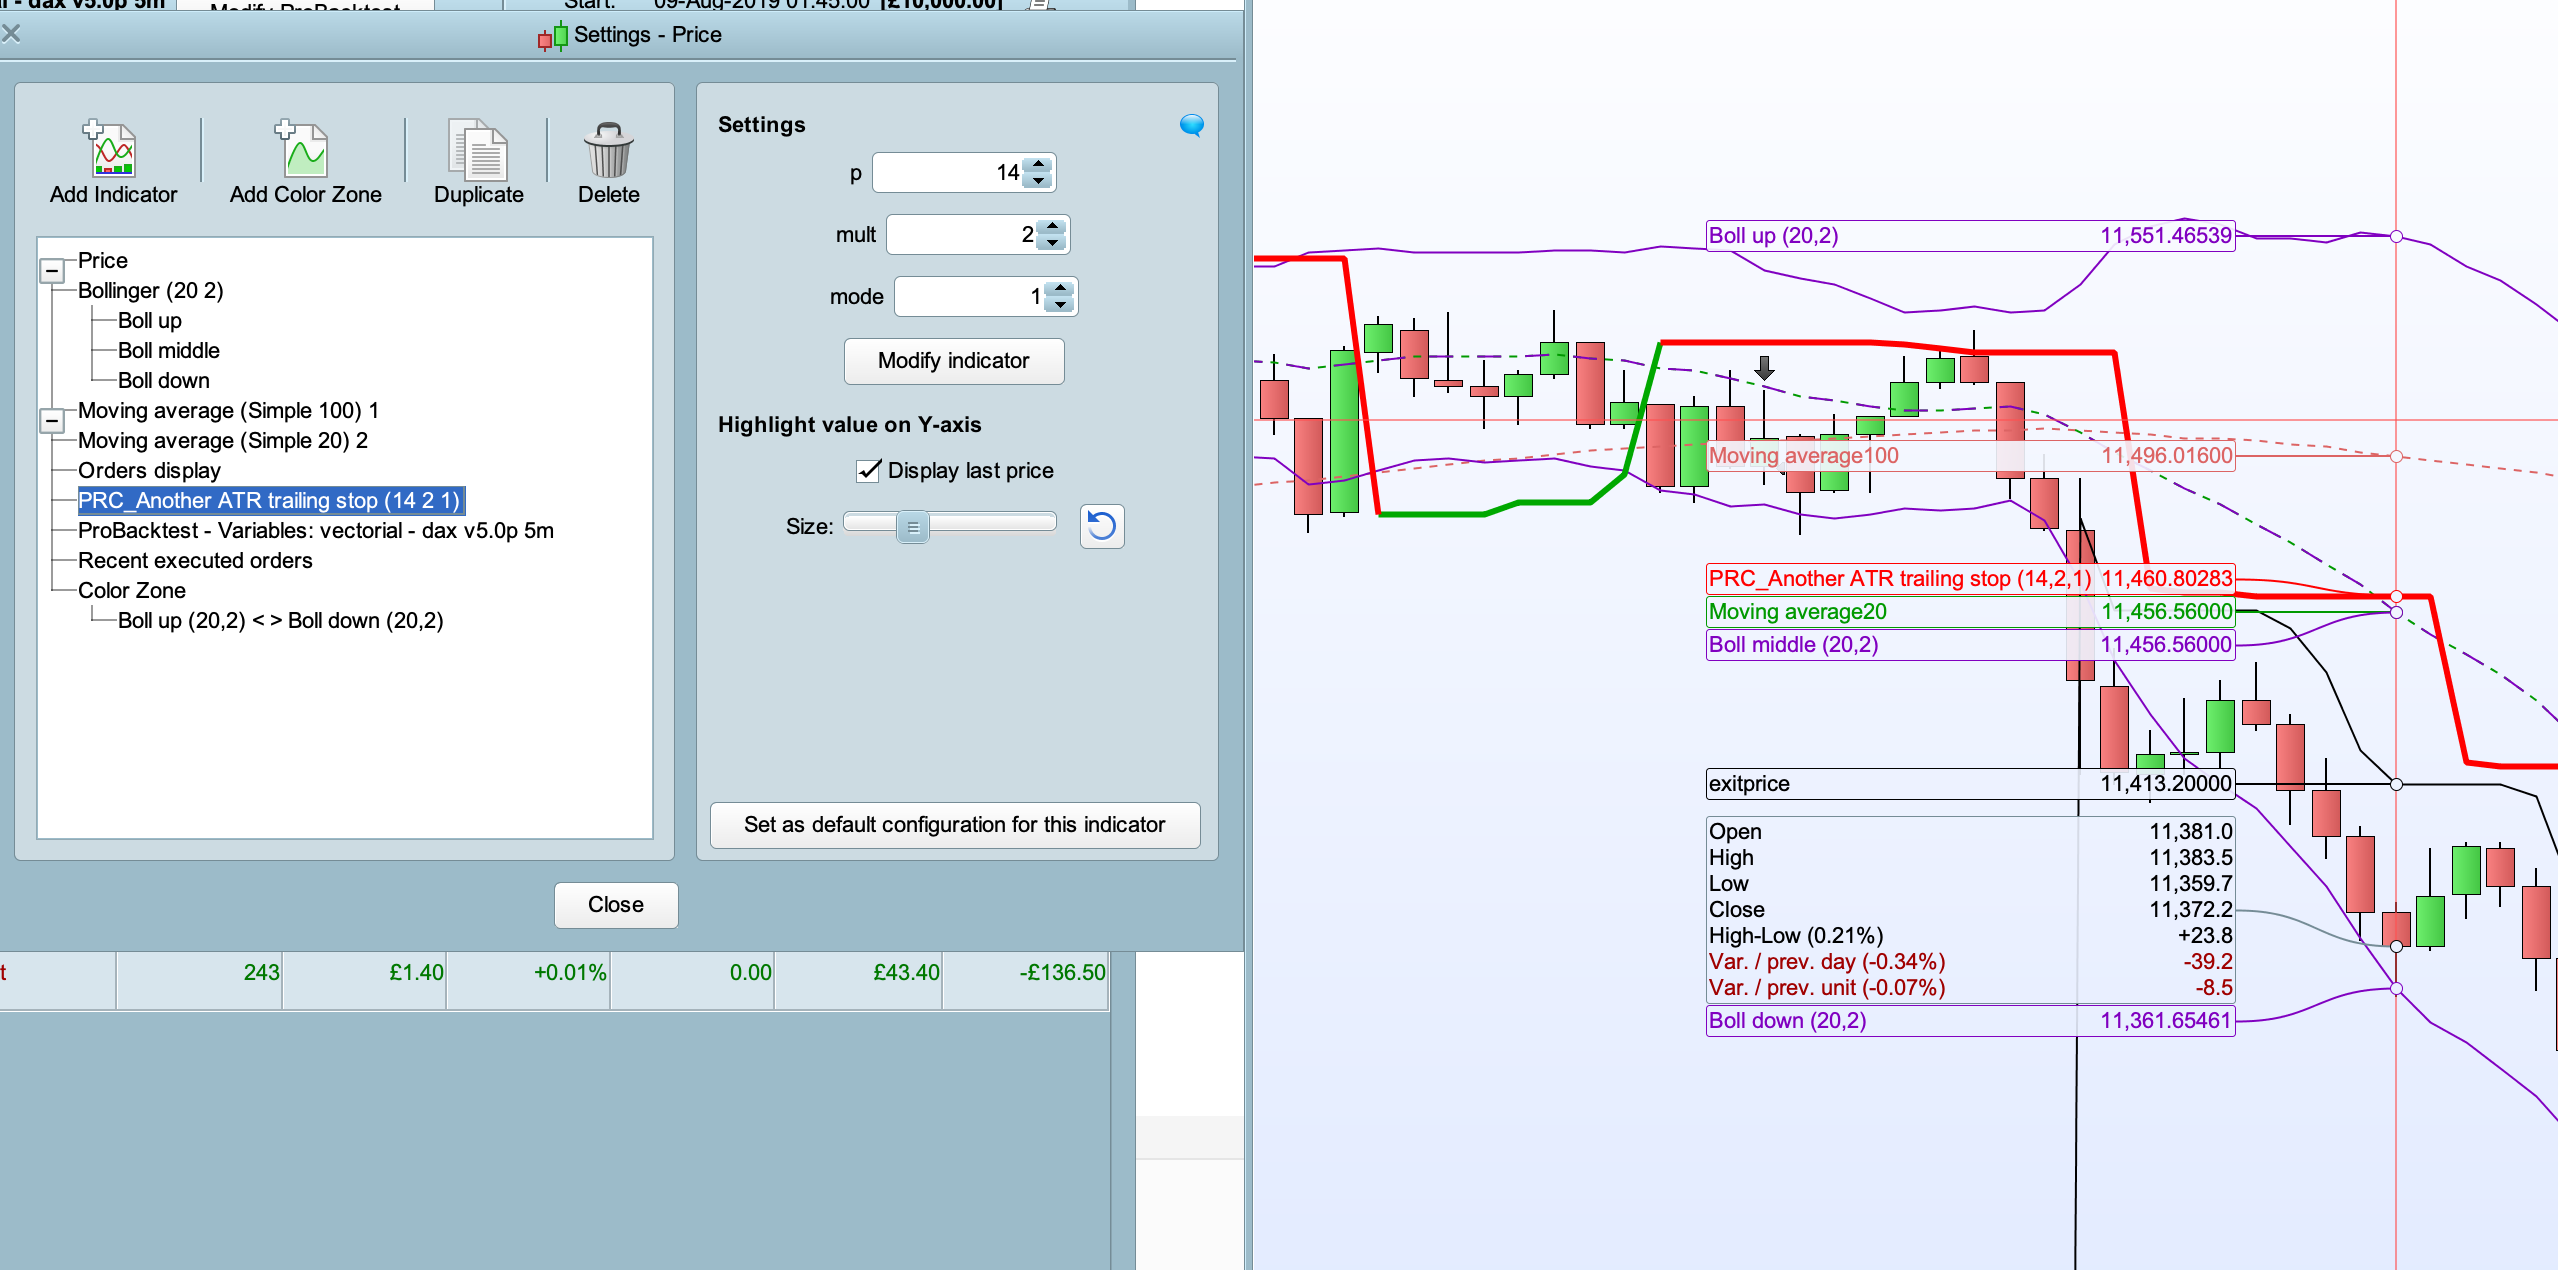
I’ve added this indicator to my price chart – however, adjusting the variables (ATR period, multiplier or mode) has no visible effect.
Am I doing something wrong?
Because the variables at lines 7,8,9 are not commented, you can delete them or add // before each of them.
Many thanks – I keep making this mistake!!!!