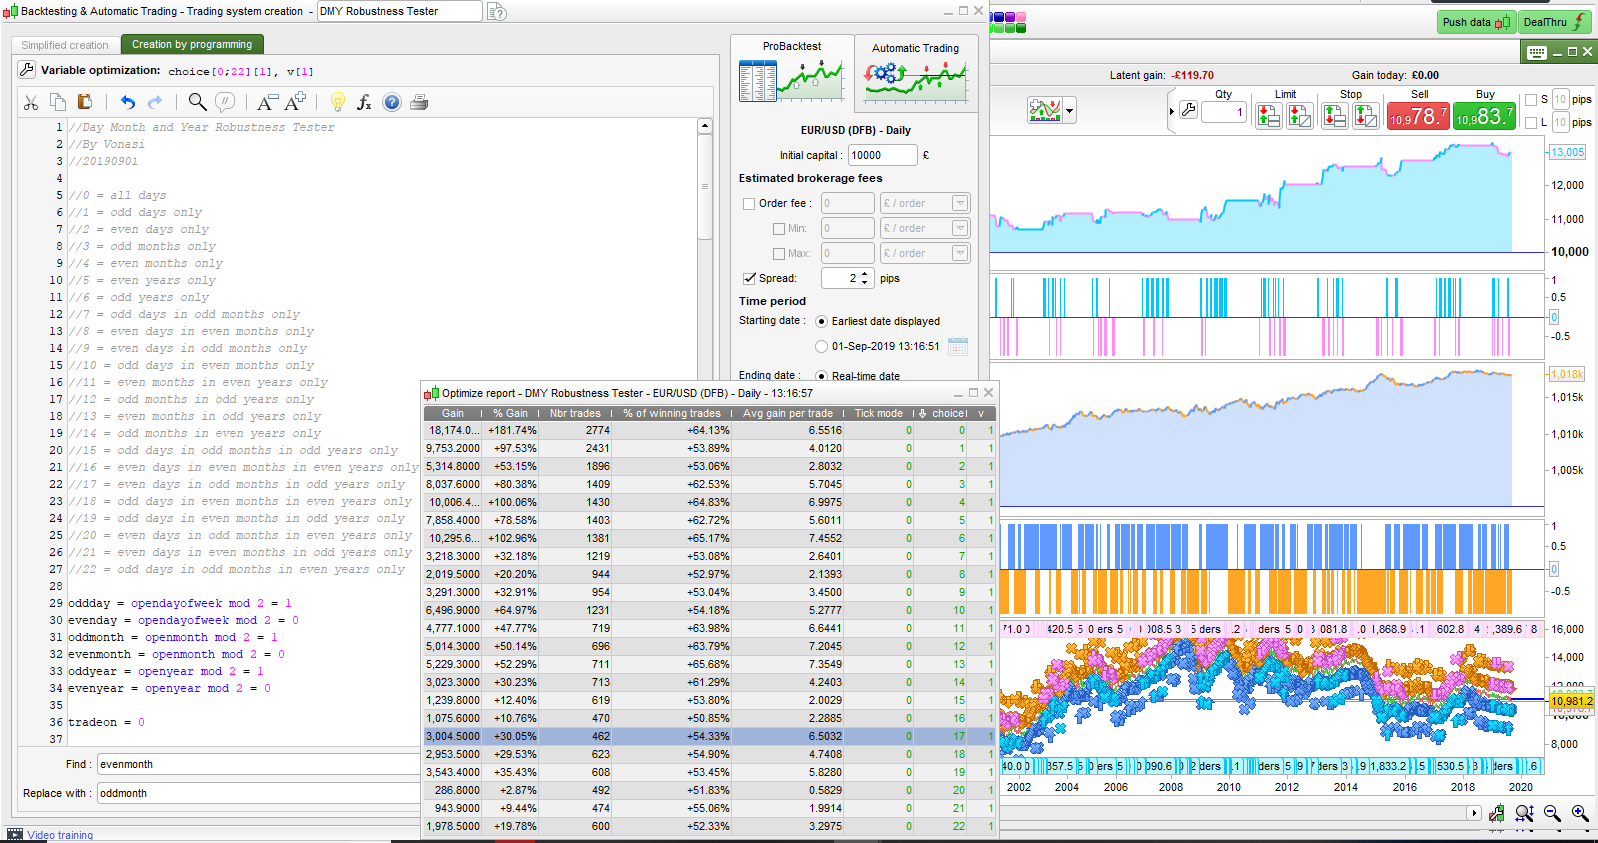
Following on from a discussion elsewhere regarding walk forward testing I had the idea to create a bit of code that you can add to any strategy and see how it would have performed if you had traded on only odd days or only on even days, or odd or even months or odd and even years or any combination of the three. By comparing the output of all 23 tests we can get an idea of how consistently a strategy makes profit. The gain figure in the optimisation results should be ignored as the number of trades for each test will be very different. The average gain per trade, win rate and equity curve for each test can tell us a lot about the strategies robustness though.
You just add the code to the start of your strategy code and then insert the extra condition ‘and tradeon’ in the conditions whenever you send buy or sellshort orders to the market. Then just optimise with a variable ‘choice’ with values 0 to 22 step 1. Then just click on each result in the optimisation report to see the equity curve for each test.
Here is the code to add to the start of your strategy in case it is of use to anyone:
//Day Month and Year Robustness Tester
//By Vonasi
//20190901

//0 = all days
//1 = odd days only
//2 = even days only
//3 = odd months only
//4 = even months only
//5 = even years only
//6 = odd years only
//7 = odd days in odd months only
//8 = even days in even months only
//9 = even days in odd months only
//10 = odd days in even months only
//11 = even months in even years only
//12 = odd months in odd years only
//13 = even months in odd years only
//14 = odd months in even years only
//15 = odd days in odd months in odd years only
//16 = even days in even months in even years only
//17 = even days in odd months in odd years only
//18 = odd days in even months in even years only
//19 = odd days in even months in odd years only
//20 = even days in odd months in even years only
//21 = even days in even months in odd years only
//22 = odd days in odd months in even years only

oddday = opendayofweek mod 2 = 1
evenday = opendayofweek mod 2 = 0
oddmonth = openmonth mod 2 = 1
evenmonth = openmonth mod 2 = 0
oddyear = openyear mod 2 = 1
evenyear = openyear mod 2 = 0

tradeon = 0

if choice = 0 then
tradeon = 1
endif

//odd days only
if choice = 1 and oddday then
tradeon = 1
endif

//even days only
if choice = 2 and evenday then
tradeon = 1
endif

//odd months only
if choice = 3 and oddmonth then
tradeon = 1
endif

//even months only
if choice = 4 and evenmonth then
tradeon = 1
endif

//even years only
if choice = 5 and evenyear then
tradeon = 1
endif

//odd years only
if choice = 6 and oddyear then
tradeon = 1
endif

//odd days in odd months only
if choice = 7 and oddday and oddmonth then
tradeon = 1
endif

//even days in even months only
if choice = 8 and evenday and evenmonth then
tradeon = 1
endif

//even days in odd months only
if choice = 9 and evenday and oddmonth then
tradeon = 1
endif

//odd days in even months only
if choice = 10 and oddday and evenmonth then
tradeon = 1
endif

//even months in even years only
if choice = 11 and evenmonth and evenyear then
tradeon = 1
endif

//odd months in odd years only
if choice = 12 and oddmonth and oddyear then
tradeon = 1
endif

//even months in odd years only
if choice = 13 and evenmonth and oddyear then
tradeon = 1
endif

//odd months in even years only
if choice = 14 and oddmonth and evenyear then
tradeon = 1
endif

//odd days in odd months in odd years only
if choice = 15 and oddday and oddmonth and oddyear then
tradeon = 1
endif

//even days in even months in even years only
if choice = 16 and evenday and evenmonth and evenyear then
tradeon = 1
endif

//even days in odd months in odd years only
if choice = 17 and evenday and oddmonth and oddyear then
tradeon = 1
endif

//odd days in even months in even years only
if choice = 18 and oddday and evenmonth and evenyear then
tradeon = 1
endif

//odd days in even months in odd years only
if choice = 19 and oddday and evenmonth and oddyear then
tradeon = 1
endif

//even days in odd months in even years only
if choice = 20 and evenday and oddmonth and evenyear then
tradeon = 1
endif

//even days in even months in odd years only
if choice = 21 and evenday and evenmonth and oddyear then
tradeon = 1
endif

//odd days in odd months in even years only
if choice = 22 and oddday and oddmonth and evenyear then
tradeon = 1
endif
Then alter your strategy code to use the TRADEON variable so that trades are only opened if the day, month and year meet the test criteria.
if (your long entry conditions) and tradeon then
buy 1 contract at market
endif


if (your short entry conditions) and tradeon then
sellshort 1 contract at market
endif
I added some extra tests based on the day of the week and the month of the year. Only trade on Mondays and only trade in January etc. 41 tests now!
//Day Month and Year Robustness Tester
//By Vonasi
//20190901

//0 = all days
//1 = odd days only
//2 = even days only
//3 = odd months only
//4 = even months only
//5 = even years only
//6 = odd years only
//7 = odd days in odd months only
//8 = even days in even months only
//9 = even days in odd months only
//10 = odd days in even months only
//11 = even months in even years only
//12 = odd months in odd years only
//13 = even months in odd years only
//14 = odd months in even years only
//15 = odd days in odd months in odd years only
//16 = even days in even months in even years only
//17 = even days in odd months in odd years only
//18 = odd days in even months in even years only
//19 = odd days in even months in odd years only
//20 = even days in odd months in even years only
//21 = even days in even months in odd years only
//22 = odd days in odd months in even years only
//23 = day of week = 0
//24 = day of week = 1
//25 = day of week = 2
//26 = day of week = 3
//27 = day of week = 4
//28 = day of week = 5
//29 = day of week = 6
//30 = month = 1
//31 = month = 2
//32 = month = 3
//33 = month = 4
//34 = month = 5
//35 = month = 6
//36 = month = 7
//37 = month = 8
//38 = month = 9
//39 = month = 10
//40 = month = 11
//41 = month = 12

oddday = opendayofweek mod 2 = 1
evenday = opendayofweek mod 2 = 0
oddmonth = openmonth mod 2 = 1
evenmonth = openmonth mod 2 = 0
oddyear = openyear mod 2 = 1
evenyear = openyear mod 2 = 0

tradeon = 0

if choice = 0 then
tradeon = 1
endif

//odd days only
if choice = 1 and oddday then
tradeon = 1
endif

//even days only
if choice = 2 and evenday then
tradeon = 1
endif

//odd months only
if choice = 3 and oddmonth  then
tradeon = 1
endif

//even months only
if choice = 4 and evenmonth  then
tradeon = 1
endif

//even years only
if choice = 5 and evenyear then
tradeon = 1
endif

//odd years only
if choice = 6 and oddyear then
tradeon = 1
endif

//odd days in odd months only
if choice = 7 and oddday and oddmonth then
tradeon = 1
endif

//even days in even months only
if choice = 8 and evenday and evenmonth then
tradeon = 1
endif

//even days in odd months only
if choice = 9 and evenday and oddmonth then
tradeon = 1
endif

//odd days in even months only
if choice = 10 and oddday and evenmonth then
tradeon = 1
endif

//even months in even years only
if choice = 11 and evenmonth and evenyear then
tradeon = 1
endif

//odd months in odd years only
if choice = 12 and oddmonth and oddyear then
tradeon = 1
endif

//even months in odd years only
if choice = 13 and evenmonth and oddyear then
tradeon = 1
endif

//odd months in even years only
if choice = 14 and oddmonth and evenyear then
tradeon = 1
endif

//odd days in odd months in odd years only
if choice = 15 and oddday and oddmonth and oddyear then
tradeon = 1
endif

//even days in even months in even years only
if choice = 16 and evenday and evenmonth and evenyear then
tradeon = 1
endif

//even days in odd months in odd years only
if choice = 17 and evenday and oddmonth and oddyear then
tradeon = 1
endif

//odd days in even months in even years only
if choice = 18 and oddday and evenmonth and evenyear then
tradeon = 1
endif

//odd days in even months in odd years only
if choice = 19 and oddday and evenmonth and oddyear then
tradeon = 1
endif

//even days in odd months in even years only
if choice = 20 and evenday and oddmonth and evenyear then
tradeon = 1
endif

//even days in even months in odd years only
if choice = 21 and evenday and evenmonth and oddyear then
tradeon = 1
endif

//odd days in odd months in even years only
if choice = 22 and oddday and oddmonth and evenyear then
tradeon = 1
endif

//day of week = 0
if choice = 23 and opendayofweek = 0 then
tradeon = 1
endif

//day of week = 1
if choice = 24 and opendayofweek = 1 then
tradeon = 1
endif

//day of week = 2
if choice = 25 and opendayofweek = 2 then
tradeon = 1
endif

//day of week = 3
if choice = 26 and opendayofweek = 3 then
tradeon = 1
endif

//day of week = 4
if choice = 27 and opendayofweek = 4 then
tradeon = 1
endif

//day of week = 5
if choice = 28 and opendayofweek = 5 then
tradeon = 1
endif

//day of week = 6
if choice = 29 and opendayofweek = 6 then
tradeon = 1
endif

//month = 1
if choice = 30 and openmonth = 1 then
tradeon = 1
endif

//month = 2
if choice = 31 and openmonth = 2 then
tradeon = 1
endif

//month = 3
if choice = 32 and openmonth = 3 then
tradeon = 1
endif

//month = 4
if choice = 33 and openmonth = 4 then
tradeon = 1
endif

//month = 5
if choice = 34 and openmonth = 5 then
tradeon = 1
endif

//month = 6
if choice = 35 and openmonth = 6 then
tradeon = 1
endif

//month = 7
if choice = 36 and openmonth = 7 then
tradeon = 1
endif

//month = 8
if choice = 37 and openmonth = 8 then
tradeon = 1
endif

//month = 9
if choice = 38 and openmonth = 9 then
tradeon = 1
endif

//month = 10
if choice = 39 and openmonth = 10 then
tradeon = 1
endif

//month = 11
if choice = 40 and openmonth = 11 then
tradeon = 1
endif

//month = 12
if choice = 41 and openmonth = 12 then
tradeon = 1
endif
I felt that using days and weeks and months added some possible seasonality to the robustness testing so I created a ‘Robustness Tester – Lite’. This one just runs three tests:
- On all the data
- Only open trades on odd barindex numbers.
- Only open trades on even barindex numbers.
It is obviously much faster to run and removes all possibility of influence from seasonality.
As with the other tester add it to the top of your strategy (but under any DEFPARAM instructions) and then add TRADEON to all your first entry conditions.
//Robustness Tester - Lite
//By Vonasi
//20190907

//1 = odd barindex
//2 = even barindex

oddbarindex = barindex mod 2 = 1
evenbarindex = barindex mod 2 = 0

tradeon = 0

if choice = 0 then
tradeon = 1
endif

//even barindex
if choice = 1 and oddbarindex then
tradeon = 1
endif

//odd barindex
if choice = 2 and evenbarindex then
tradeon = 1
endif
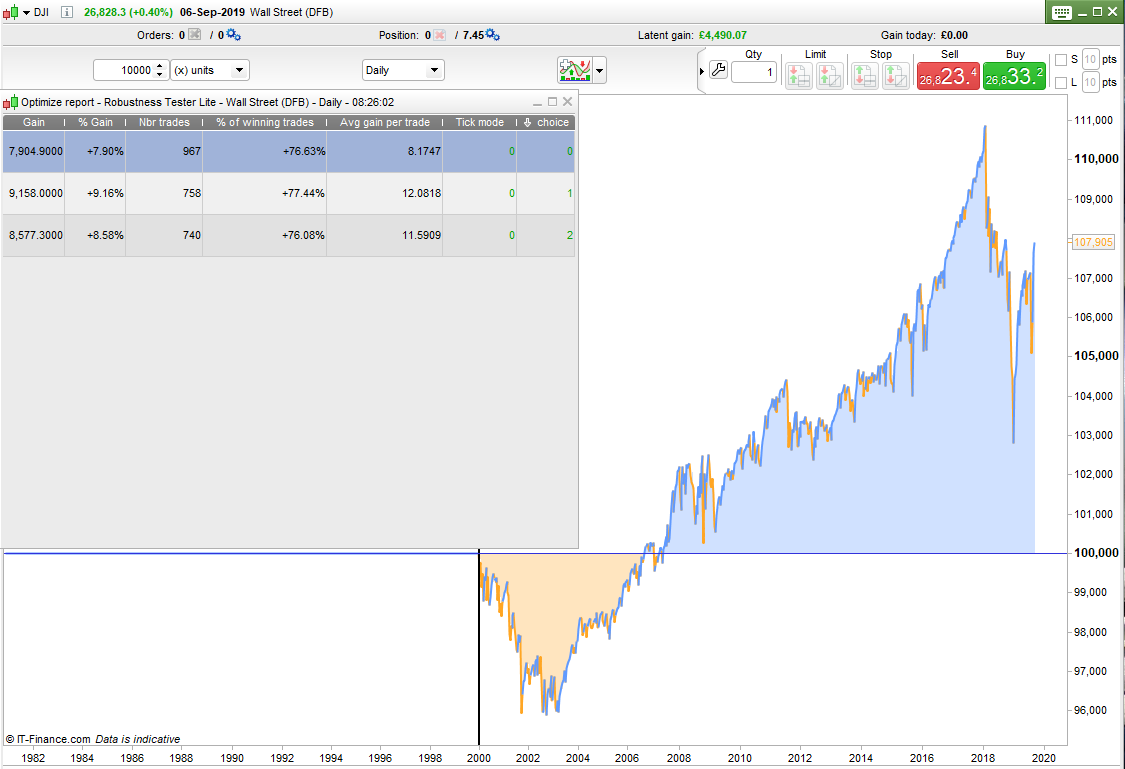
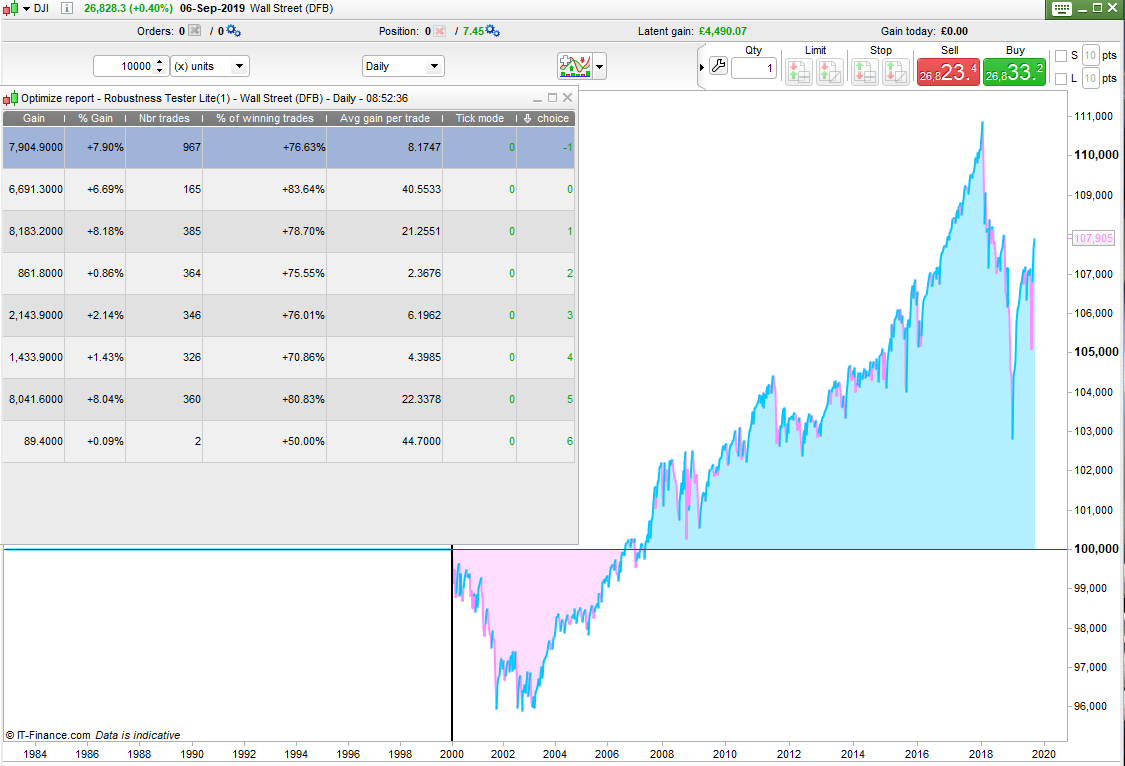
Here is an example of the ‘Robustness Tester – Lite’ on a very simple strategy that just buys dips in the DJI daily since the beginning of 2000 and then sells them if in profit or if a close is greater than the previous high.
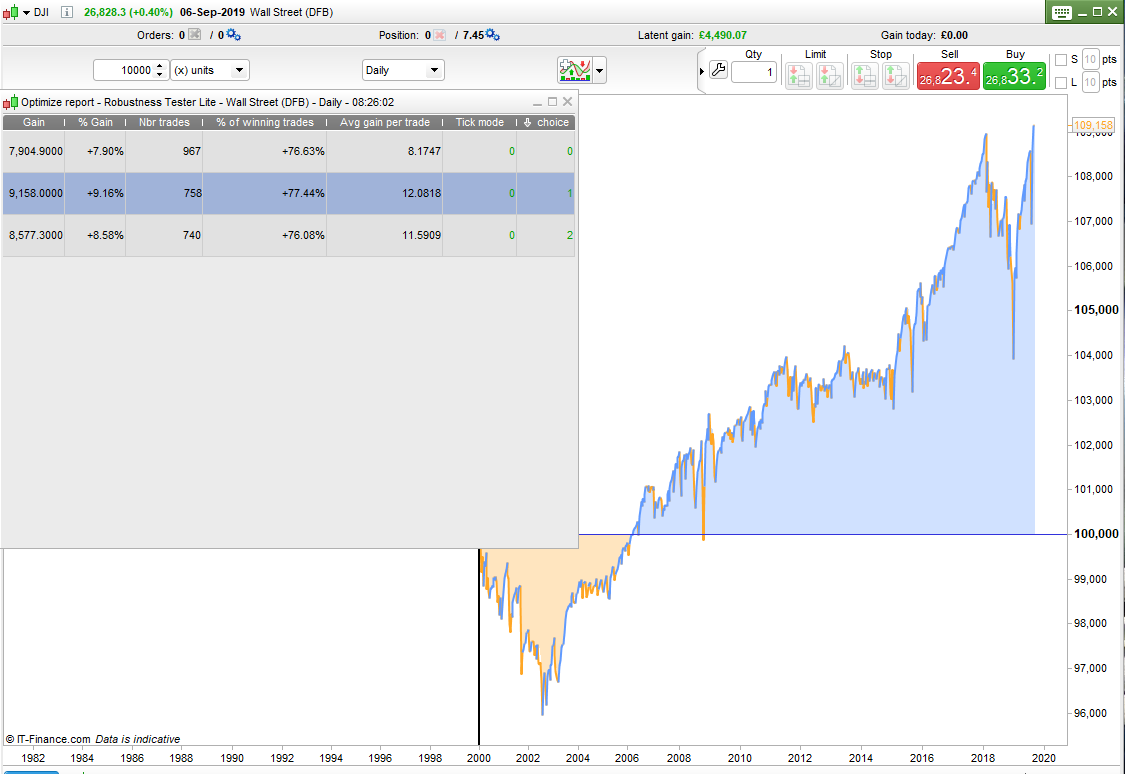
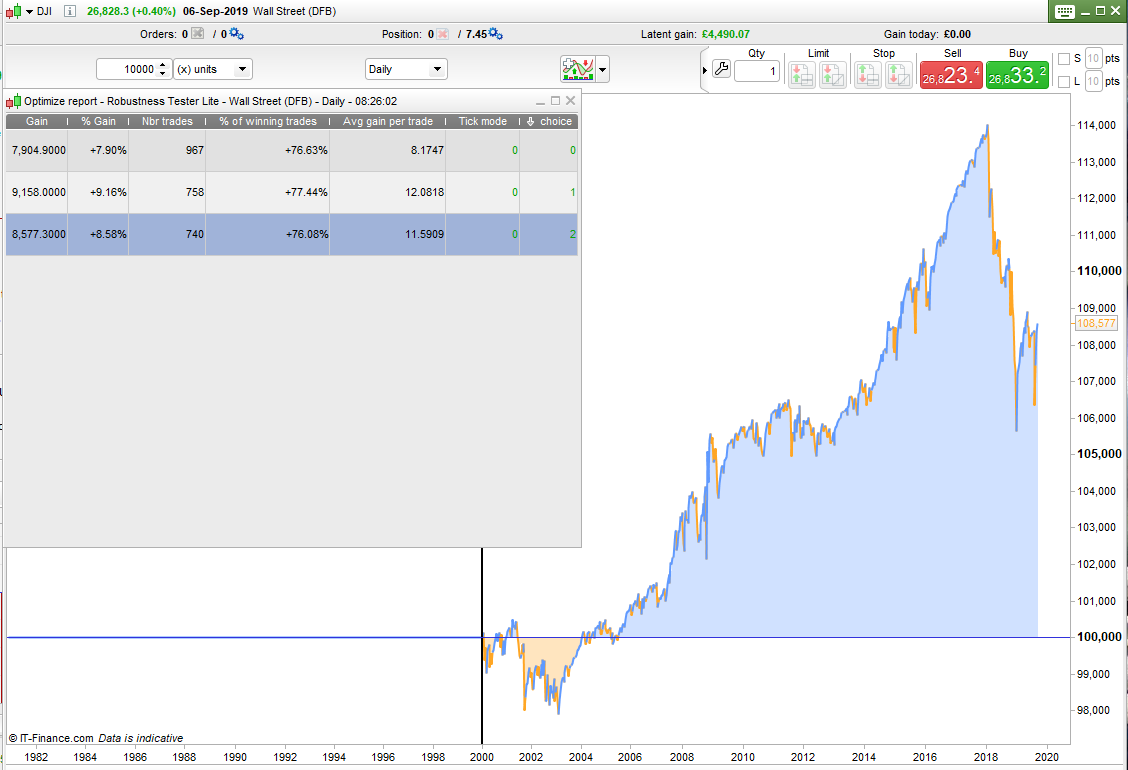
The first image is starting trades on all days, the second on just odd days and the third just even days.
Yes the equity curves are pretty ugly with horrible draw down but when trading on just even or just odd days the win rate was almost identical and the average gain per trade is actually about a third better. So it seems pretty robust and also highlights one very important thing. If we have a strategy that only allows one position to be open at a time and that position can be open for a few bars then we might be missing out on other potential winning trades. Launching two strategies where one only starts trades on even bars and the other only on odd bars would seem a very sensible thing to do to increase trading opportunities and profit and maybe smooth out the equity curve a bit. In fact on a daily strategy having a strategy for each day of the week would be a good idea as long as it is a robust strategy.
So I decided to test the exact same simple strategy on just each of the days of the week to see how it worked out. Not quite so robust but still every day was profitable and the win rates were all good. I have no idea how any trades got opened on a Saturday but two did! Unclean data I’m guessing or was there some strange times in history when the stock markets opened on a Saturday?
Anyway ignoring the Saturdays it is interesting to note that we were able to test the strategy on 1946 trades instead of just the 967 that we could when testing on all the data. Increasing your amount of trade tests by 50% has to be a good thing.
It is also interesting to note that the strategy definitely performed better on Sunday’s, Monday’s and Friday’s and performance dipped off midweek. Perhaps as a start of the week and end of the week only strategy it has some potential but then we start to enter the world of data mining and we don’t want to go there.
It would be great if the platform had some way to show a combined equity curve of all the results or any that we selected.
Note: In the image choice -1 = all and 0 to 6 are Sunday to Saturday.
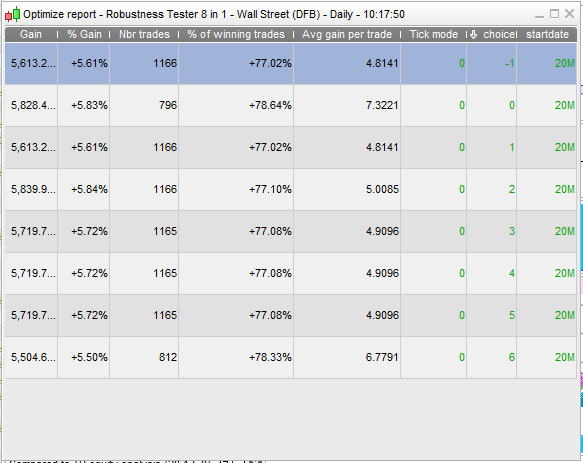
Developing the idea of running several strategies at the same time but just trading on different days of the weeks I thought that if you have a strategy that trades very regularly then just setting one running from different start points would be a good idea. So if it is a Sunday start a strategy and if it is a Monday start another and so on. At some point they may come into synch when they all are off the market at any one time but I adjusted the Robustness Tester to do this anyway to see how it worked out.
You have to set a start date if you are not testing on all of history. Set it to zero if you want to test on all of history. Set ‘choice’ to be whichever day you want the strategy to start running on or if back testing use it as an optimised variable from -1 to 6. As always with these Robustness Testers add TRADEON to your entry conditions in your strategy.
Image attached is results for the same DJI daily strategy as above but just starting on different days.
//Robustness Tester 8 starts in 1
//By Vonasi
//20190907

//-1 = tart any day
//0 = start if day of week = 0
//1 = start if day of week = 1
//2 = start if day of week = 2
//3 = start if day of week = 3
//4 = start if day of week = 4
//5 = start if day of week = 5
//6 = start if day of week = 6

StartDate = 20000101 //0 = all data
Choice = 0

if opendate >= startdate then
if choice = -1 then
tradeon = 1
endif

//day of week = 0
if choice = 0 and opendayofweek = 0 then
tradeon = 1
endif

//day of week = 1
if choice = 1 and opendayofweek = 1 then
tradeon = 1
endif

//day of week = 2
if choice = 2 and opendayofweek = 2 then
tradeon = 1
endif

//day of week = 3
if choice = 3 and opendayofweek = 3 then
tradeon = 1
endif

//day of week = 4
if choice = 4 and opendayofweek = 4 then
tradeon = 1
endif

//day of week = 5
if choice = 5 and opendayofweek = 5 then
tradeon = 1
endif

//day of week = 6
if choice = 6 and opendayofweek = 6 then
tradeon = 1
endif
endif
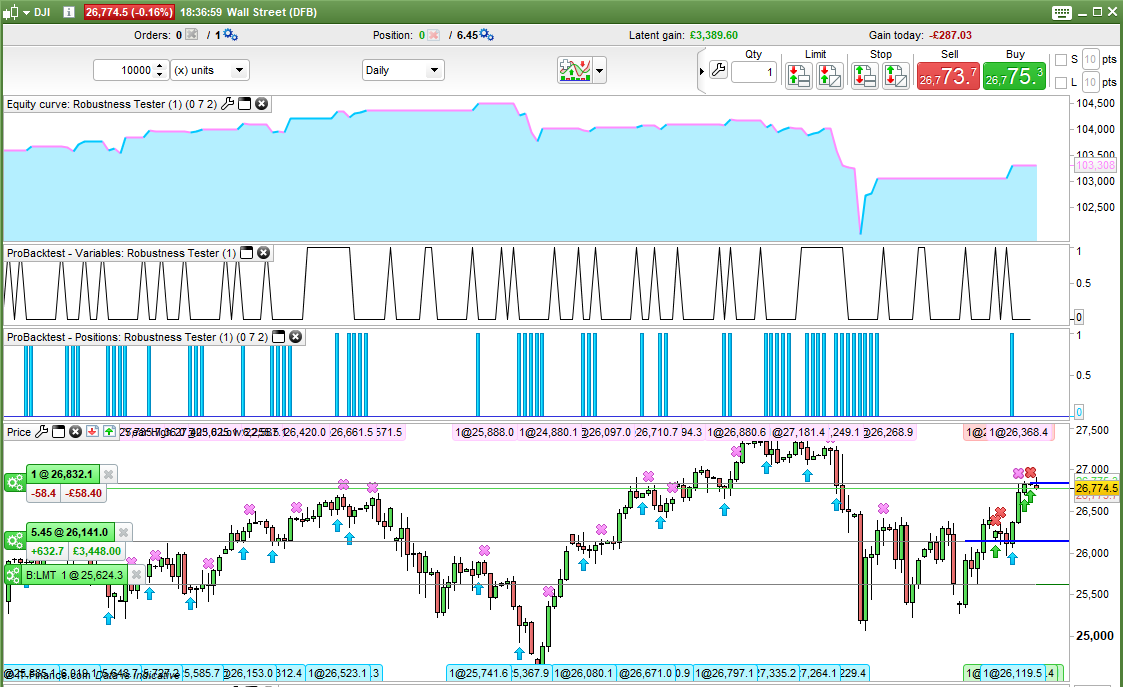
I was still concerned that my ‘Robustness Tester – Daily’ still suffered from being vulnerable to daily seasonality and my ‘Robustness Tester – Lite’ didn’t really run enough tests to give meaningful analysis. I wanted something that could run lots of tests and was almost random. So welcome to the ultimate robustness tester – which I call ‘Robustness Tester – Random’!
It isn’t truly random but it can create many different possible entry patterns so it almost seems like it is. It works by checking the remainder of the barindex number divided by a ‘qty’ number. If the remainder is zero then it allows a trade. It also then compares the remainder to a value j that cycles between 1 and ‘qty’ and if the remainder matches j then it also allows a trade. This cycling is interrupted by a further variable ‘random’ which causes the cycling to pause or skip values which gives us our randomness or if not actual randomness then at least a lot of very different varying combinations of trading patterns.
As with all the other robustness testers add the code to the top of your strategy (but under any DEFPARAMS) and put the condition TRADEON in your entry conditions and then set optimising variables ‘Qty’ from 2 to whatever you want and ‘Random’ from 1 to whatever you want (maximum = maximum qty value).
You can also set a ‘startdate’ to only test from that date. If you set this to zero it tests on all of history.
Another benefit of this tester is that it can be run on weekly chart too as it is barindex based and not day of the week based.
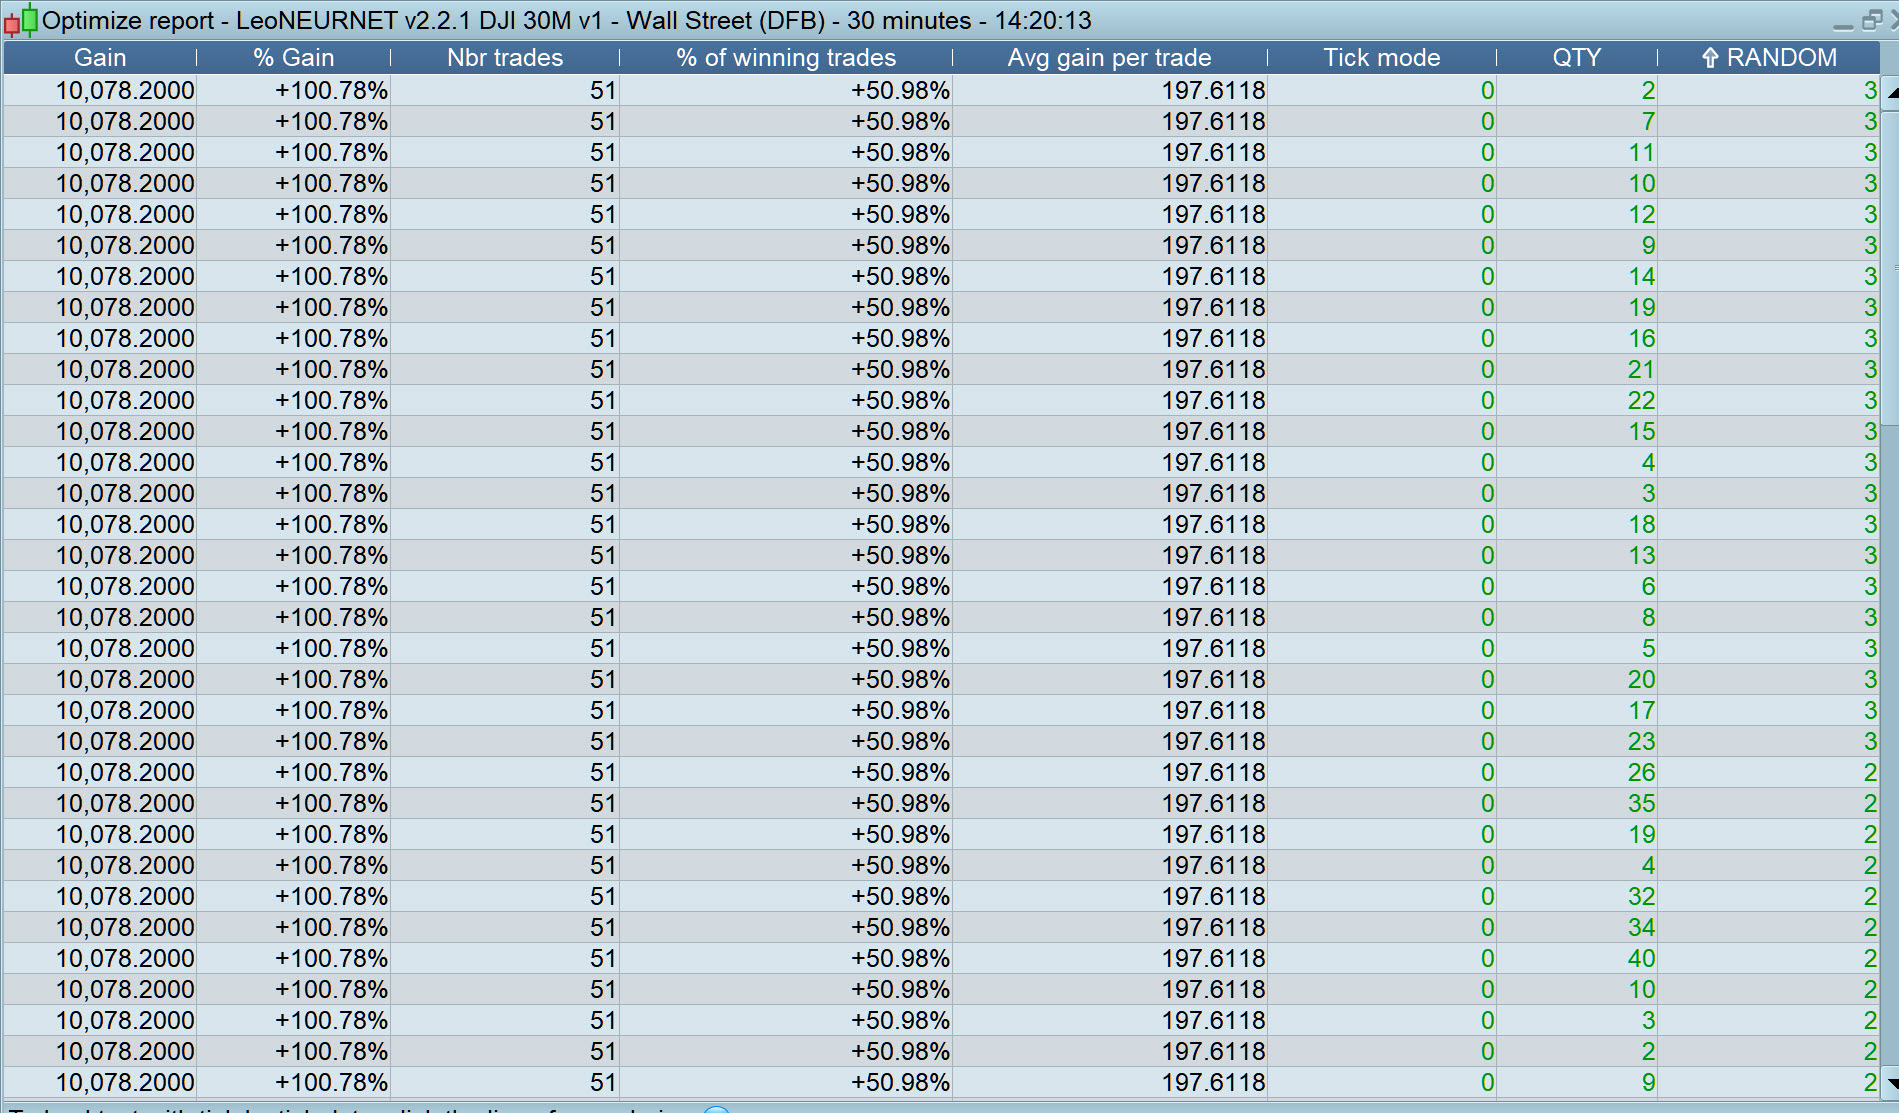
In the image I have graphed TRADEON and you can see the sort of variety of trading pattern created to test with. The second image shows the results for a simple strategy tested using qty = 10 and random = 5. All the win rates are very consistent and all tests were profitable – not all the same but I think that if six identical versions of this strategy were set to run each only allowed to open trades on one day of the week then the combined equity curve should be satisfactory.
In my opinion this version of robustness tester is now a very powerful tool. It is incredible how many strategies that can look great but if you take a random sample of the trades or even just change the start date by one day they can fall apart. This tester now lets us really test that. I think this tester might actually be the most important thing that I have coded so far! It will be fun to try it on some of the strategies posted in the forums….
//Robustness Tester - Random
//By Vonasi
//20190909

//StartDate = 20000101
//Qty = 10
//Random = 3

once j = 0
once flag = 1

if flag = 1 then
j = j + 1
if j > qty then
flag = -1
j = j - 1
endif
endif

if flag = -1 then
j = j - 1
if j = 0 then
j = j + random
flag = 1
endif
endif

tradeon = 0
if opendate >= startdate then
if barindex mod qty = 0 or barindex mod qty = j then
tradeon = 1
endif
endif
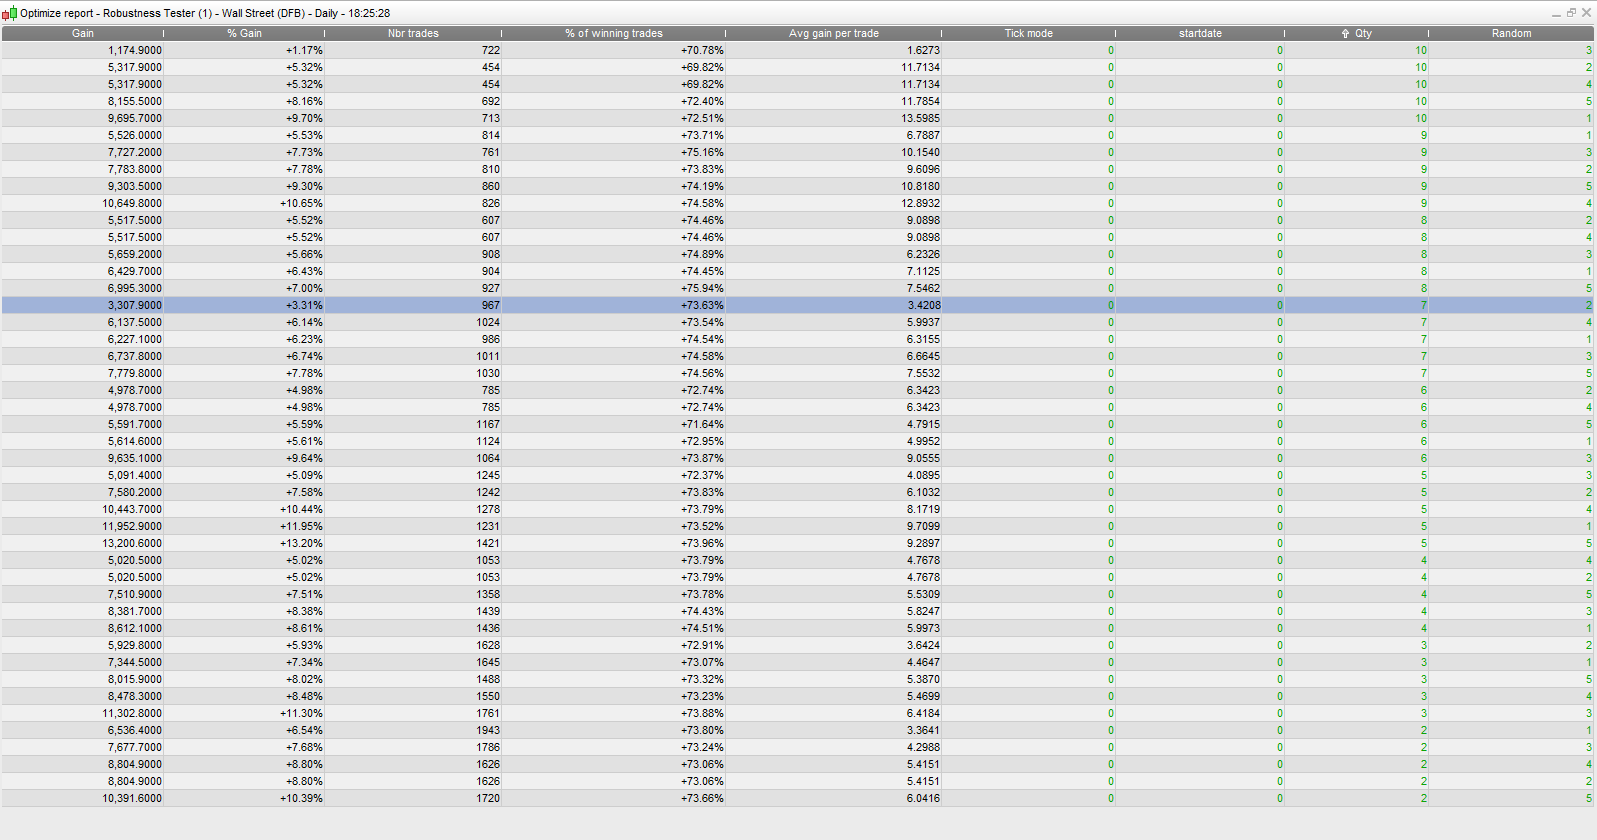
I thought of a good way to analyse all the test results from the various robustness testers that I have created.
- Run a test
- Organise the results in the optimizer window by ‘% of winners’ from low to high.
- Drag the optimiser window results into Excel.
- Create a line graph of the % of winners.
- Re-organise the results in the optimiser window by ‘Avg gain per trade’ from low to high.
- Drag the results again into Excel
- Create a line graph of the ‘Avg gain per trade’
If the lines on the charts you created are completely flat and level with no major spikes then you have a robust strategy. We should expect some inclination and maybe some ripples but we are looking for as flat a line as possible.
It might be a good idea to create an Excel sheet that you can quickly call up and that already has the charts created. You then can just drop your results into two areas on the sheet and get automatic charts. This means that you can also fix the y axis max and min values so as to ensure that when you look at any line you are comparing it like for like with previous lines that you have looked at.
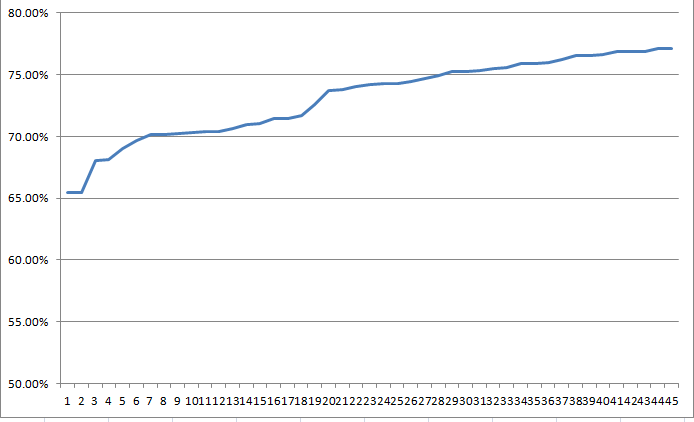
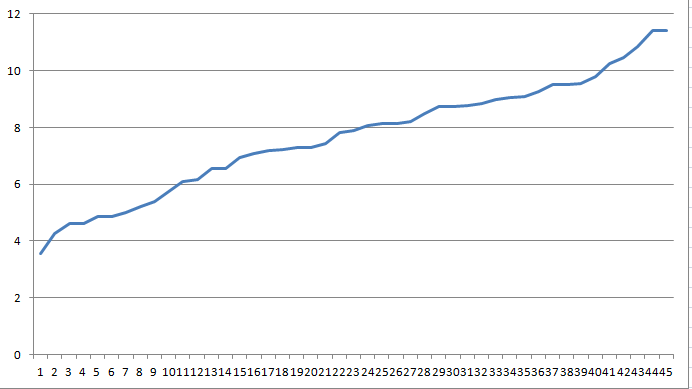
Attached are two Robustness Test Random charts of a strategy that I have been working on. Settings were qty = 10 and random = 5 giving 45 tests. Not too bad – pretty flat lines but the avg gain per trade is slightly steep. Still pretty robust and profitable on all tests.
Hello Vonasi,
I’m not sure to have understood all your robustness code. If the line is flat the strategy is robust. Did you mean that the curve and the values must have a constant and regular evolution?
On the left excel graph the curve is steeper under 65% of winning trade. Does that mean that our strategy will be robust if we choose variables that return more than 65% of winning trades?
It could help us if you can show us a good graphic and a bad one in order for us to eliminate robustless strategies.
We are testing with fixed variables – we test our final strategy with the fixed variable values that we think work best after optimising.
To understand how this tests the robustness you have to consider that when we create an equity curve it has a fixed starting point and we start looking for trades from that starting point. If after 3 bars we find a trade and open a position and our strategy keeps it open for 10 bars and does not allow any new trades to open during that time even if there are opportunities then how do we know what the equity curve would have looked like if we’d started at bar 4 and our first trade had been one of those missed opportunities?
All the robustness test does is randomly choose points to allow trades to be started if our strategy wants to. By running many tests of random trades we can compare each test and if we have a 100% robust strategy then it will have exactly the same win% and exactly the same avg gain per trade in every random test. This is highly unlikely but that is the perfect strategy robustness test result.
So when you organise the avg gain and % win from low to high and plot it in Excel you can see how similar all the test results are at a glance. If the win rate on the left is 0% and on the right 100% and even worse the line is very wobbly between the two then that is a complete fail. However if it is 65% on the left and 70% on the right then that is a pretty good strategy. The same with the average gain. If our average gain is zero on the left and 100 on the right then that is a complete and utter fail. If it is 3 on the left and 5 on the right or even 86 on the left and 90 on the right then that is pretty good and it is a robust strategy.
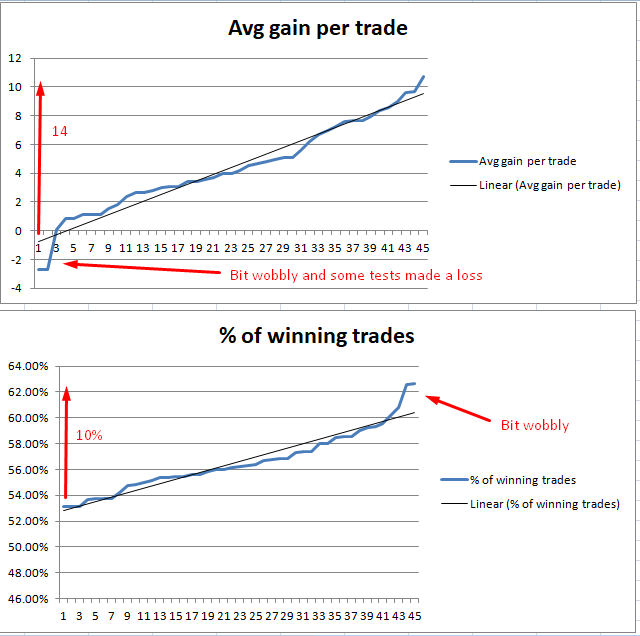
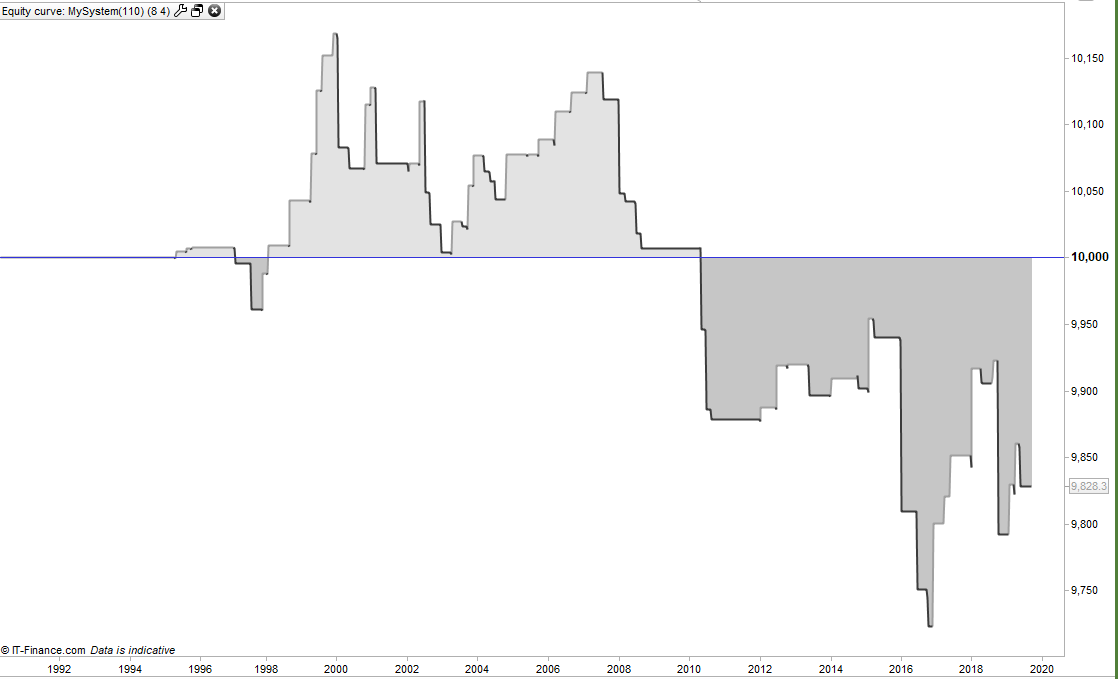
Attached is an image of what I would class as a fail. A massive difference in average gain and in percentage of winners. Plus a bit wobbly and some tests even made a loss.
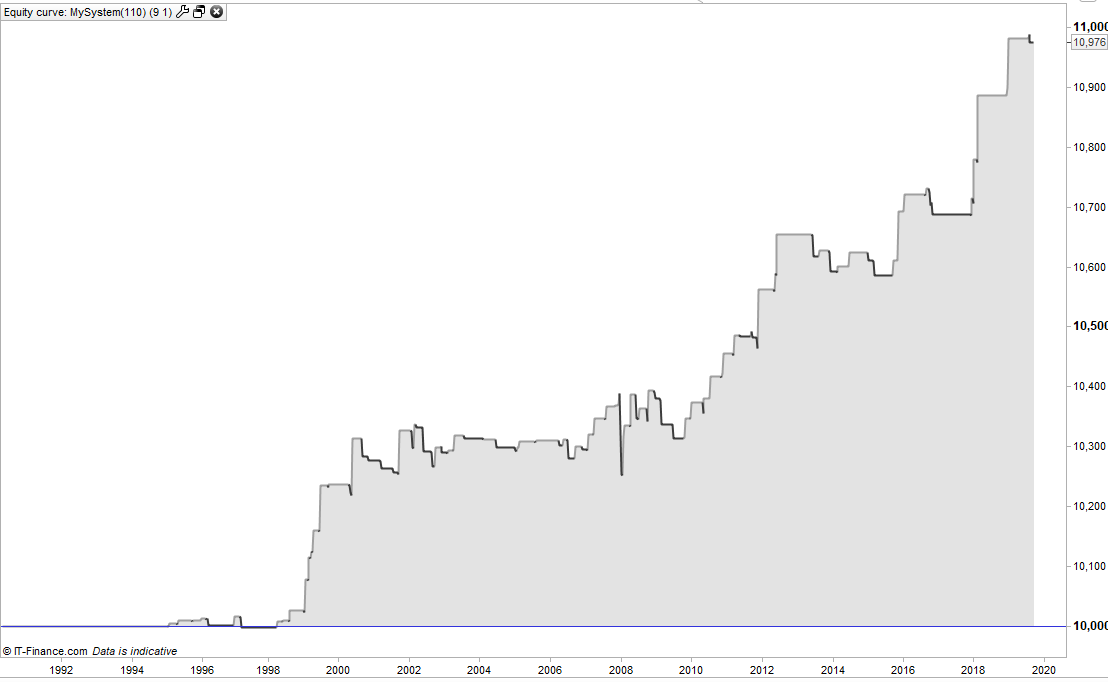
Checking each equity curve is also useful as they can tell you a lot. A good strong strategy would allow you to turn it off and then back on again randomly and still make money. When you look at the equity curves you have to imagine that that is what your results would look like if you randomly traded your strategy and ask yourself if you would be happy with all the equity curves. I’ve attached the best and the worst test result equity curves. Depending upon when you happen to trade you could get either of them or anything in between.
As with all strategy testing we should also keep in mind that we want a lot of trades in our tests and so if we use settings in the tester that mean some tests open hardly any trades then those results don’t really tell us anything so we should keep one eye on trade quantity in the results.
Run a test
Organise the results in the optimizer window by ‘% of winners’ from low to high.
Forgive the daft question, but aren’t you setting up excel with the results from all sets of variable values? Most of which I likely would not consider going forward with in a System.
I scan read sections of this Thread … hence my question may be off the mark a bit?
I was under the impression that – backtested trade results from the final selected set of variable values – would be what we need to be putting under scrutiny of robustness??
For the Robustness Tester Random this is the procedure:
- First of all you create your strategy and then you optimise the life out of it until you have found a set of variables that you think work. You then fix these values in the code or the optimiser.
- You then add the robustness tester to your code and add the condition TRADEON to when positions are opened (not accumulating positions but just the first entry or any reversal entries).
- You then add two variables to your optimiser ‘QTY’ and ‘RANDOM’. QTY should be 2 to whatever and RANDOM 1 to whatever but not more than QTY. The optimiser will tell you how many tests this will run.
- You then back test your strategy and the optimiser results window will show you the results of all the tests.
- Check the trade quantites as if they are low then you should reduce the number of tests by adjusting QTY and RANDOM
- Click on each test to compare the equity curves – all similar is good.
- Click on the avg gain per trade tab in the optimiser window to organise the results in low to high and drag the results into Excel.
- Click on the % of winners tab in the optimiser window to organise the results in low to high and also drag the results into Excel.
- Create two line graphs in Excel of the avg gain per trade (of the first dragged data) and % of winning trades (of the second dragged data).
- Level straight lines with not much change in value from end to end are what you are looking for.
As with all analysis the final decision as to whether you are happy with the results or not is entirely down to you…. and stop scan reading GraHal!
Great! thank you Vonasi … above is just what we needed, an idiots guide / check list … even I can follow this now! 🙂
If every single combo comes back the same result have I done something wrong or is it a superlative System or an oddball System?? 🙂
We enter TRADEON as below … Yes?
If Condition and TRADEON Then
Buy at Market
Endif
EDIT/PS
Schoolboy error … I’d not entered Qty as Qty and RANDOM as RANDOMS in the code! 🙂
That’s the trouble with idiot’s guides … for the guidance of wisemen and the slavish adherence of idiots!!?? 🙂
I redeemed myself just in time!!!!! 🙂
Yes that is how you use TRADEON.
Maybe post the whole code so I can see if there is a mistake? Time frame and market would be useful too.
You are stress testing the robustness tester GraHal!