Hello,
I try to backtest a strategy in a tickchart. Everytime the a bullish candle crosses the bullish sma50 with the opening below the sma 50 and the close above the sma20, or a bearish candle crosses the bearish sma5o with the opening above the sma 50 and the close below the sma20, I want to buy 1 contract with a target from 5 and a stoploss from 2
This is what I have created, but I see in the output of the backtest that something isn’t right. I see profits and losses far above my presets.
Thank you, Marc
// moving averages
m50 = Average[50]

//LONG - crossing bullish candle through bullish sma50 from below.
// The body of the previous candle needs to be below the sma50
c1 = open[1] < m50 and close[1] < m50
c2 = open < m50 and close > m50
// bullish sma50
c3 = m50[1] =< m50

// Long conditions
L = c1 and c2 and c3

//SHORT - crossing bearish candle through bearish sma50 from above.
// The body of the previous candle needs to be above the sma50
c4 = open[1] > m50 and close[1] > m50
c5 = open > m50 and close < m50
//bearish sma50
c6 = m50[1] => m50

// Short conditions
S = c4 and c5 and c6

// Buy Long
IF L THEN
BUY 1 CONTRACTS AT MARKET
ENDIF

// Sell Short
IF S THEN
SELLSHORT 1 CONTRACTS AT MARKET
ENDIF

// Stops en Targets
SET STOP loss 2
SET TARGET PROFIT 5
Please use the ProOrder forum for automated trading related question, and the ‘insert code button’ to add a embed a code in a post.
If you want to use takeprofit and stoploss values in points, you should use the pprofit and ploss instruction instead:
// Stops en Targets
SET STOP ploss 2 //2 points/pips
SET TARGET pPROFIT 5 //5 points/pips
Thanks Nicolas,
I will in the future. I was doubting where to post this, because I had problems with the coding.
I was already looking for a way to embed the code.
Thanks again, Marc
Hi again, I still have strange losses and profits in my backtest list. If 1 point = $50,- then the max of my loss will be constantly $100,- and my profits will be always $250,-
Now I have variable profits and losses.
I want to check how often the strategy as described above reaches the target or the stop.
So I guess there is something else I didn’t do right.
Thanks, Marc
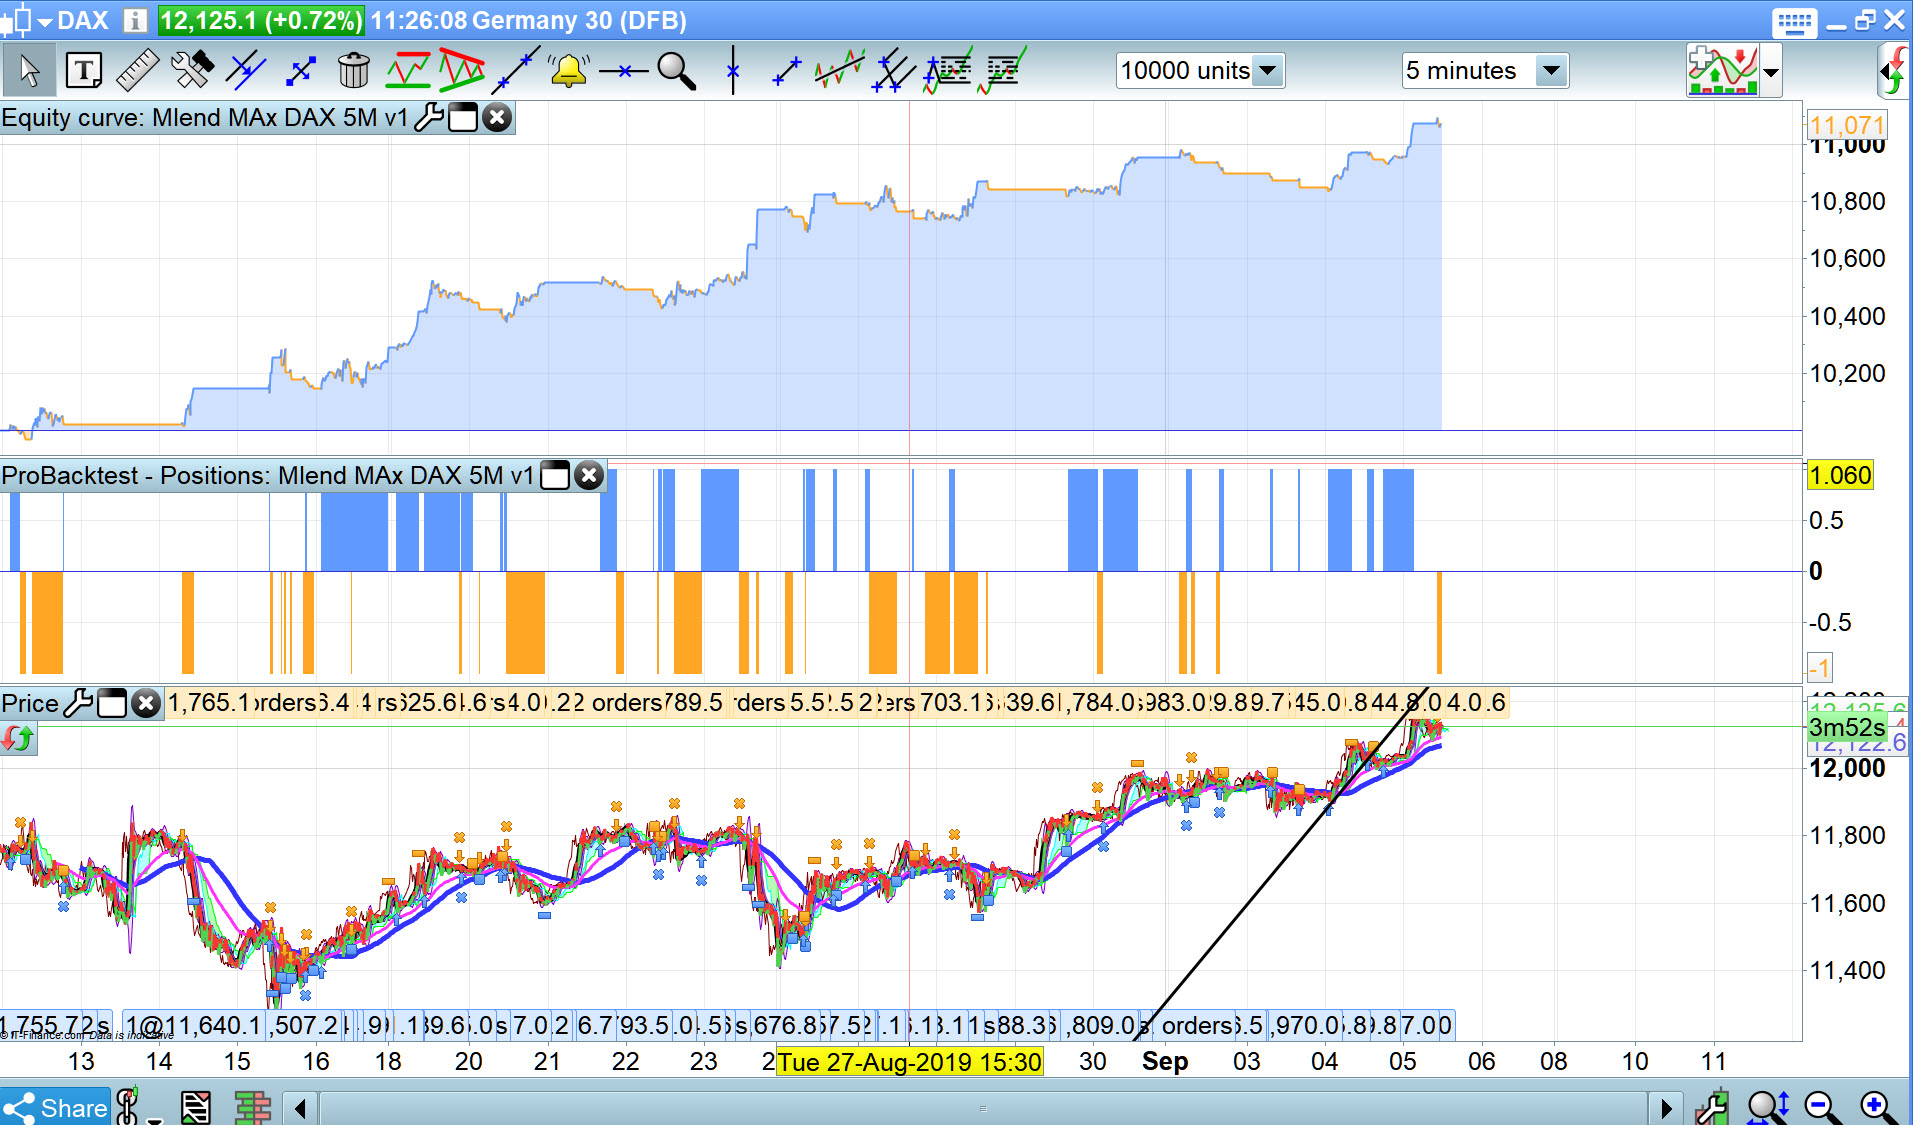
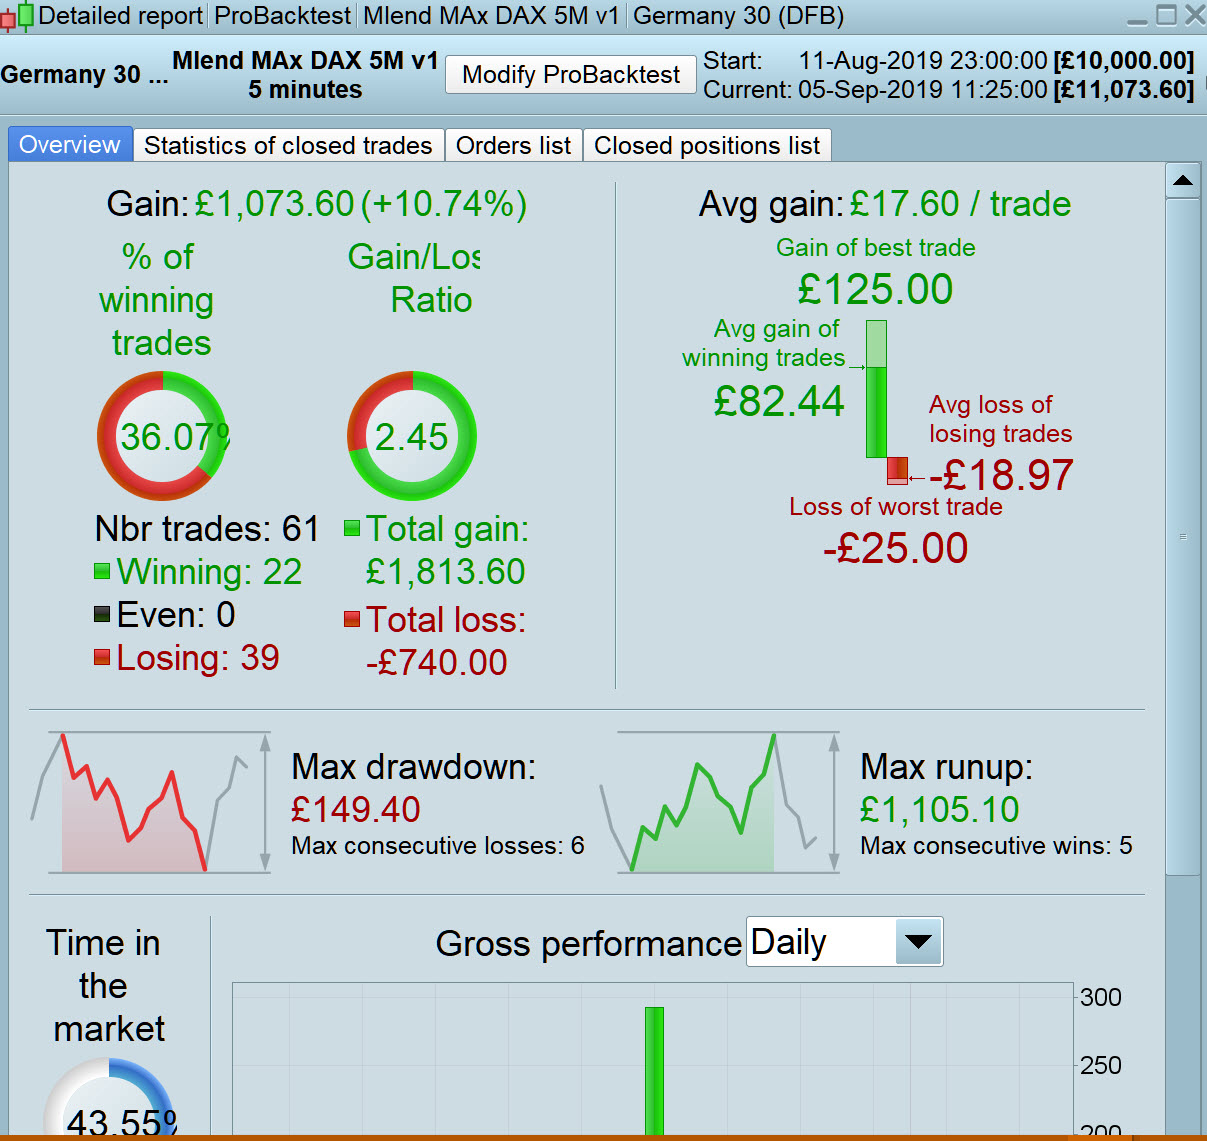
@Malend … you may like to consider attached … it’s your code but on DAX 5M over 10k bars with spread = 2
Thanks a lot Grahal,
I am gonna check it out right now.
Marc
So I guess there is something else I didn’t do right.
Try below as the 1st line of code
DEFPARAM CUMULATEORDERS = False
Thanks Graham,
Makes definitely sense.
I also see some bugs in my strategy definitions and what happens when I am in a buy postion and a sell signal shows up.
Work for me to do. Great.
Thanks a lot, again. Marc
Be good to share any improvements please?
I have the version I posted above running in Demo Forward Test.
It works Graham, I am testing it also with other backtest variations.
The only thing I would like to have is that when I am in an a position that the TA or the SL stops that position, and not a start from a new postion the other direction. It can open a new position, but better for me would be to have only one psotion open.
but better for me would be to have only one psotion open.
Which version / code are you referring to … your original code, my version or some new version of yours?
Always best to post the code then others may spot the reason for your Issue.
Also if you have optimised a lot of variables then it is very useful to post the .itf with the optimiser already set up with variable names, range and steps … as I did in the .itf I posted above to help you. Makes it easier / quicker for folks to help and improve further.
Cheers
Thanks Graham for your feedback how to use this platform. I will post my latest update today with the questions and when itb works in the end.