Bard
BardParticipant
Master
Hi
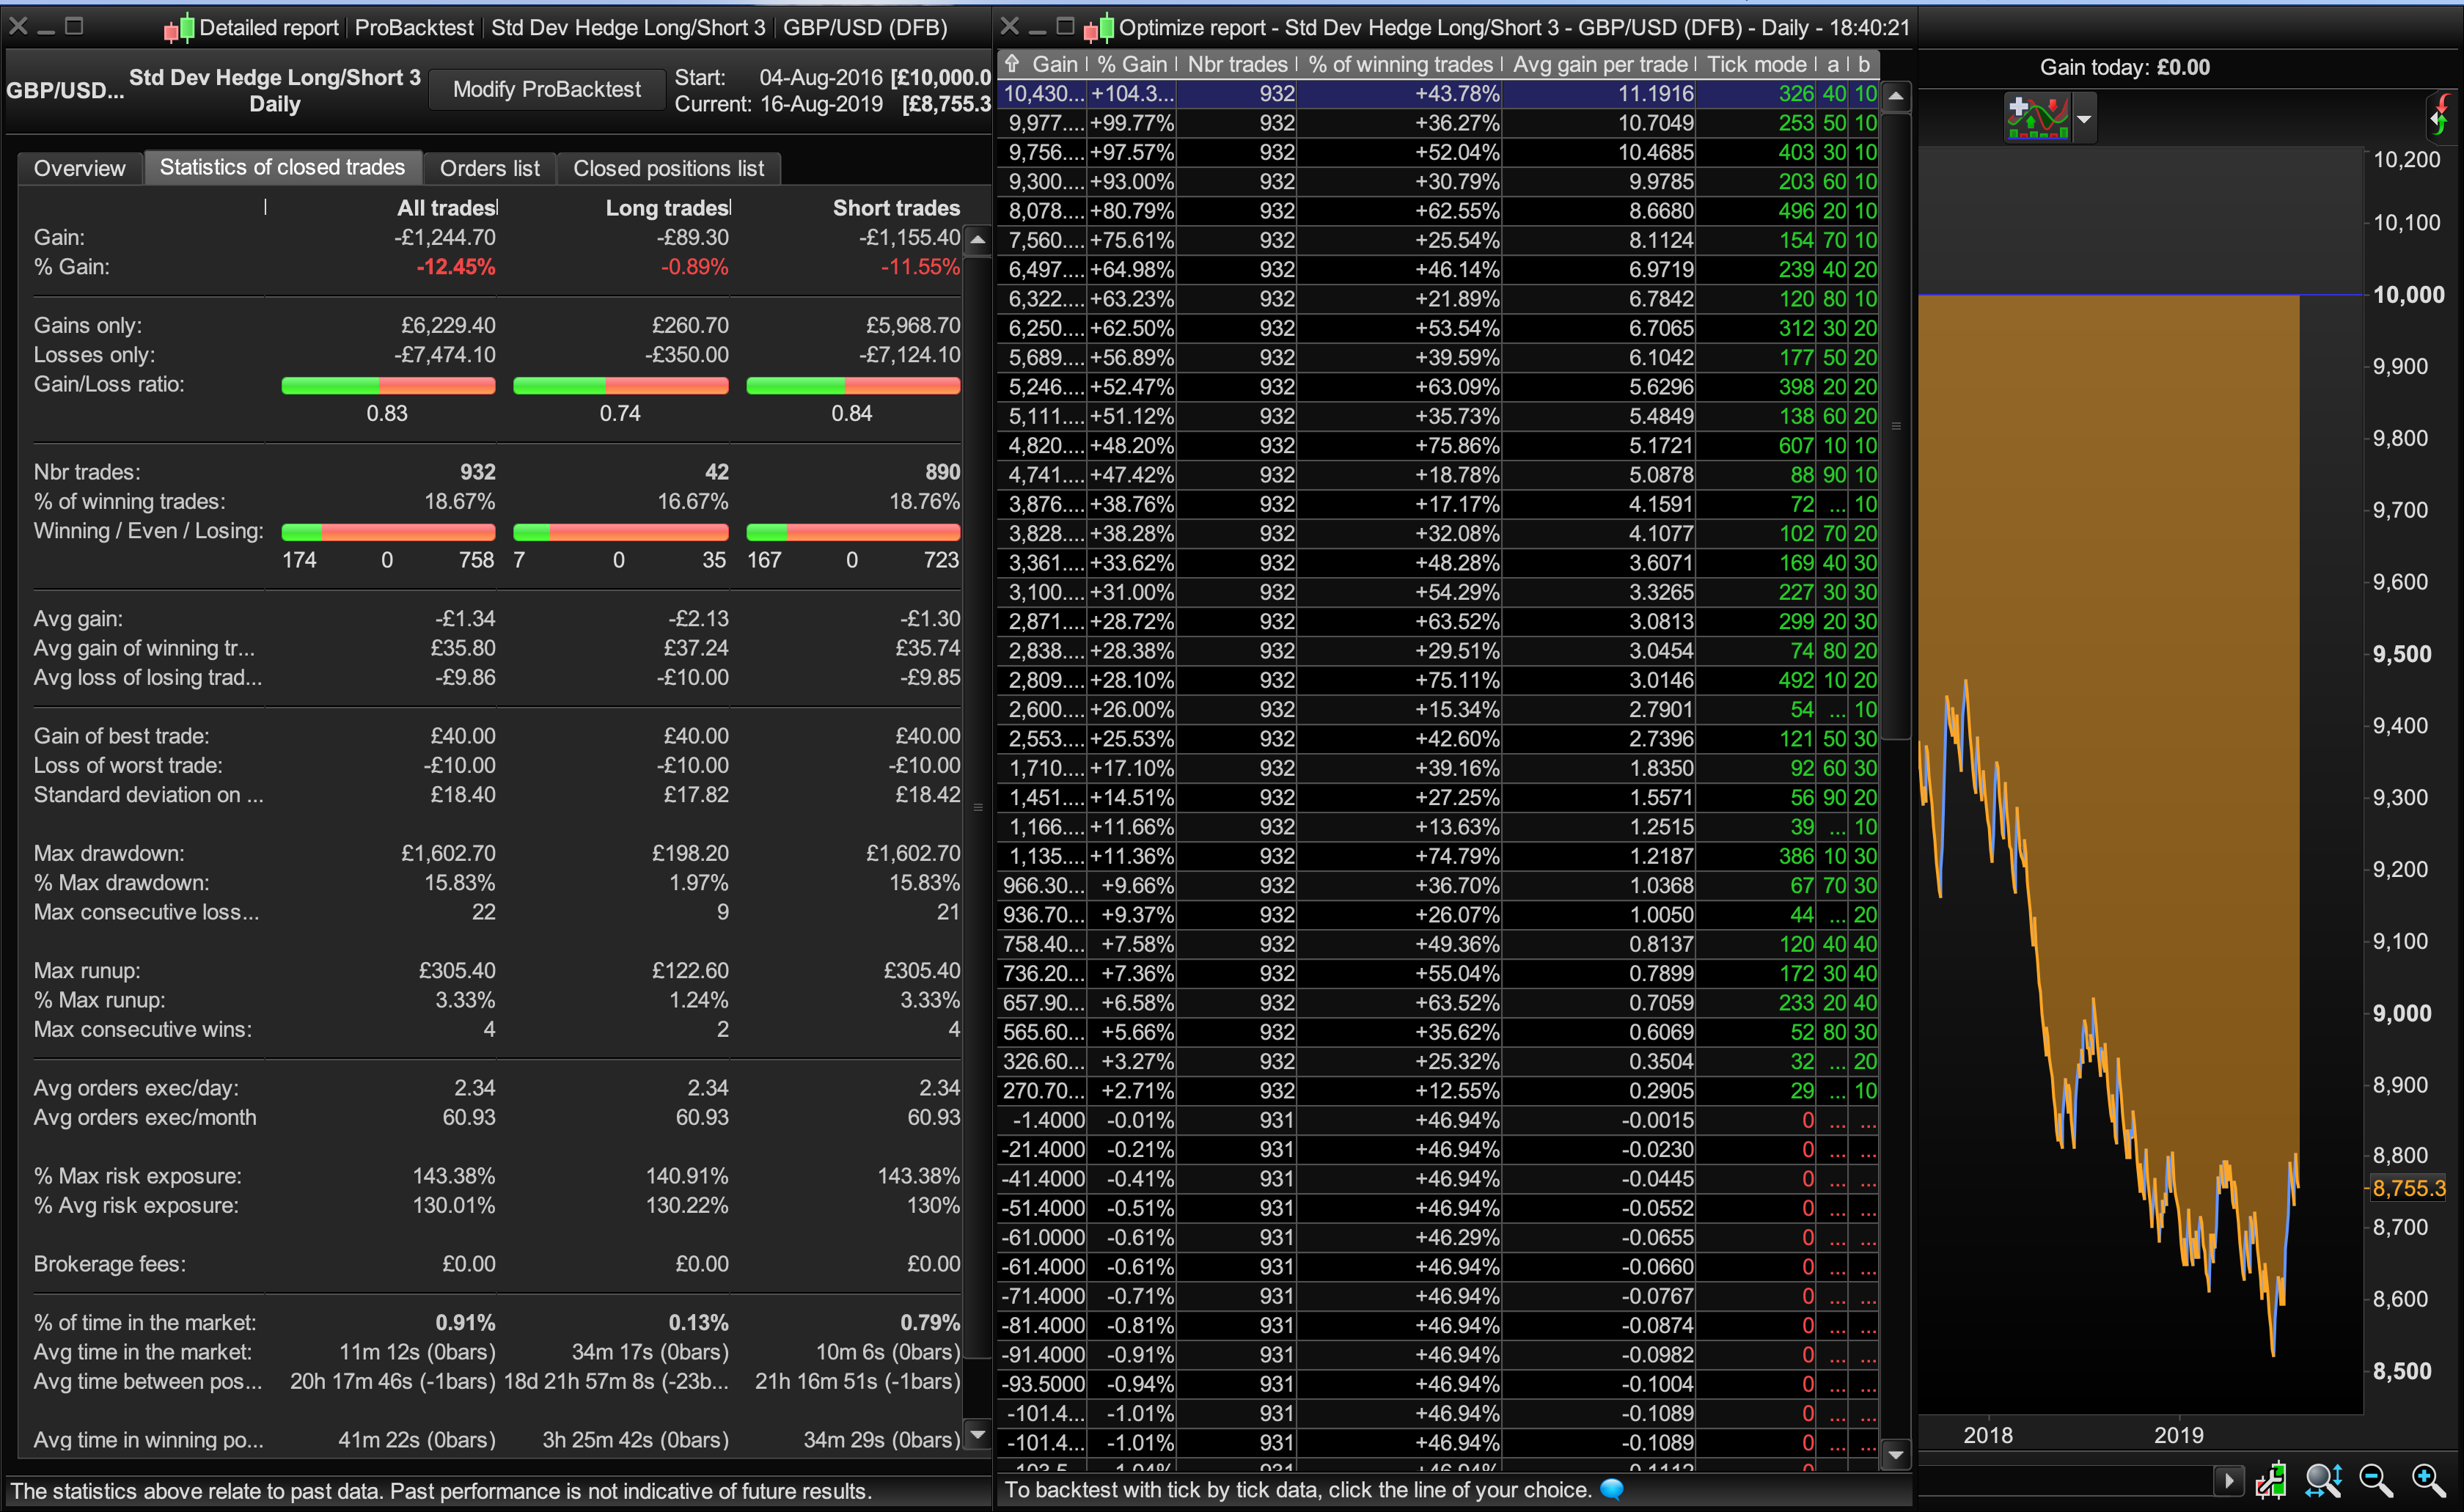
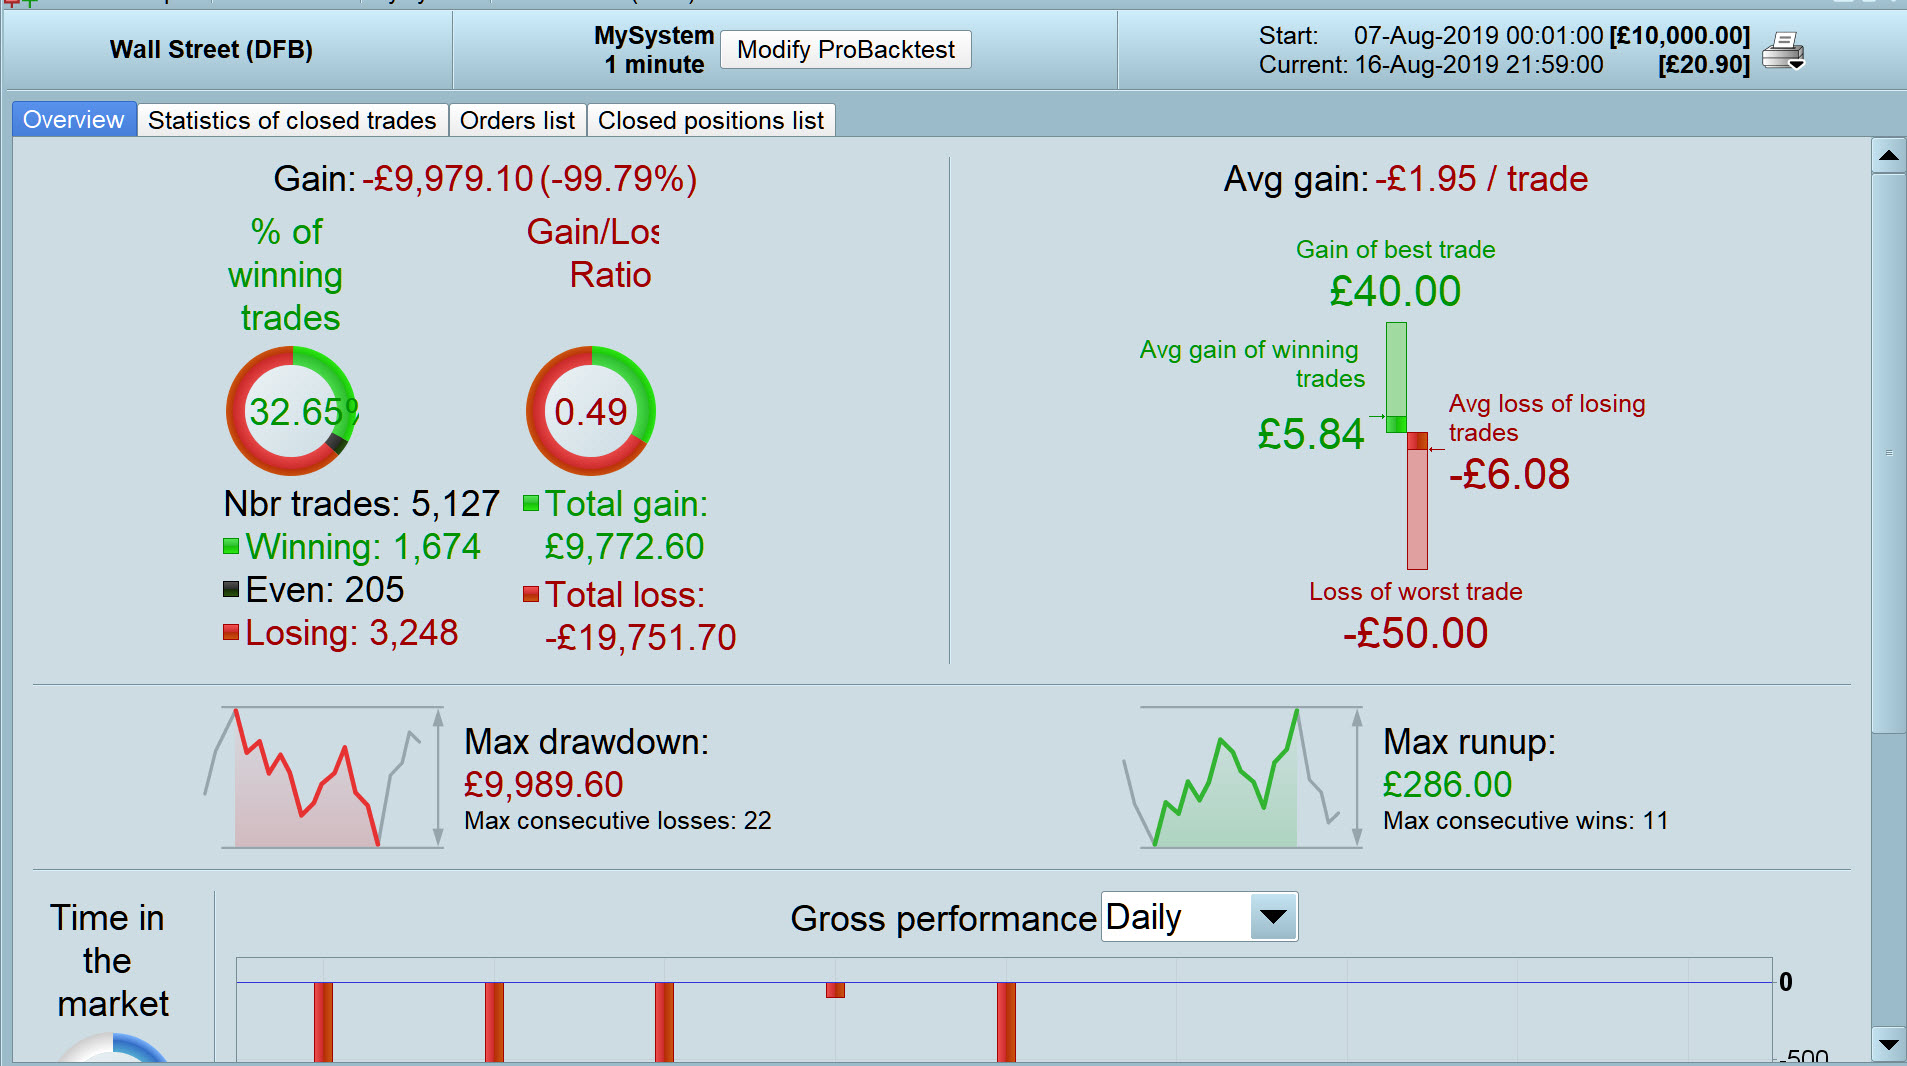
I was looking at a developing a hedging strategy. The idea being that with the correct risk:reward ratio it should be possible to beat the spread/commission. I wanted to also include ATR conditions but when I set up a basic long and short entry model it gives conflicting profit / loss reports. I’ve not encountered an Optimisation Table that produces a profit yet the Detailed Report shows a loss? Pls see screenshot.
£/$ Daily / 3.8 Spread / Date: 4/8/16 9pm to 18/8/19 5pm / Probacktest tick mode — on.
Any ideas? It seems to be behaving as if I have unticked the Probacktest tick mode because the profits achieved in the optimisation window are replicated in the Detailed Report when the box is unticked and tick mode is off and I enter 50 ticks for the profit target and 20 ticks for the stop loss (removing optimisations values a and b).
Cheers!
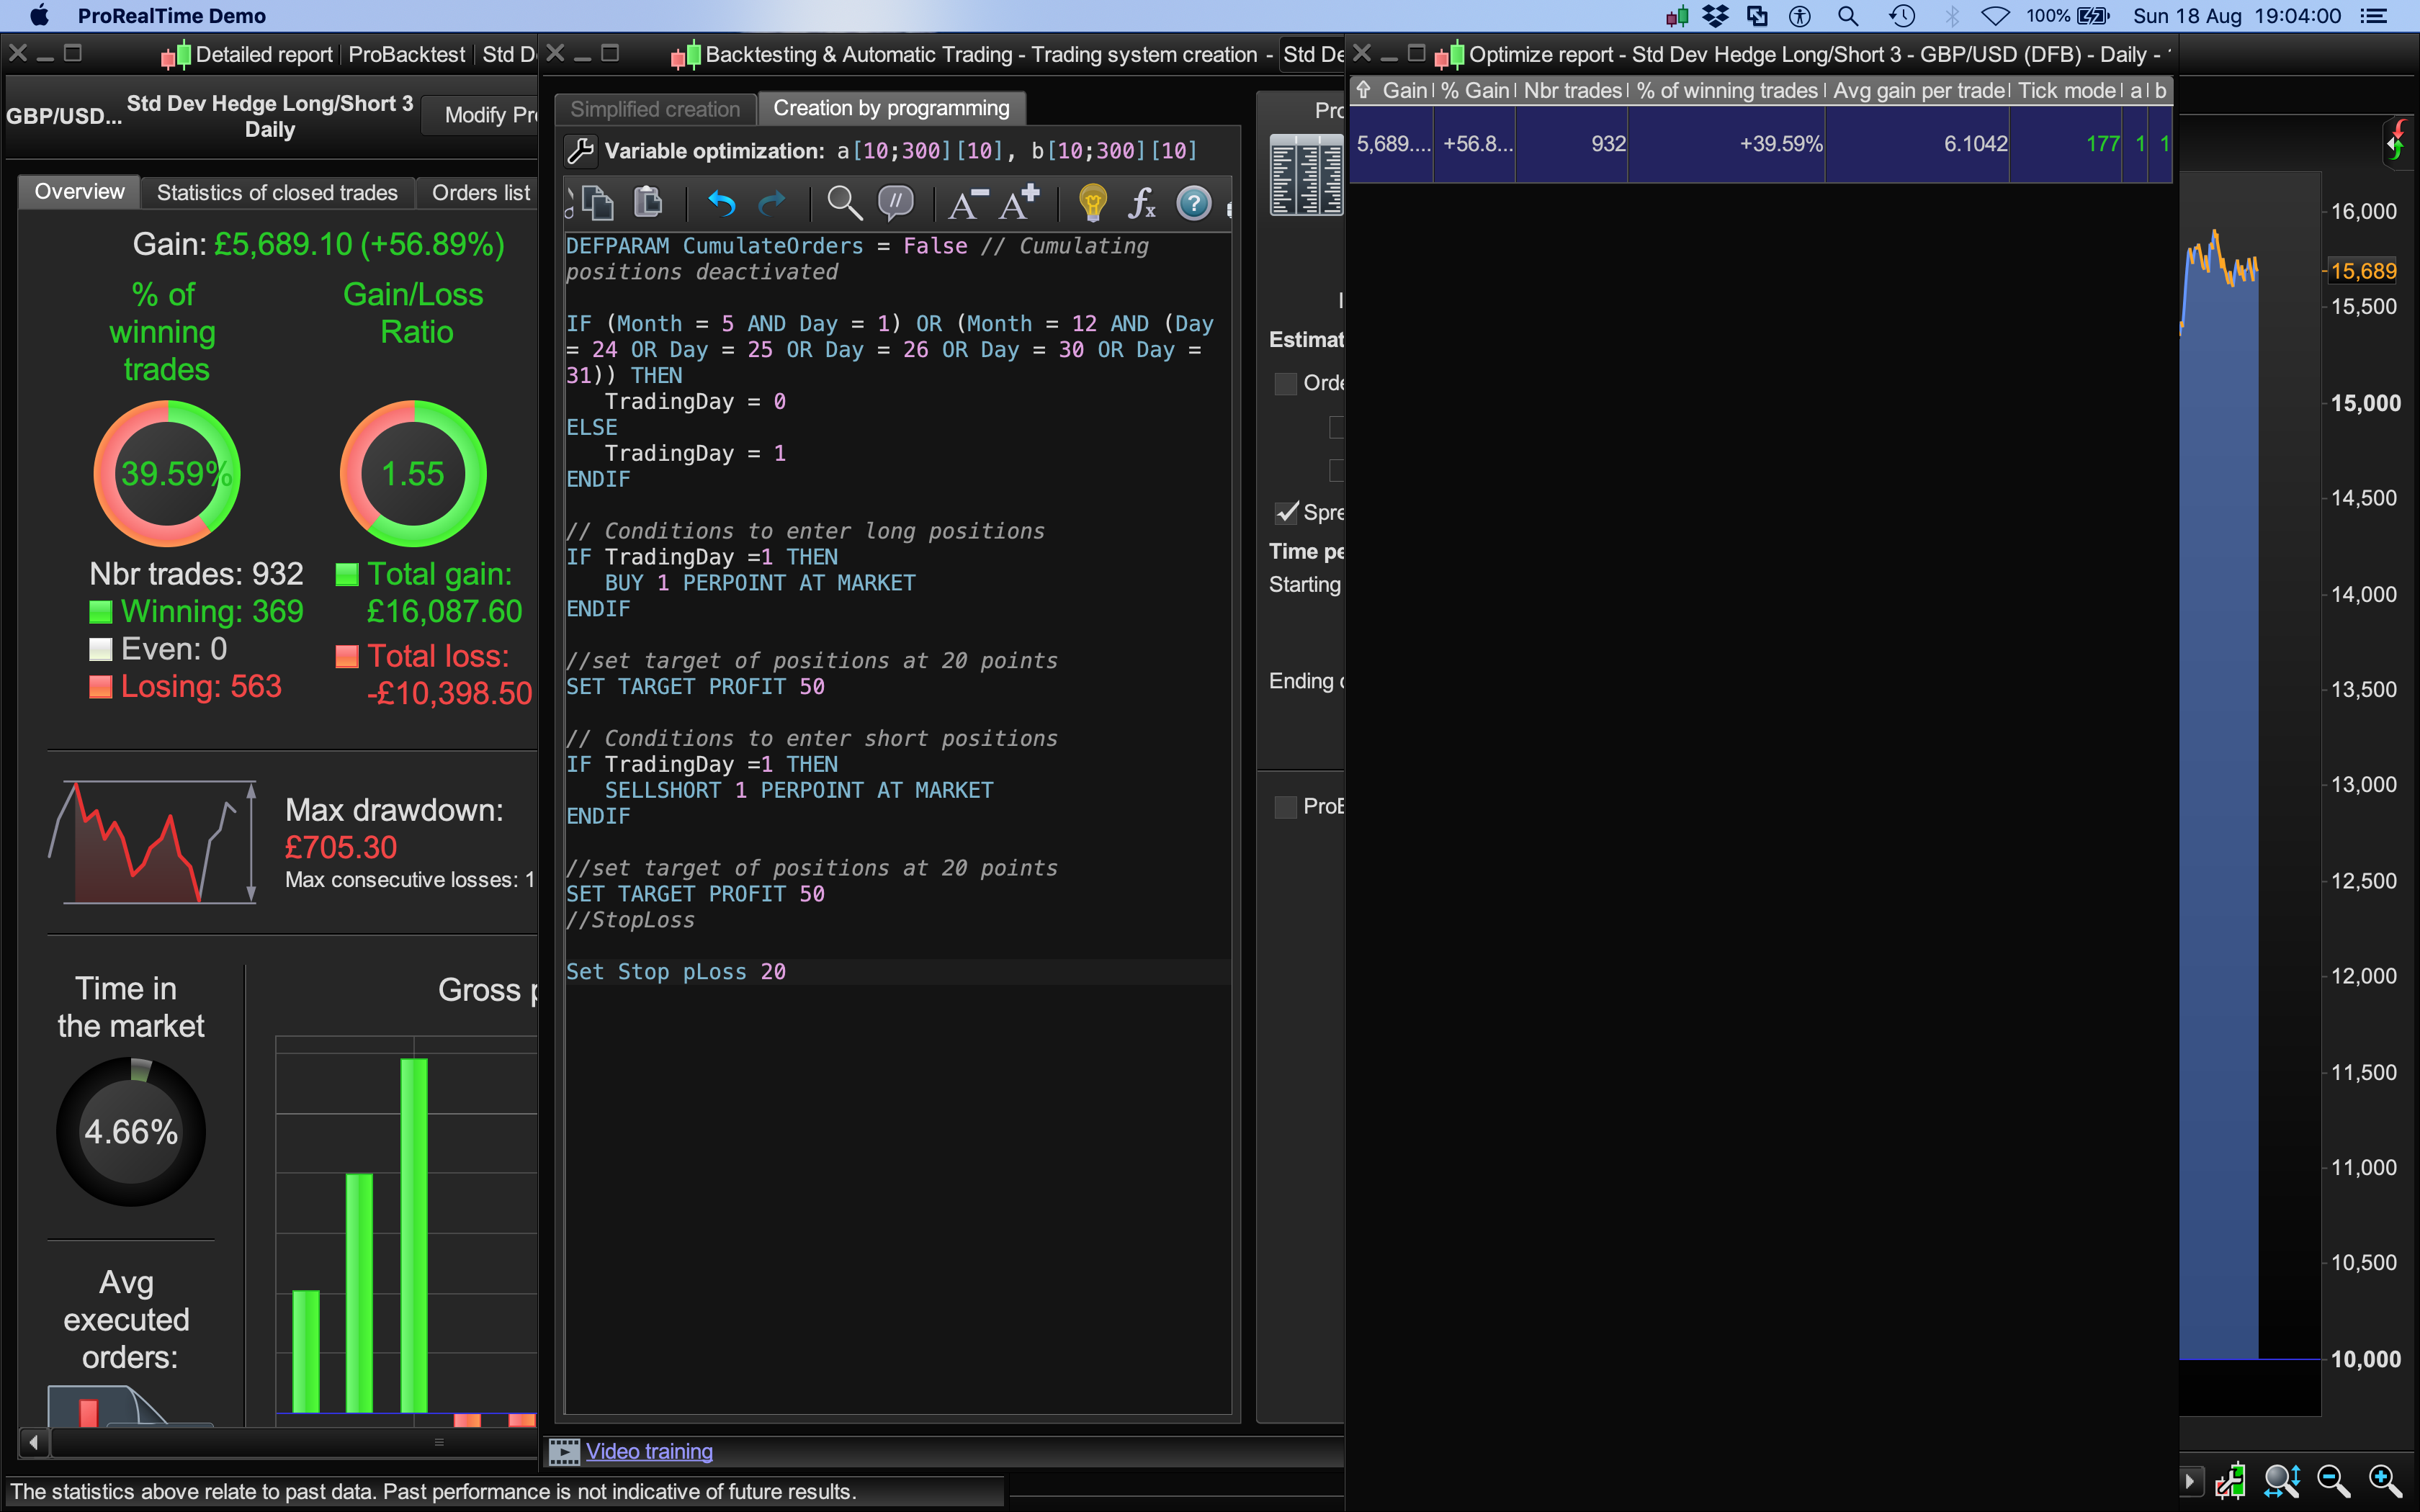
DEFPARAM CumulateOrders = False // Cumulating positions deactivated

IF (Month = 5 AND Day = 1) OR (Month = 12 AND (Day = 24 OR Day = 25 OR Day = 26 OR Day = 30 OR Day = 31)) THEN
TradingDay = 0
ELSE
TradingDay = 1
ENDIF

// Conditions to enter long positions
IF TradingDay =1 THEN
BUY 1 PERPOINT AT MARKET
ENDIF

//set target of positions at 20 points
SET TARGET PROFIT a

// Conditions to enter short positions
IF TradingDay =1 THEN
SELLSHORT 1 PERPOINT AT MARKET
ENDIF

//set target of positions at 20 points
SET TARGET PROFIT a
//StopLoss

Set Stop pLoss b
Forgive me Bard, I’ve read your post 3 times and I still can’t my head around the Issue (I’m sure it’s my fault!?).
I get a loss on the Optimise Table and a loss on the Backtest.
Please can you say what I am doing that is different from what you did??
BardParticipant
Master
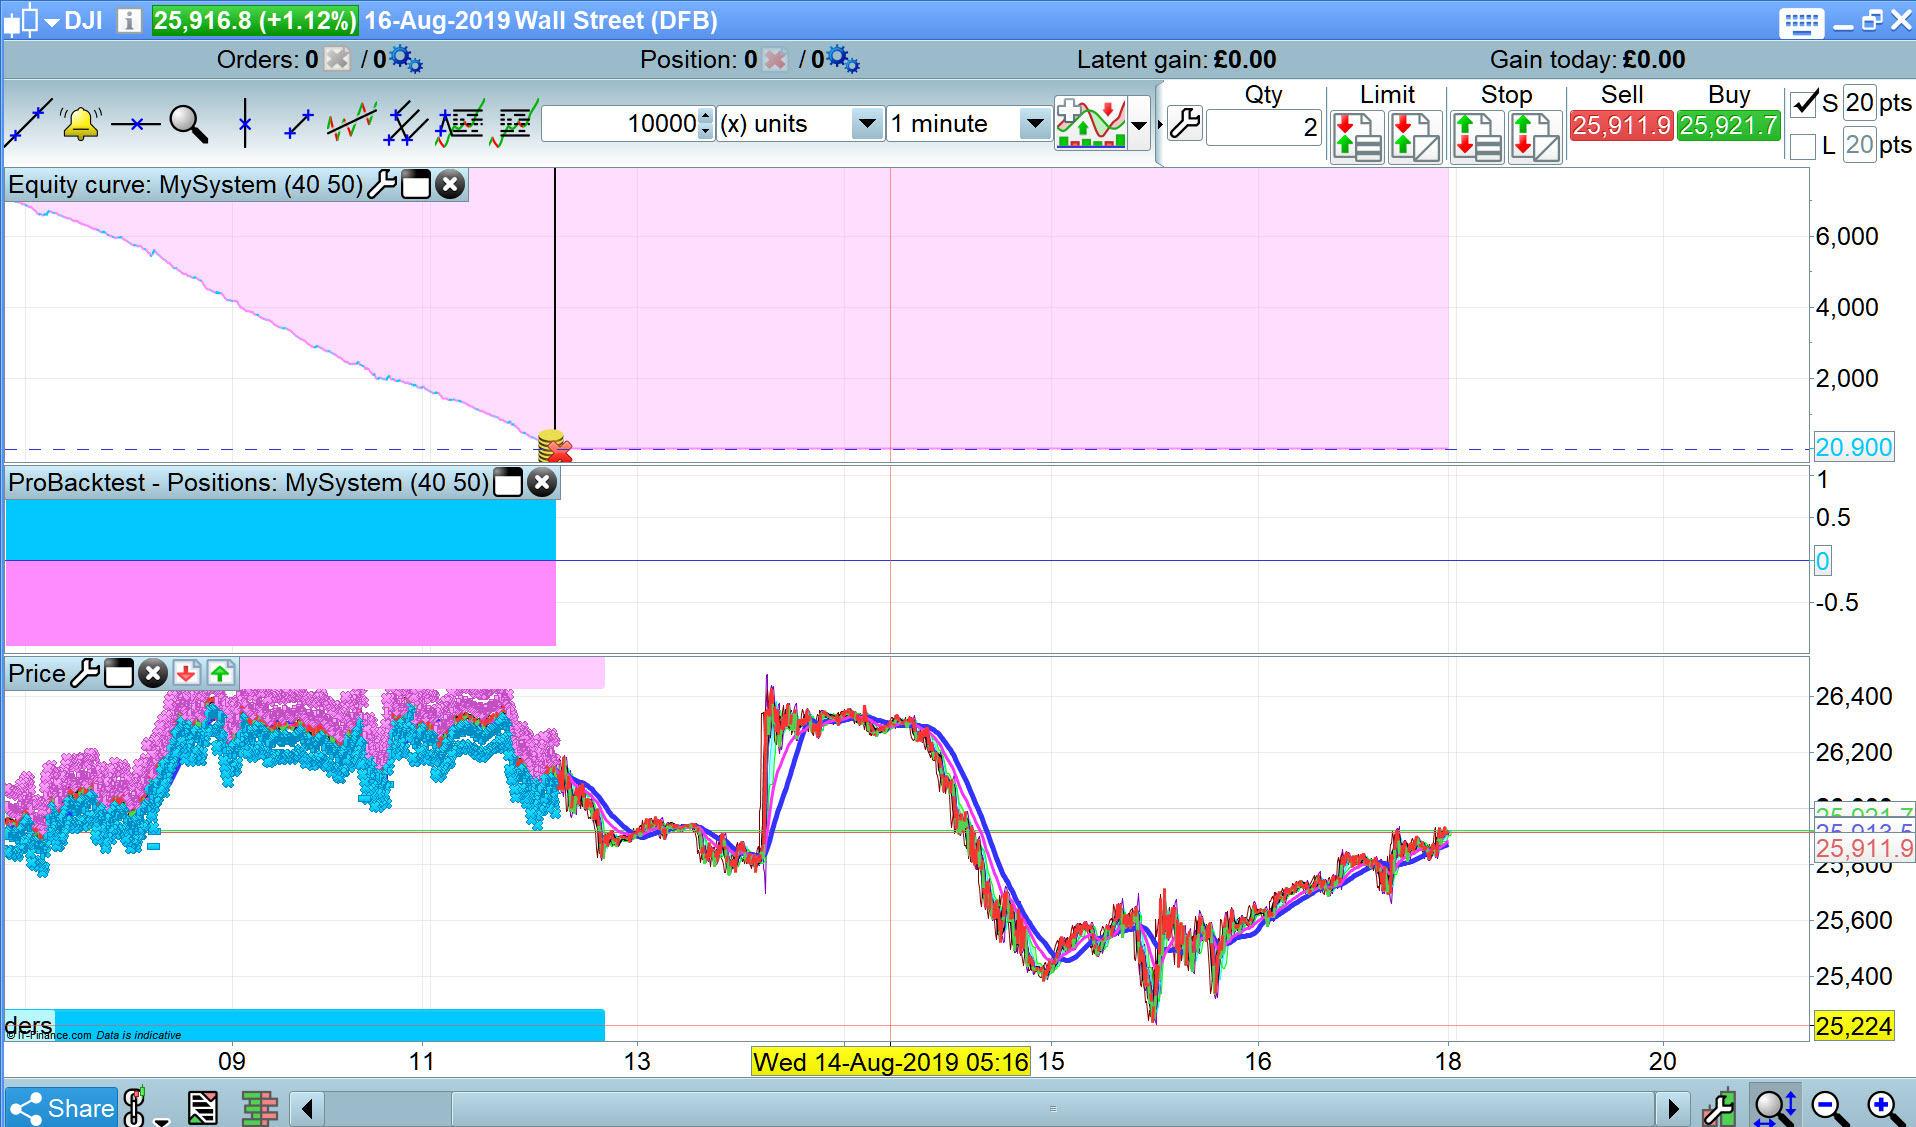
Hi @GraHal, thanks, yes, all of your windows are consistent with a loss whilst testing a tick by tick backtest.
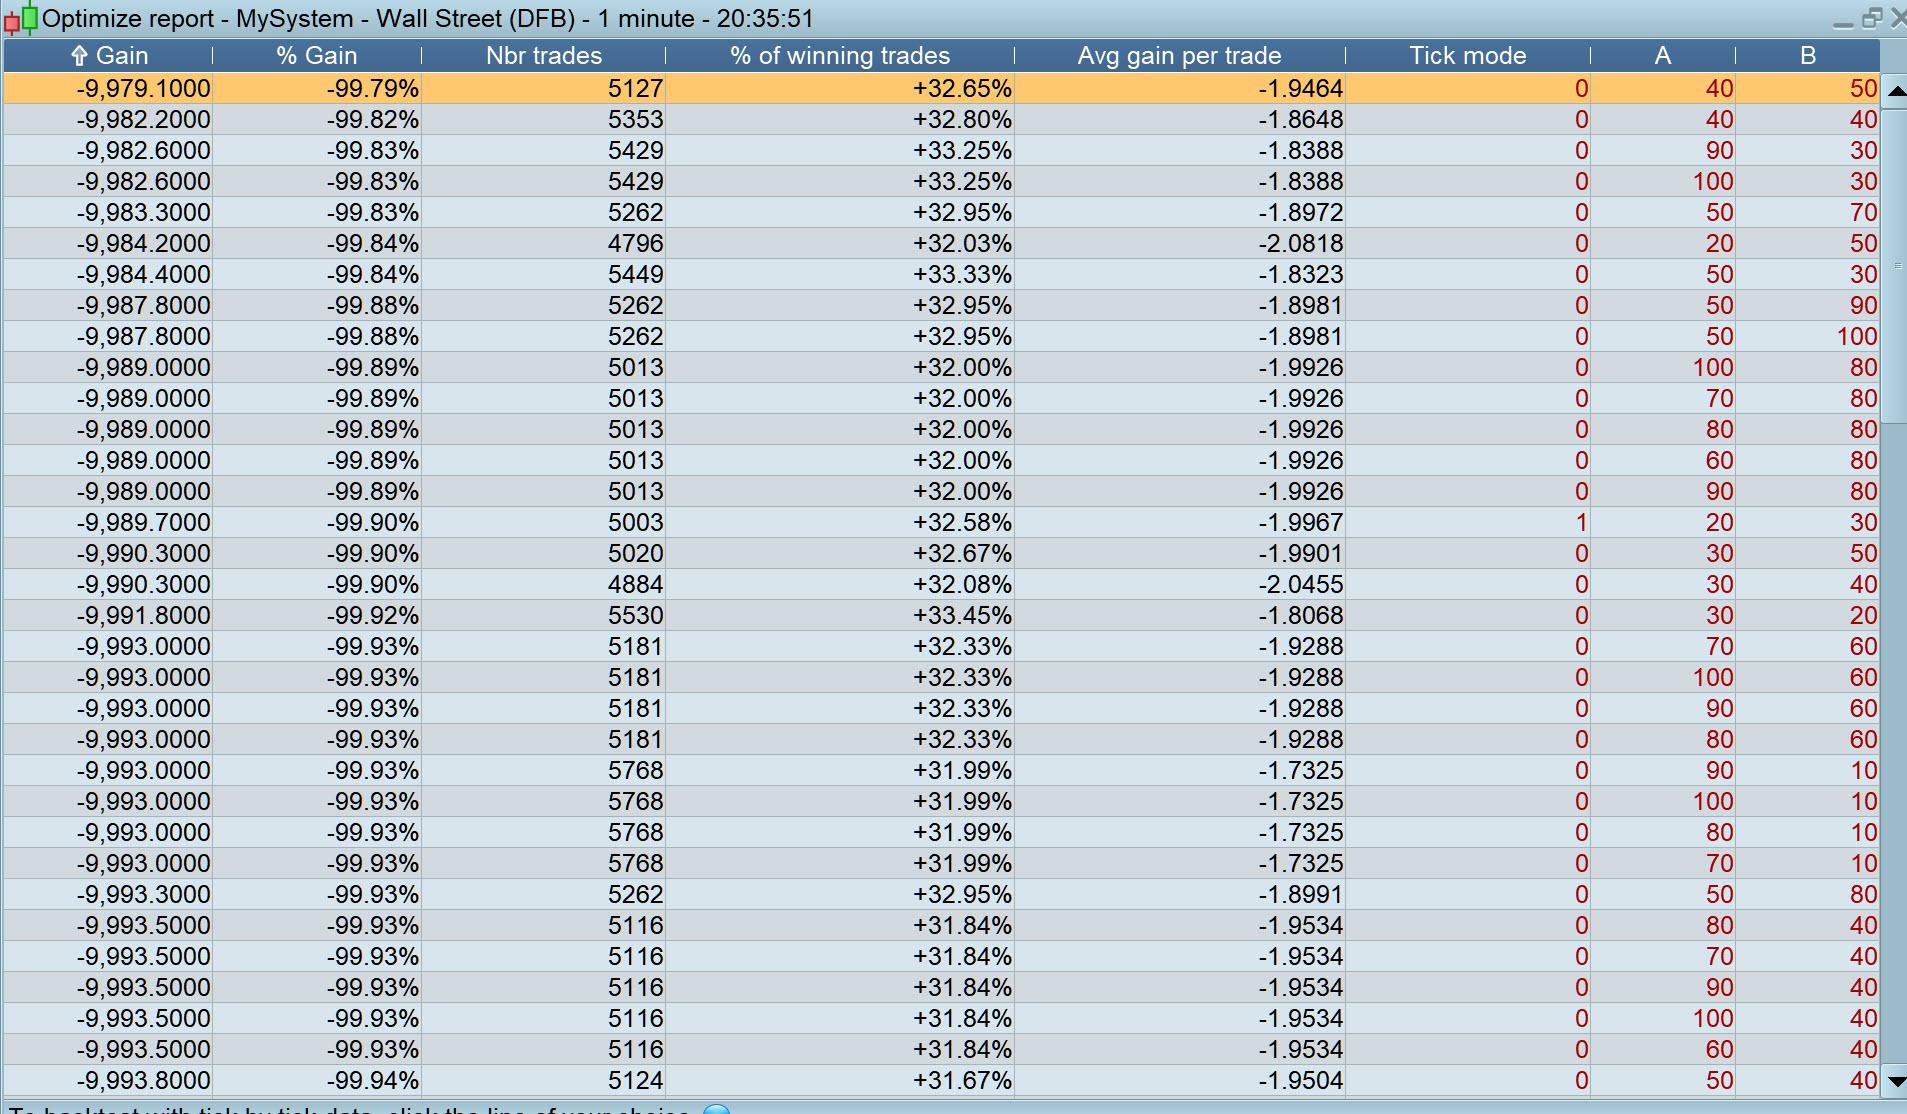
What I have and didn’t expect to see is rows of green profit in the optimise window (middle of image 1a). There should be nothing but rows of red losses in that optimise window (I had selected ) because hte chart and Detailed Report windows show losses.
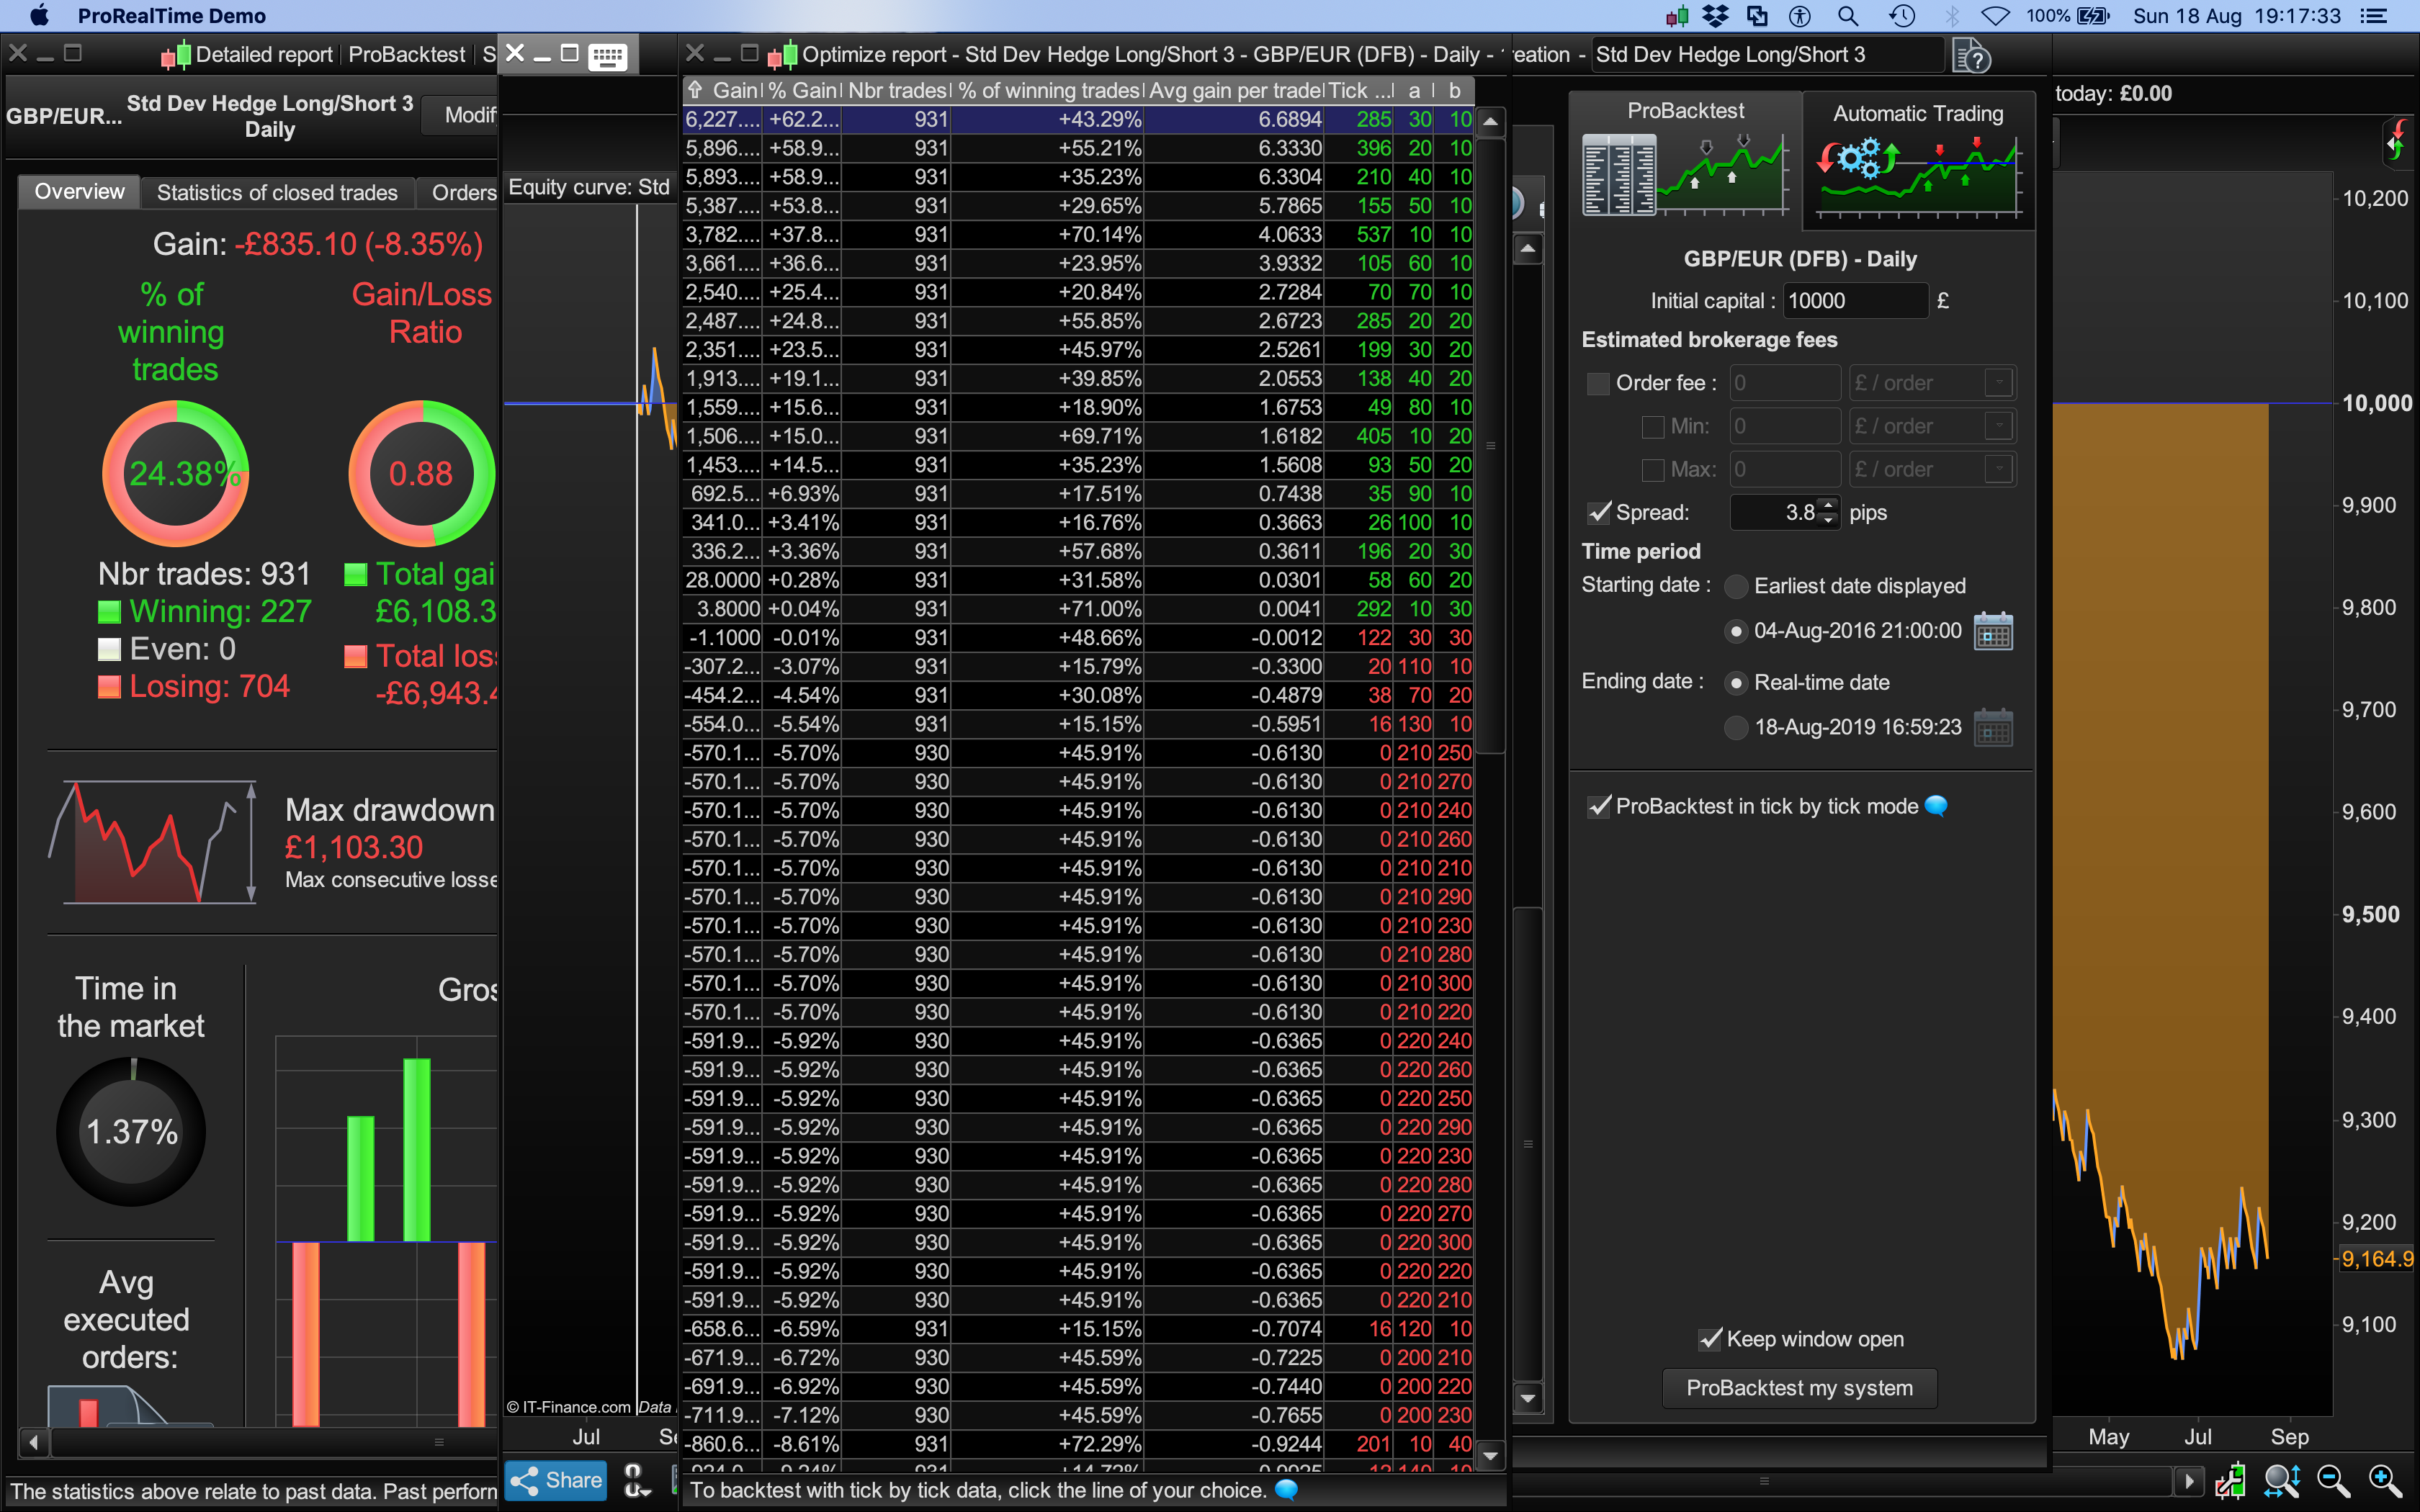
The next image (1b) is what happens wen you unselect Probacktest optimise tick by tick, when that is unticked of course you make lots of money! In my second post (image 2.2) it’s the same identical error: Profits show up in the optimise Window. How can that be? I think the system was testing as if the Probacktest tick by tick was unticked solely for that Optimise Window.
Ah gotcha now, yes a very weird Issue you experience (but not me) … is it the same today for you??
BardParticipant
Master
Hi @GraHal, I don’t think I want to find out.. lol, maybe later..
I have had some success with this going long and short at the same time hedging idea on backtest.
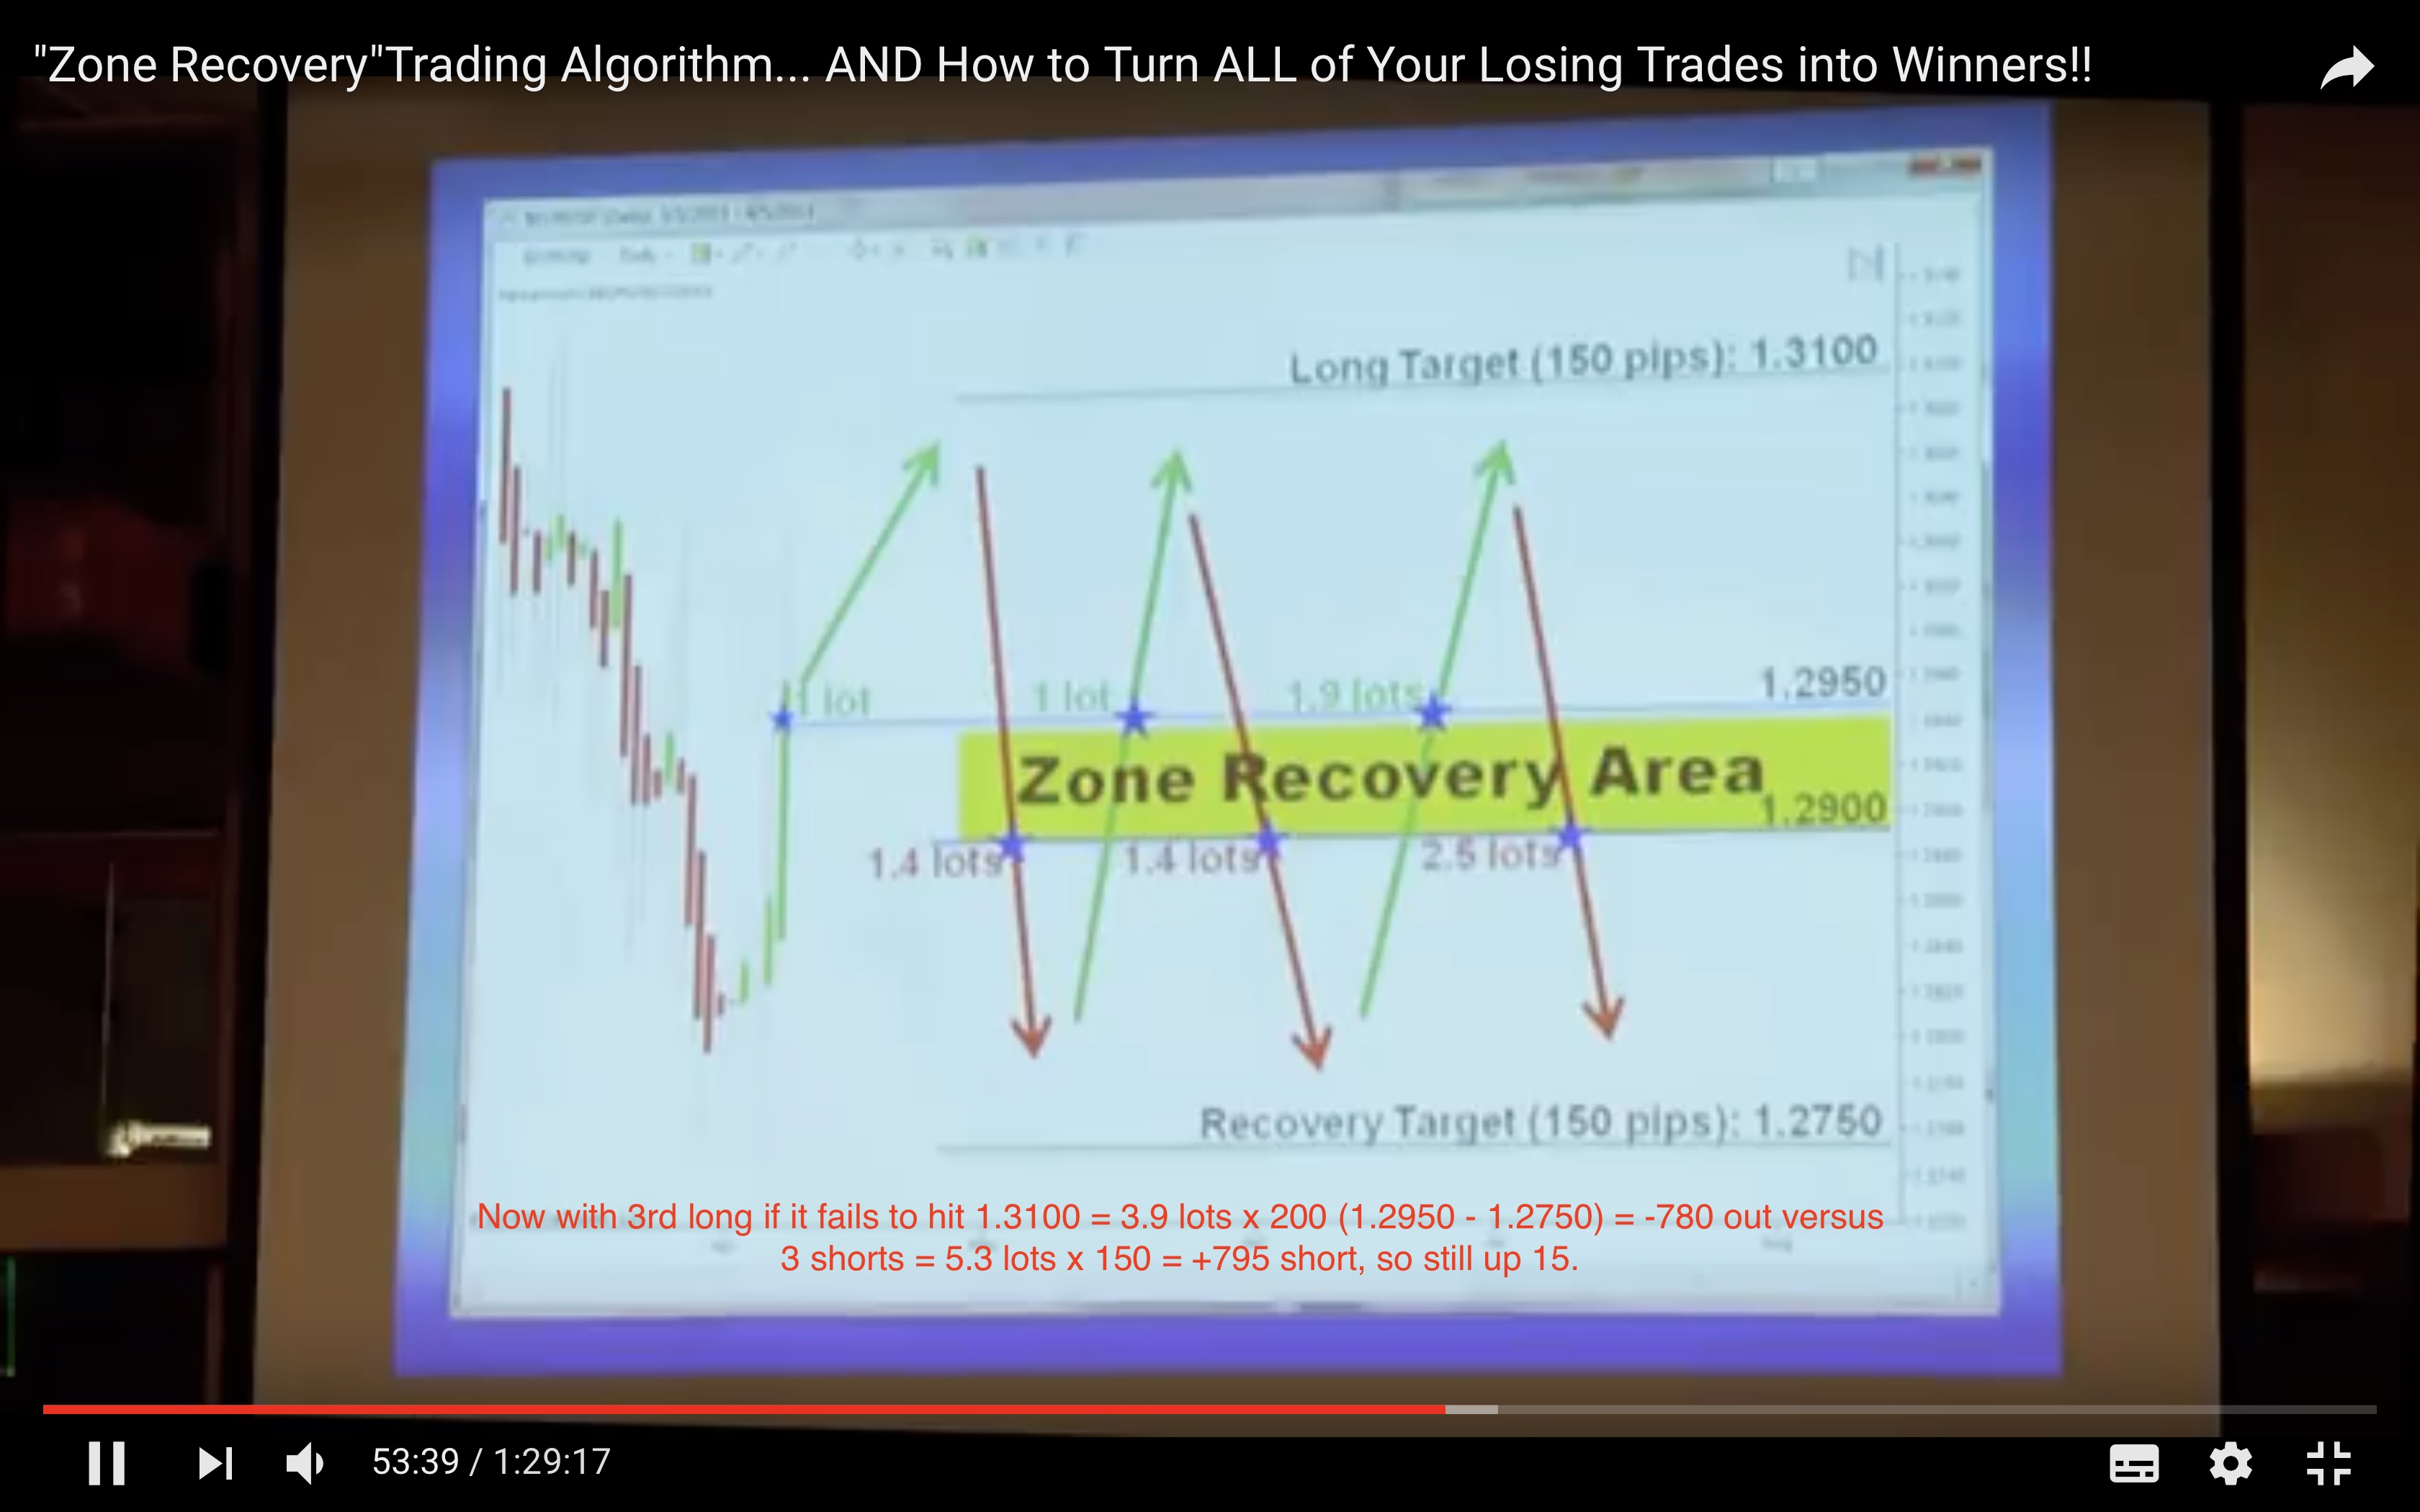
I read that this could work in an article from FXCM, then a friend sent me a YT link about Trader Joseph Nemeth. If you watch from around 39 mins it explains it, (his entry technique is before this — it’s a combination of Renko/Heinken Ashi and 20EMA & MACD):
https://www.youtube.com/watch?v=DJz4E7VyeSw
My thought is what if he had a really long sideways range? He would run out of account margin/capital maybe?
I think to be fair though he just takes the loss if his “unique” Martingale hedging technique fails after 3 longs and 3 short hedges: The image comes from YT at 53 mins and 36 secs.
You can’t optimise with tick-by-tick, even if the checkbox is checked, the optimisation window will only list results made without it.
The strategy you are talking about, the famous “recovery zone” is working as intended, it is also named as “sure fire hedging”. In fact, it exists since years and there are many variants (I coded it for the first time about 7 years ago!). It works ok (as a martingale is supposed to work) in a trendy market. If the market is ranging and you accumulate a lot of position, you can widen the recovery zone to avoid triggering new useless orders for example, ..
I spent a bit longer looking at your screen shots …
- 1st Image – profit in the optimisation window, e.g. 10,430 is what you would get if you had a tick mode reading of 0 / zero. You however, have a tick mode reading of 326.
So when the 326 tick by tick scenarios are run then the 10,430 profit turns into a loss of – 1,244.70.
If we want Optimisation Table readings to be same / similar as shown on the resulting equity chart then we need to use / choose values for variables that give 0 / near zero in the tick mode column.
Hope above helps you to understand what was going on @Bard?
BardParticipant
Master
Hey @GraHal, thanks for taking the extra time to look at this. Right.
we need to use / choose values for variables that give 0 / near zero in the tick mode column
How do we do that? At the moment I was curious to find the risk:reward ratios and then see if by taking into account the standard deviation or ATR, you can incorporate that data into the system increasing the risk/reward balance and hopefully payoff.
Cheers
How do we do that?
If you use low values for TP and SL then there will be high incidence of SL occurring before TP and so a high number in the tick mode column.
The reverse is true … so make the max value higher for TP and SL and you will see combinations of TP and SL which give 0 / near zero in the tick mode column on the Optimisation Table.