I’m messing around with a long only MTF strategy that makes all its decisions and has all the code on the monthly and weekly time frames but trades on the daily chart but there is no code under a daily timeframe. This is purely to allow it to trade as one day divides into a week and divides into a month but a week does not divide into a month – Yes MTF confuses me sometimes too!
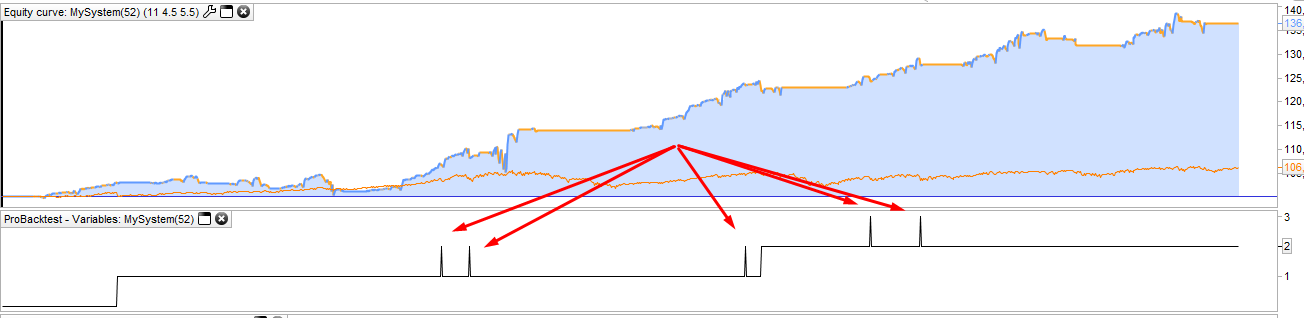
I have an IF THEN condition which if it is met sells everything and within this same IF THEN I add one to a variable just so that I can graph the variable and see how many times the condition led to trades being closed. Nothing ever subtracts from the variable but when I GRAPH it I get the weird spikes shown in the image.
a week does not divide into a month – Yes MTF confuses me sometimes too!
It doesn’t thought does it, but you know that so you must mean something different than I read?
Vonasi please … what keyword(s) do I need to search for to find your code for including trial / virtual trades in a strategy so that if > x losing trades the strategy does not trade until > y winning trades?
Thanks
What I don’t get is if I am just using month and week time frames then I can only open and close trades on the first candle of a week so what difference does it make that a week does not divide into a month? If I am looking at indicator values either on the fly during the month or at the end of the week it is the same thing as I can only look at them at the end of the week as I only have two time frames.
Anyway this is a little off topic – it was the spikes that was bugging me more as I can’t trust the results of the graph that is shown.
to search for to find your code
Aha it was Nicolas code, but I was sure you did one also?
‘Simulated trades’ is the keyword anyway …. found the code via google.
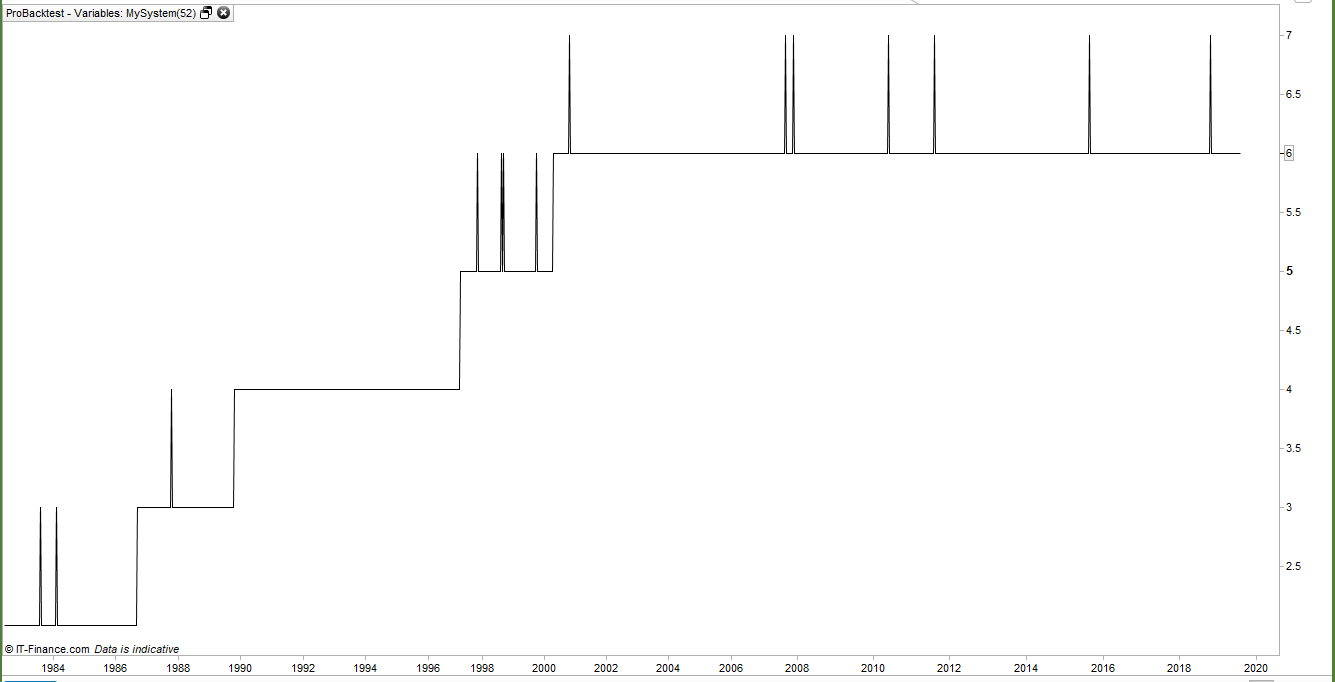
The spikes are only jumping from 1 to 2 or 2 to 3, so I think that there must be something in the code that makes this behavior and might be linked to a calendar condition that doesn’t exist: such as bank holidays, gap, ..
There is no date conditions in the code at all. It simply looks for the low to be above a value on the monthly timeframe and then on the weekly timeframe checks for a down week and buys at the end of the week on a daily chart. There are two exit conditions both on the weekly chart and both contained within their own IF THEN ENDIF’s. There is never anything deducted from the ex variable so I don’t understand the spikes. The code is something like this:
timeframe(monthly, updateonclose)
mflag = 0
if (my condition1) then
mflag = 1

timeframe(weekly)
wflag = 0
if close < open then
wflag = 1

if wflag and mflag then
buy 1 contract at market
endif

if onmarket and (my exit condition1) then
sell at market
endif

if onmarket and (my exit conditions) then
sell at market
ex = ex + 1
endif

graph ex
Well, if there is nothing in the code that decrease the ex value, there is no reason that it jumps from 2 to 3 and then suddenly decrease from 3 to 2.
BUT! Did you try with “updateonclose” for the weekly timeframe?
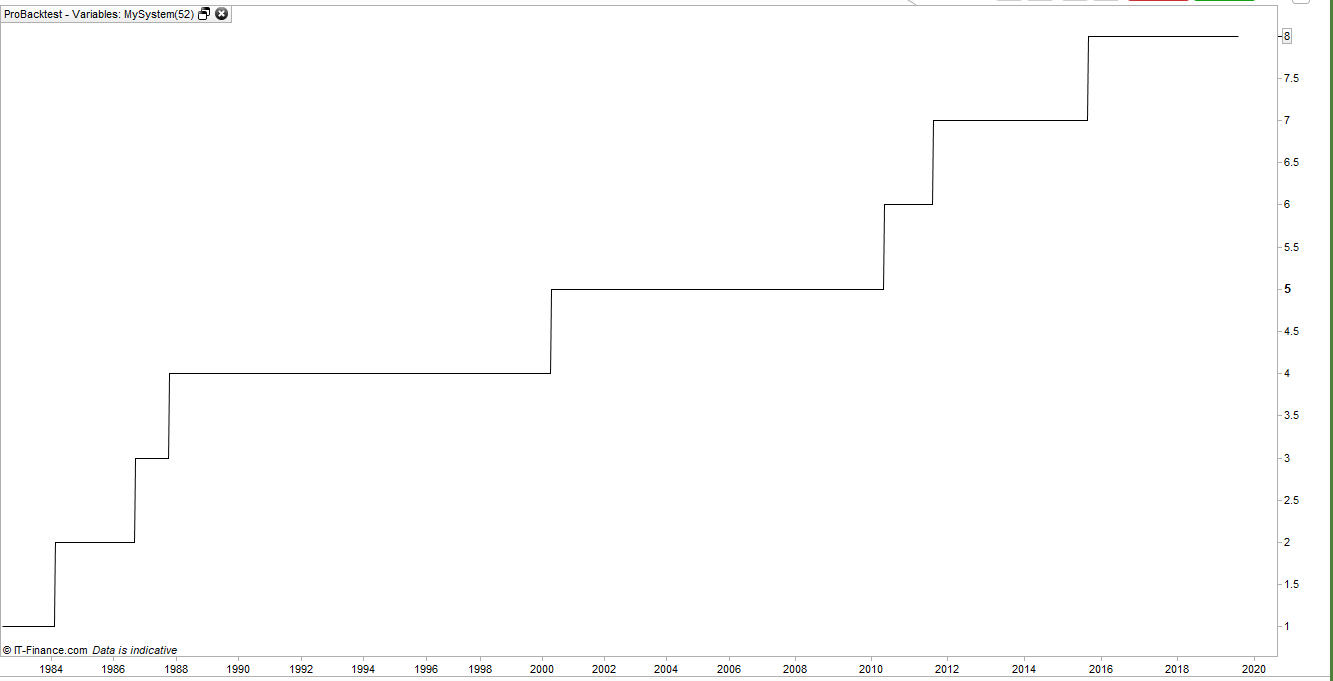
With UPDATEONCLOSE it draws the correct line but with DEFAULT it draws a line with the impossible spikes.
Yes, so there is something that happens during the week between the open and the close, because if we only read the code at Close we have no spike.
BTW, I still can’t understand how the ‘ex’ variable can decrease!
I still can’t understand how the ‘ex’ variable can decrease!
This is why I posted it! It’s a weird MTF bug! As I’m only using it to count how many times a condition occurs and to graph that it is not so important but if it was a variable that I used in the code for decision making then that is a little more important.
The first image is with DEFAULT and the second is with UPDATEONCLOSE. The value is different throughout except when it spikes.
I tried putting the GRAPH under the TIMEFRAME(DAILY) but that didn’t change anything.
Ok so because it happens during the life of a weekly candlestick, it would be nice to find similarities of when it happens: specific day of the week? hole in the data? ..
It seems pretty random. The last spike was on a Wednesday when selling can only occur on a Monday.
I even tried this to see if it was an issue with two exit conditions being true at the same time but it makes no difference:
if onmarket and (exit condition1) then
flag = 1
ex = ex + 1
endif

if onmarket and (exit condition2) then
flag = 1
endif

if flag = 1 then
sell at market
flag = 0
endif

graph ex
selling can only occur on a Monday when you updateonclose a weekly timeframe.