






Trend Surfer DAX
Hi guys,
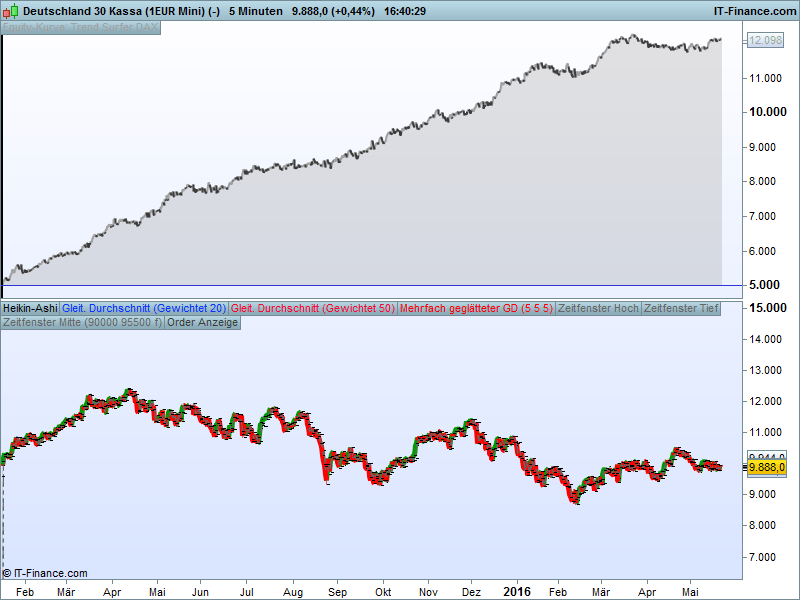
my first post 🙂 is one of my DAX systems based on the TDI indicator working on a 5 minute chart.
have fun
Reiner
// Trend Surfer DAX

// code-Parameter
DEFPARAM FlatAfter = 170000

// DAX trading window
ONCE BuyTimeMorning = 90000
ONCE SellTimeMorning = 110000
ONCE BuyTimeAfternoon = 150000
ONCE SellTimeAfternoon = 170000

// traders dynamic indicator
ONCE q = 14
ONCE r = 4
ONCE t = 29

// tdi filter parameter
ONCE longPriceLevel = 35
ONCE shortPriceLevel = 40
ONCE middleBandLevel = 40

// trading parameter
ONCE PositionSize = 1
ONCE sl = 250
ONCE tp = 50

// position management during trading window
IF (Time >= BuyTimeMorning AND Time <= SellTimeMorning) OR (Time >= BuyTimeAfternoon AND Time <= SellTimeAfternoon) THEN

 // calculate TDI indicator
 RSIasPrice = RSI[q](customclose)
 Priceline = Average[r](RSIasPrice)
 MiddleBand = Average[t]((RSIasPrice))

 // open position
 // long
 IF Not LONGONMARKET AND Priceline > MiddleBand AND Priceline > longPriceLevel AND MiddleBand > middleBandLevel THEN
  BUY PositionSize CONTRACT AT MARKET
 ENDIF

 // short
 IF Not SHORTONMARKET AND Priceline CROSSES UNDER MiddleBand AND Priceline > shortPriceLevel THEN
  SELLSHORT PositionSize CONTRACT AT MARKET
 ENDIF

 // close position
 IF Time = SellTimeMorning OR Time = SellTimeAfternoon THEN
  // long
  IF LONGONMARKET THEN
   SELL AT MARKET
  ENDIF
  IF SHORTONMARKET THEN
   EXITSHORT AT MARKET
  ENDIF
 ENDIF

 // stop and profit
 SET STOP pLOSS sl
 SET TARGET pPROFIT tp

ENDIF
Comments
You must be logged in to post a comment.
Hi Reb,
Sorry for the late response.
I traded this strategy only last year and stopped after the equity curve flattened. In my opinon this strategy works well in volatile long and short phases but to be honest I haven't analyze this very deeply. I'm a fan of the TSI indicator and use it as signal trigger for my day trading. I think this esay strategy is valueable but requires some improvements. Unfortunately my time is limited and as you may have seen here in this forum at the moment I focused on the Pathfinder trading system.
regards
Reiner


Hallo Reiner,
ich habe Deine Strategie in PRT (IGMarkets) geladen und versuch die Performance nachzuvollziehen. Ich habe den 1EUR Mini Dax in den 5M eingestellt. Leider ist die Performance bei mir komplett negativ. Muss ich noch etwas an den Workstation-Optionen/Trading-Optionen verändern?
Bin für jeden Tipp dankbar.
Hallo DonDollar,
habe gerade das System laufen lassen. Mit einem Startkapital von 5.000 Euro und einem Spread von 1 Punkt komme ich bei 100.000 Kerzen von Juni 2015 bis heute auf eine Performance von circa 63% (8.191 Euro). Das System läuft allerdings mit den eingestellten Parametern seit Mitte März seitwärts. Spezielle Parameter ausser Startkapital und Spread müssen nicht gesetzt werden.
Gruss
Reiner

@ thebigdeal
Bonjour,
Va sur mon site (lien dans ma présentation), regarde dans "stratégies", celle sur le DAX... tu ne seras pas déçu.
Je ne peux pas te donner de lien direct ou t'en dire plus, car mon but n'est pas de faire de la pub ici.


bonjour
bon au final les amis je recherche un robot de scalping ou de day trading court qui rapporte qui se déclenche et se referme suivant un environnement déterminé et un tendance haussière déterminée quil détercte tout seul, est ce que quelqu'un ici sur ce site à un vrai robot autonome qui donne de vrais résultats .. et qui est totalement abouti ou presque merci de me tenir au courant

Hi,
FYI : Code for the famous Traders Dynamic Index aka the "TDI" by Nicolas ;-) http://www.prorealcode.com/prorealtime-indicators/traders-dynamic-index-tdi/
Reiner, in your code for the TDI indicator :
// Priceline (red) -> green
RSIasPrice = RSI[q](customclose)
Priceline = Average[r](RSIasPrice)

// Signalline (green) -> red
Signalline = Average[q](RSIasPrice)
hello reiner
ty for your codes,very interesting.
I am looking if during time 11h-15h,it will be possible to do something with a code based on 3 mn with exponential averages and pivot points.
But for this moment,I have to much trades.
bye
Hi larouedegann,
You are on the right way. All of my highly profitable strategies work together with certain times. The good old open range breakout strategy between 9:00 - 10:00 is still one of my best performing algos over the last months.
I found the following statistical accumulations between 11:00 - 14:00, but nothing that unfortunately was good enough for a reliable strategy over a longer period.
- around 11:30 the DAX tends short (buy 11:30, sell 12:00)
- around the noon auction 13:00 the DAX tends long (buy 12:45-1250, sell 13:00), this works sometimes reliable but not profitable over a longer period
- around 13:30 the DAX tends long (buy 13:20, sell 13:00), sometimes promising
- around 13:45 the DAX tends short (sell 13:30, bus 13:45 - 13:55)
better times are:
- 9:00 - 9:45-10:00 open range breakout works profitable and reliable
- 9:30 countertrend strategies are very promising
- 10:00 - 10:30 countertrend, tends short 10:15 - 10:30
- 10:30 trade the opposite of the trend 10:00 - 10:30
- 10:45 the trend switch quite often
- 11:00 - 11:30 close your postions
Hope it's helpful for your trading ideas. Let me know if you find something reliable.
regards
Reiner

Hallo Lennard,
ein Long Trade wird erzeugt, wenn die folgenden 5 Bedingungen erfüllt sind
- Zeit ist zwischen 9-11:00 oder 15-17:00 Uhr
- System ist noch nicht long
- TDI Priceline ist grösser TDI MiddleBand
- TDI Priceline ist grösser 35
- TDI Middleband ist grösser 40
Viel Spass
Reiner
Hi guys,
Thanks for your comments.
Trend Surfer based on the TDI indicator from Dean Malone. http://www.forexmt4.com/_MT4_Systems/Traders%20Dynamics/TDI_1.pdf
Cross over/under of the priceline and the middle line as trade trigger seems to be very profitable scenarios in combination with the volatile DAX trading times (9:00 - 11:00, 15:00 - 17:00). That is the main idea of Trend Surfer the rest is optimization. tp/sl are not necessary but backtests show better results.
@zilliq: I'm using IG Data and have no clue why you can't reproduce the results.
@noisette: you can use Priceline CROSSES OVER MiddleBand as well for the long trades but Priceline > MiddleBand bring better results
@Nicolas: I adapt the TDI parameter, the origin values are 13/2/35
Here is the code for the TDI indicator that i use for my DAX trading:
// Trader Dynamic Index

// Standard Setting
// Priceline is SMA(2) of RSI(13)
// Signalline is SMA(7) of RSI(13)
// Midband is SMA(35) of RSI(13)
// BolingerBand around SMA(35) using 1.62 StdDev
// Midline = 50
// SignallineUp = 70
// SignallineDown = 30

q = 13
r = 2

t = 35
u = 1.62

// Priceline (red)
RSIasPrice = RSI[q](customclose)
Priceline = Average[r](RSIasPrice)

// Signalline (green)
Signalline = Average[q](RSIasPrice)

// Bands
// MiddleBand (yellow)
StdDevRSI = STD[t](RSIasPrice)
MiddleBand = Average[t]((RSIasPrice))
// Upper-, Lowerband (blue)
UpperBand = MiddleBand + u*StdDevRSI
LowerBand = MiddleBand - u*StdDevRSI

Return Priceline AS "Priceline", UpperBand AS "UpperBand", LowerBand AS "LowerBand", MiddleBand AS "MiddleBand = Market Base Line", Signalline AS "Signalline", 68 AS "68", 32 AS "32", 50 AS "50"
have fun
Reiner
hello reiner
when i look the backtest i see that the 1st april 2016 at 110000 i have an entry
and an exit at 150000.
haw can explain this ?
hello REINER
it's normal that i have a entry at 11 00 00 and a exit at 15 00 00 ?
if i look the backtest,i see that the 1st april 2016 at 110000 i have an entry .....
and an exit at 150000 with a loose about 137 points.
how can explain this this ?
ty



Hallo Reiner
Ich finde deine verschiedenen Strategien sehr interessant. Vielen dank für deine Arbeit
If I test this strategy over the last year, from sept 2015 to march, it was very profitable, and from march to today, it is flat (or loose a bit)
Do you have the same ? did you test it before this period (2014-2015) ? Is there a seasonal reason ?
Danke im Voraus
Reb